| Param | Original file | Final file |
|---|---|---|
| Filename | modeM0/AS1A13_037T05_9000006460_51582cztM0_level2.fits | modeM0/AS1A13_037T05_9000006460_51582cztM0_level2_quad_clean.evt |
| Size (bytes) | 719,383,680 | 75,139,200 |
| Size | 686.1 MB | 71.7 MB |
| Events in quadrant A | 7,460,937 | 593,611 |
| Events in quadrant B | 3,764,051 | 687,160 |
| Events in quadrant C | 9,399,841 | 7,330 |
| Events in quadrant D | 5,502,480 | 537,897 |
| Mode M9 | |||
|---|---|---|---|
| Quadrant | BADHDUFLAG | Total packets | Discarded packets |
| A | 0 | 11 | 0 |
| B | 0 | 11 | 0 |
| C | 0 | 11 | 0 |
| D | 0 | 11 | 0 |
| Mode M0 | |||
|---|---|---|---|
| Quadrant | BADHDUFLAG | Total packets | Discarded packets |
| A | 0 | 26562 | 1 |
| B | 0 | 15463 | 1 |
| C | 0 | 32422 | 4 |
| D | 0 | 20681 | 1 |
| Mode SS | |||
|---|---|---|---|
| Quadrant | BADHDUFLAG | Total packets | Discarded packets |
| A | 0 | 132 | 0 |
| B | 0 | 132 | 0 |
| C | 0 | 132 | 0 |
| D | 0 | 132 | 0 |
| Quadrant | Total seconds | Saturated seconds | Saturation percentage |
|---|---|---|---|
| A | 6434 | 721 | 11.206093% |
| B | 6435 | 198 | 3.076923% |
| C | 6434 | 6384 | 99.222878% |
| D | 6434 | 583 | 9.061237% |
Noise dominated data is calculated using 1-second bins in cleaned event files. If a bin has >2000 counts, and if more than 50% of those come from <1% of pixels, then it is considered to be noise-dominated and hence unusable.
| Quadrant | # 1 sec bins | Bins with >0 counts | Bins with >2000 counts | High rate bins dominated by noise | Noise dominated (total time) | Noise dominated (detector-on time) | Marked lightcurve |
|---|---|---|---|---|---|---|---|
| A | 7524 | 6434 | 427 | 427 | 5.68% | 6.64% | 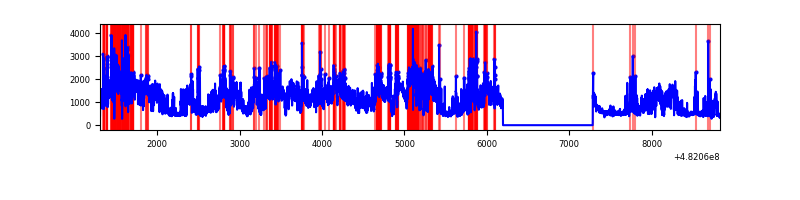 |
| B | 7525 | 6436 | 57 | 57 | 0.76% | 0.89% |  |
| C | 7523 | 6433 | 1477 | 1477 | 19.63% | 22.96% | 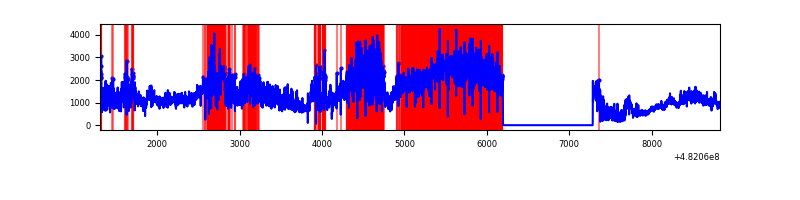 |
| D | 7524 | 6435 | 500 | 500 | 6.65% | 7.77% | 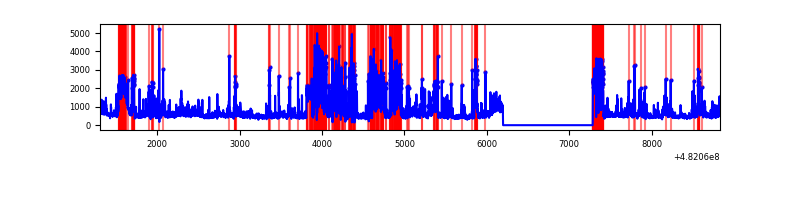 |
Top three noisy pixels from each quadrant. If the there are fewer than three noisy pixels in the level2.evt file, extra rows are filled as -1
| Pixel properties | Quadrant properties | ||||||
|---|---|---|---|---|---|---|---|
| Quadrant | DetID | PixID | Counts | Sigma | Mean | Median | Sigma |
| A | 12 | 3 | 2701206 | 15532.58 | 707 | 689 | 173.9 |
| A | 12 | 250 | 1013189 | 5823.6 | 707 | 689 | 173.9 |
| A | 12 | 194 | 322859 | 1853.03 | 707 | 689 | 173.9 |
| B | 5 | 185 | 212149 | 1377.53 | 717 | 692 | 153.5 |
| B | 4 | 174 | 195741 | 1270.64 | 717 | 692 | 153.5 |
| B | 0 | 171 | 146080 | 947.13 | 717 | 692 | 153.5 |
| C | 15 | 198 | 7714195 | 274038.25 | 93 | 92 | 28.1 |
| C | 15 | 246 | 228131 | 8100.93 | 93 | 92 | 28.1 |
| C | 15 | 215 | 186251 | 6613.17 | 93 | 92 | 28.1 |
| D | 3 | 12 | 1028625 | 5384.87 | 681 | 656 | 190.9 |
| D | 8 | 176 | 894012 | 4679.72 | 681 | 656 | 190.9 |
| D | 10 | 172 | 329848 | 1724.43 | 681 | 656 | 190.9 |
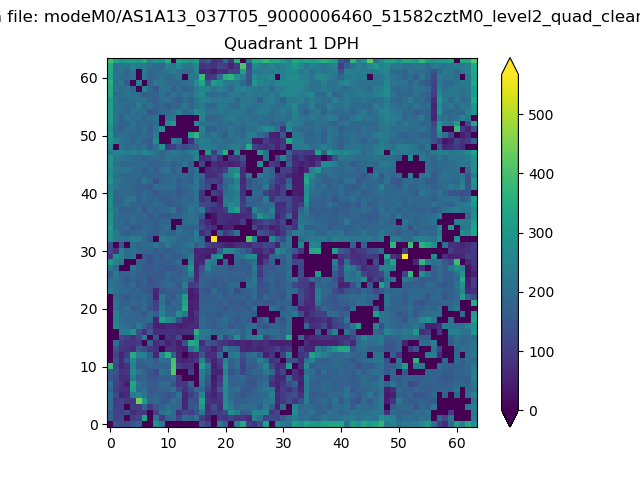
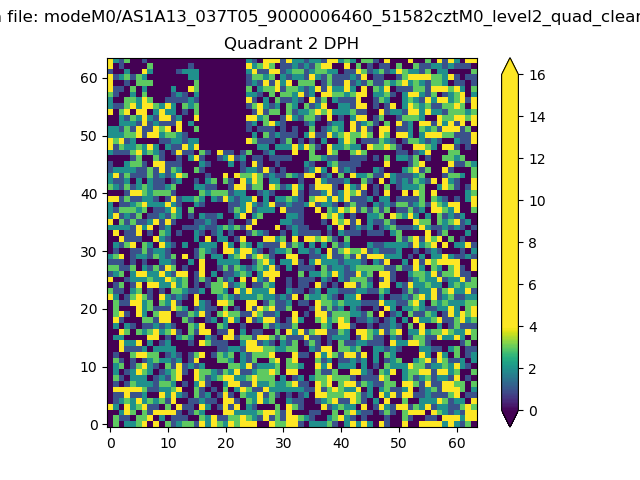
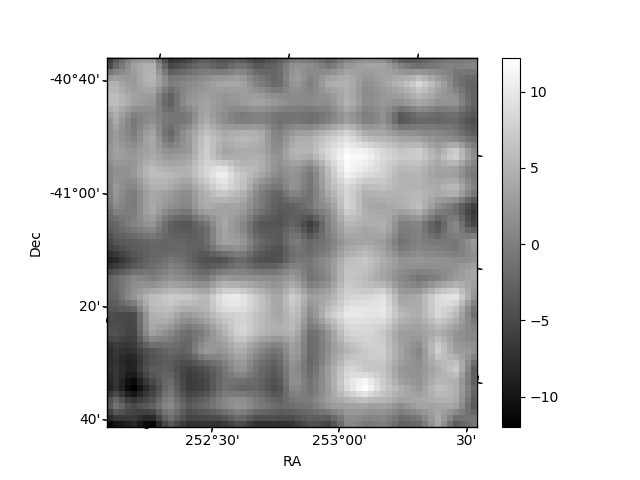
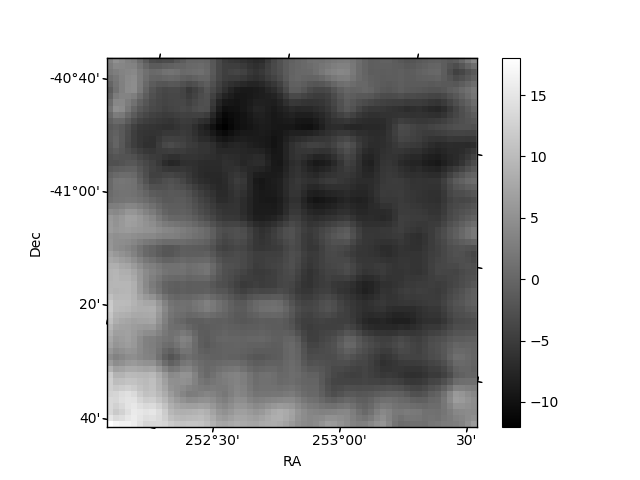
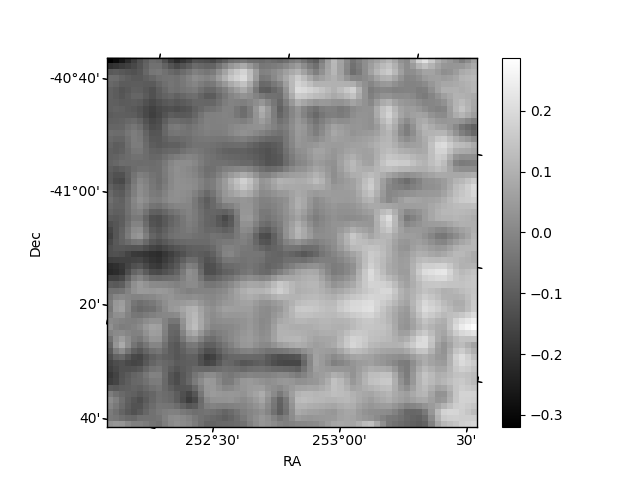
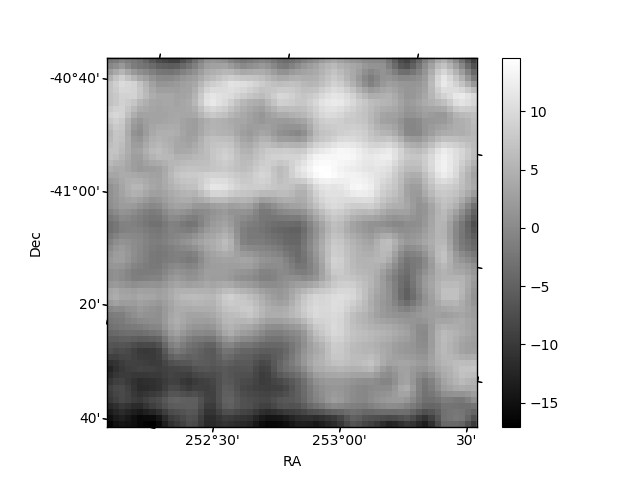
Histogram calculated using DETX and DETY for each event in the final _common_clean file
| Quadrant A |  |
 |
Quadrant B |
|---|---|---|---|
| Quadrant D | 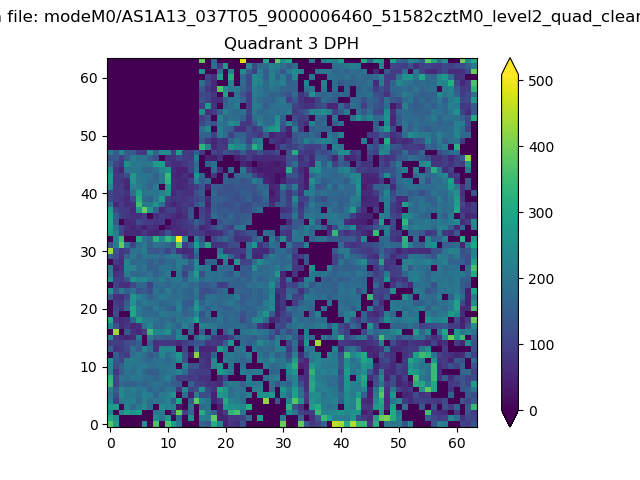 |
 |
Quadrant C |
| Plot type | Count rate plots | Images |
|---|---|---|
| Comparison with Poisson distribution Blue bars denote a histogram of data divided into 1 sec bins. Red curve is a Poisson curve with rate = median count rate of data. |
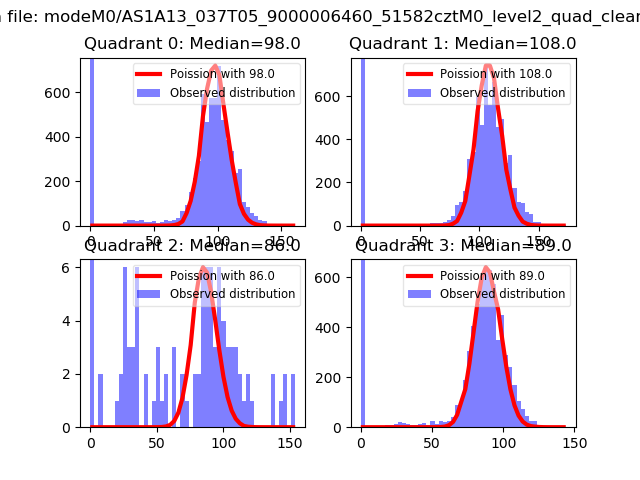 |
 |
| Quadrant-wise count rates Data is divided into 100 sec bins |
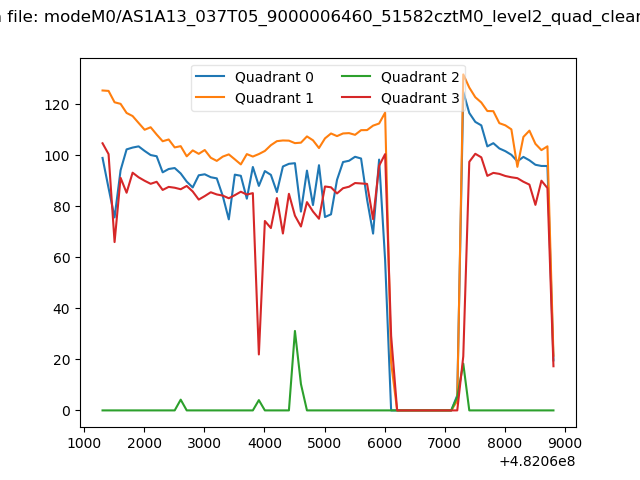 |
|
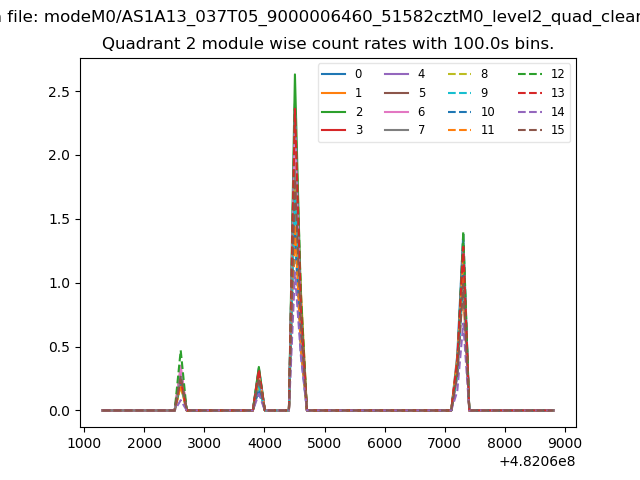
| Module-wise count rates for Quadrant A Data is divided into 100 sec bins |
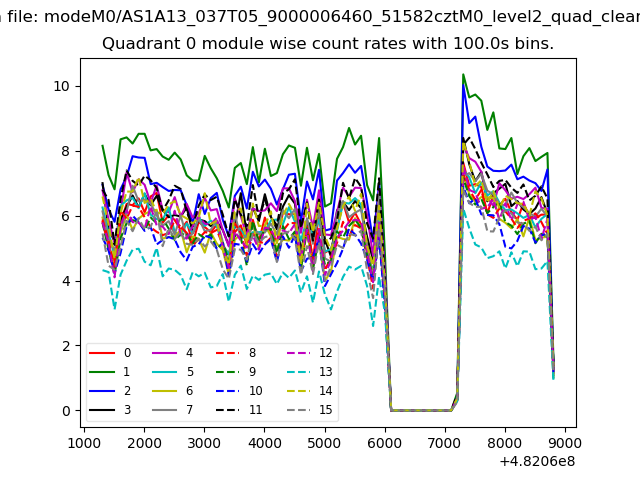 |
 |
| Module-wise count rates for Quadrant B Data is divided into 100 sec bins |
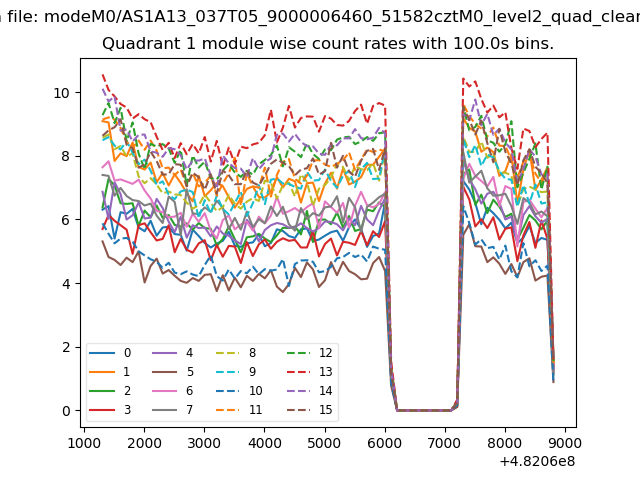 |
 |
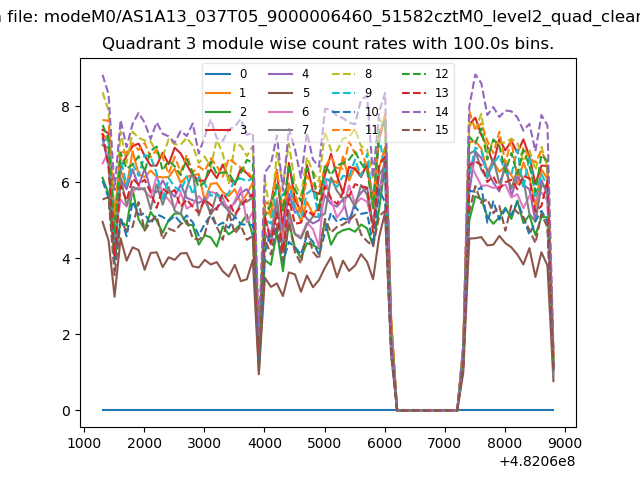
| Module-wise count rates for Quadrant C Data is divided into 100 sec bins |
 |
 |
| Module-wise count rates for Quadrant D Data is divided into 100 sec bins |
 |
 |
| Parameter | Plot |
|---|---|
| CZT HV Monitor | 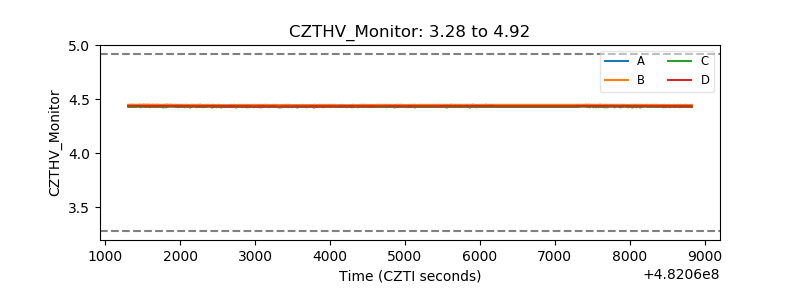 |
| D_VDD |  |
| Temperature 1 | 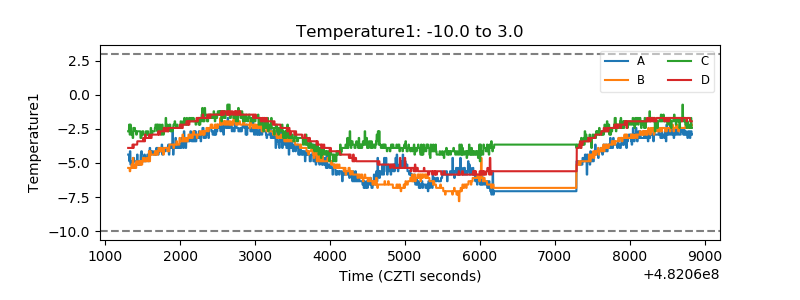 |
| Veto HV Monitor | 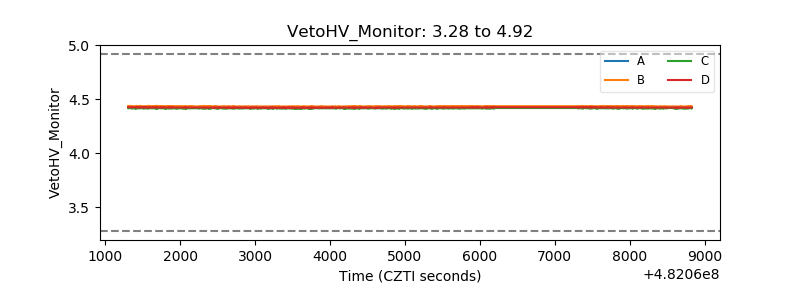 |
| Veto LLD | 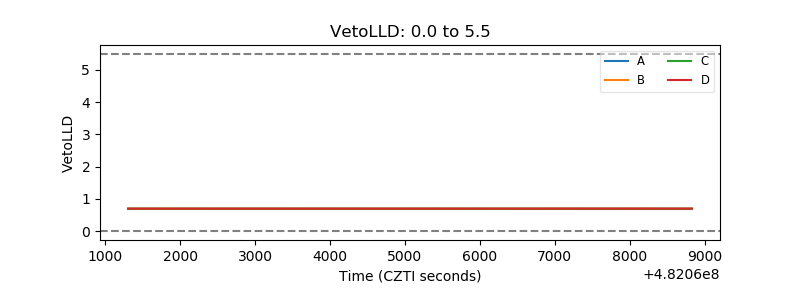 |
| Alpha Counter | 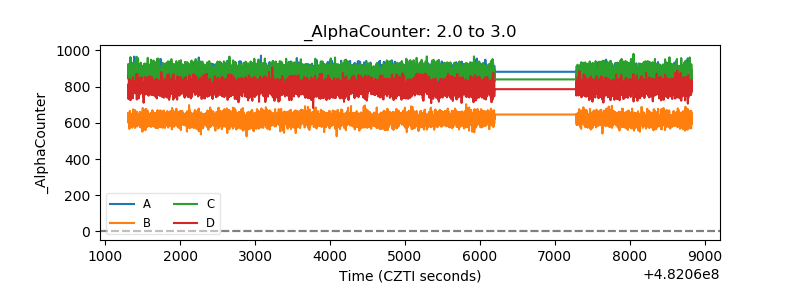 |
| _CPM_Rate | 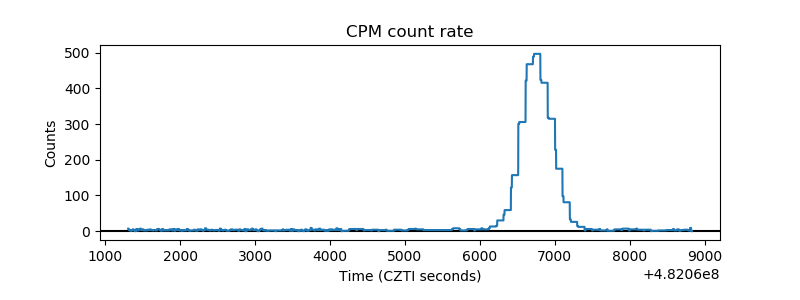 |
| CZT Counter | 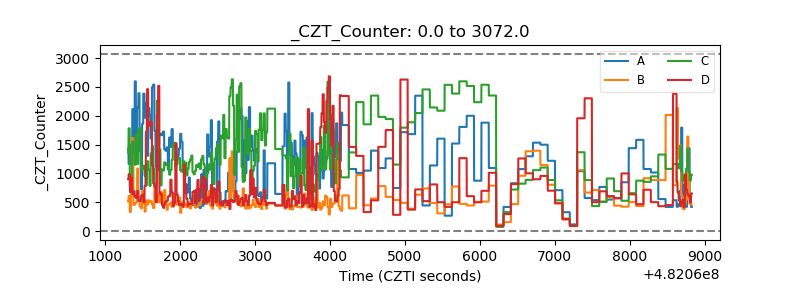 |
| +2.5 Volts monitor | 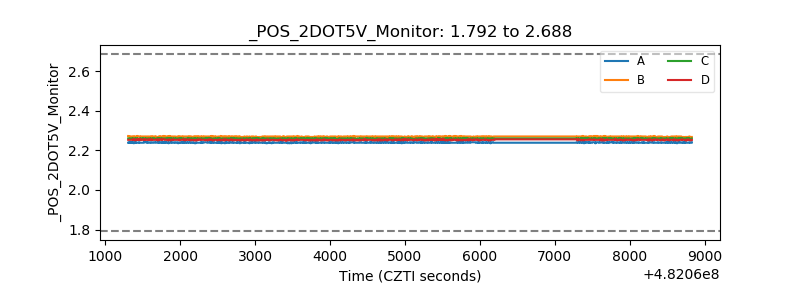 |
| +5 Volts monitor | 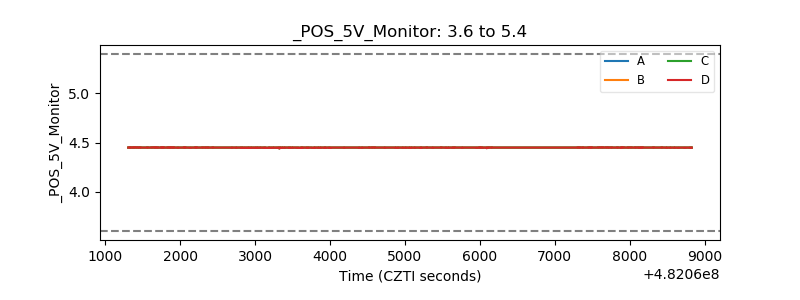 |
| _ROLL_ROT | 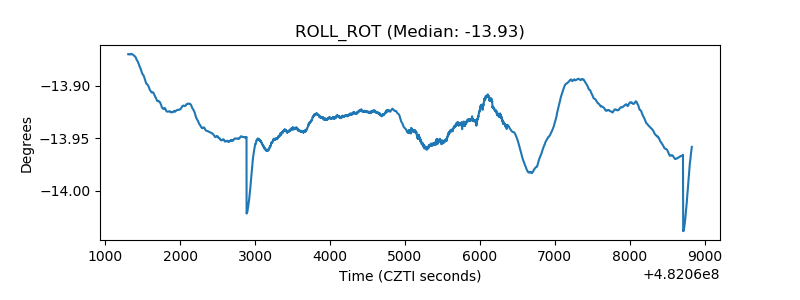 |
| _Roll_DEC | 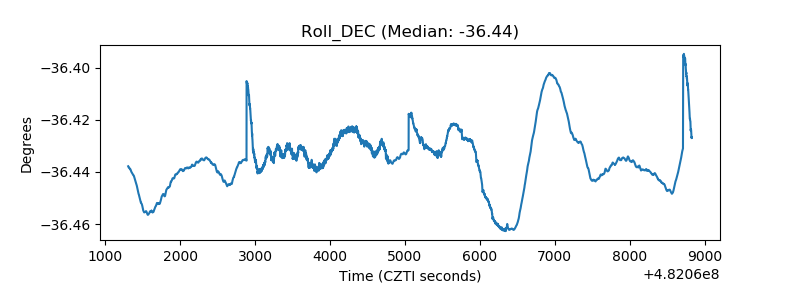 |
| _Roll_RA | 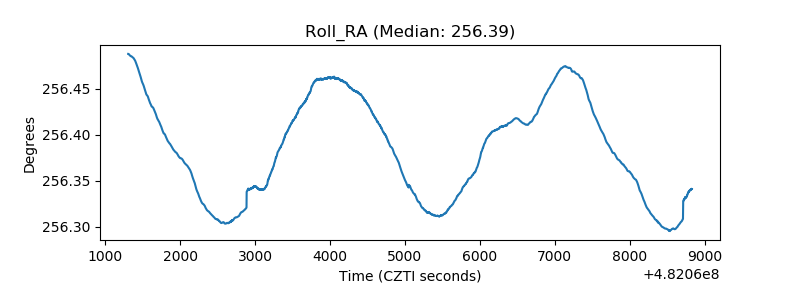 |
| Veto Counter | 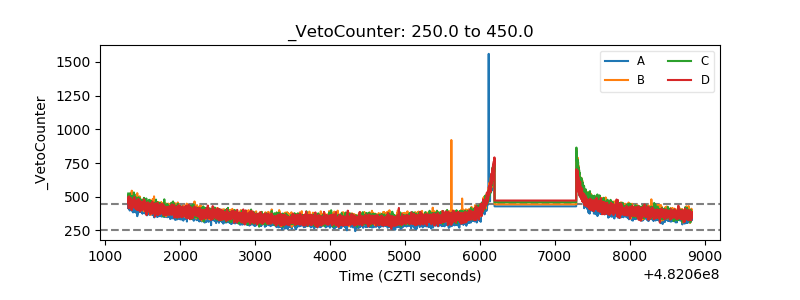 |