| Param | Original file | Final file |
|---|---|---|
| Filename | modeM0/AS1A13_037T05_9000006460_51583cztM0_level2.fits | modeM0/AS1A13_037T05_9000006460_51583cztM0_level2_quad_clean.evt |
| Size (bytes) | 675,676,800 | 78,814,080 |
| Size | 644.4 MB | 75.2 MB |
| Events in quadrant A | 5,834,299 | 648,854 |
| Events in quadrant B | 5,031,727 | 694,070 |
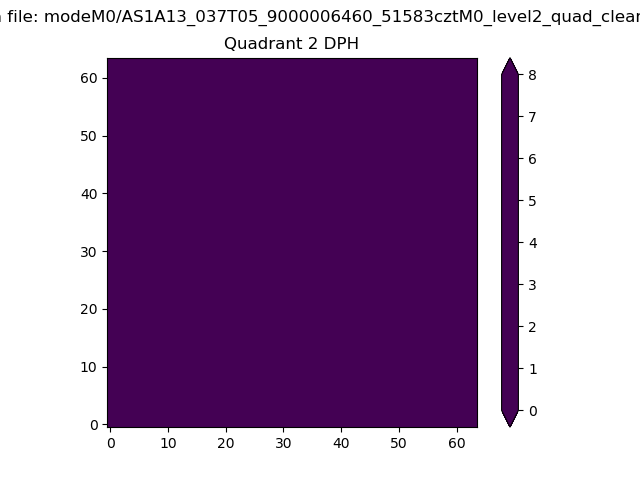
| Events in quadrant C | 8,078,600 | 2,741 |
| Events in quadrant D | 5,530,297 | 562,812 |
| Mode M9 | |||
|---|---|---|---|
| Quadrant | BADHDUFLAG | Total packets | Discarded packets |
| A | 0 | 16 | 0 |
| B | 0 | 17 | 0 |
| C | 0 | 17 | 0 |
| D | 0 | 17 | 0 |
| Mode M0 | |||
|---|---|---|---|
| Quadrant | BADHDUFLAG | Total packets | Discarded packets |
| A | 0 | 21957 | 2 |
| B | 0 | 19521 | 2 |
| C | 0 | 28952 | 2 |
| D | 0 | 21048 | 2 |
| Mode SS | |||
|---|---|---|---|
| Quadrant | BADHDUFLAG | Total packets | Discarded packets |
| A | 0 | 140 | 0 |
| B | 0 | 140 | 0 |
| C | 0 | 140 | 0 |
| D | 0 | 140 | 0 |
| Quadrant | Total seconds | Saturated seconds | Saturation percentage |
|---|---|---|---|
| A | 6856 | 406 | 5.921820% |
| B | 6856 | 545 | 7.949242% |
| C | 6856 | 6843 | 99.810385% |
| D | 6856 | 682 | 9.947491% |
Noise dominated data is calculated using 1-second bins in cleaned event files. If a bin has >2000 counts, and if more than 50% of those come from <1% of pixels, then it is considered to be noise-dominated and hence unusable.
| Quadrant | # 1 sec bins | Bins with >0 counts | Bins with >2000 counts | High rate bins dominated by noise | Noise dominated (total time) | Noise dominated (detector-on time) | Marked lightcurve |
|---|---|---|---|---|---|---|---|
| A | 7885 | 6856 | 136 | 136 | 1.72% | 1.98% | 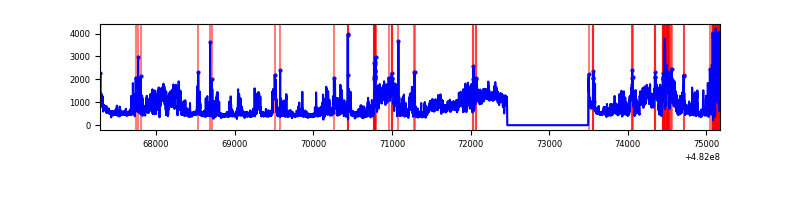 |
| B | 7886 | 6856 | 262 | 262 | 3.32% | 3.82% | 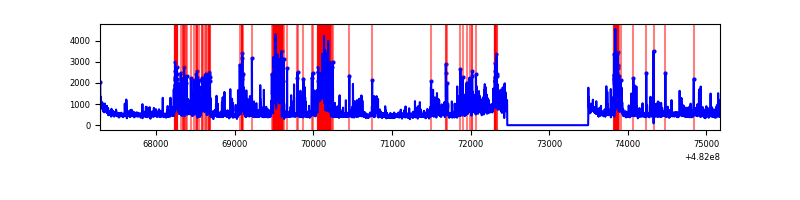 |
| C | 7885 | 6855 | 329 | 329 | 4.17% | 4.80% | 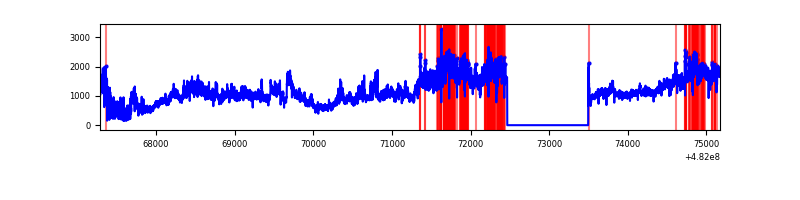 |
| D | 7886 | 6857 | 455 | 455 | 5.77% | 6.64% | 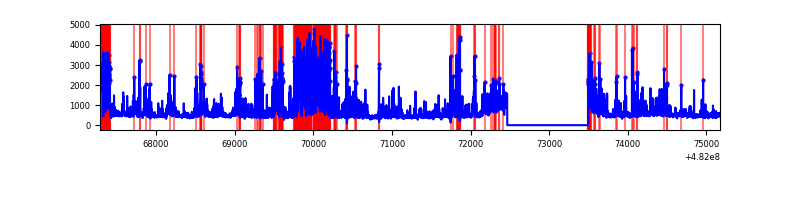 |
Top three noisy pixels from each quadrant. If the there are fewer than three noisy pixels in the level2.evt file, extra rows are filled as -1
| Pixel properties | Quadrant properties | ||||||
|---|---|---|---|---|---|---|---|
| Quadrant | DetID | PixID | Counts | Sigma | Mean | Median | Sigma |
| A | 12 | 3 | 1706906 | 8950.61 | 773 | 753 | 190.6 |
| A | 12 | 250 | 319019 | 1669.65 | 773 | 753 | 190.6 |
| A | 12 | 194 | 206809 | 1080.99 | 773 | 753 | 190.6 |
| B | 5 | 185 | 688077 | 4213.82 | 759 | 733 | 163.1 |
| B | 10 | 44 | 481207 | 2945.59 | 759 | 733 | 163.1 |
| B | 10 | 246 | 221540 | 1353.68 | 759 | 733 | 163.1 |
| C | 15 | 198 | 1679207 | 105195.48 | 51 | 50 | 16.0 |
| C | 15 | 246 | 1290672 | 80854.62 | 51 | 50 | 16.0 |
| C | 15 | 215 | 1232526 | 77211.9 | 51 | 50 | 16.0 |
| D | 8 | 176 | 1168320 | 5714.89 | 726 | 700 | 204.3 |
| D | 12 | 6 | 737640 | 3606.93 | 726 | 700 | 204.3 |
| D | 3 | 12 | 333104 | 1626.94 | 726 | 700 | 204.3 |
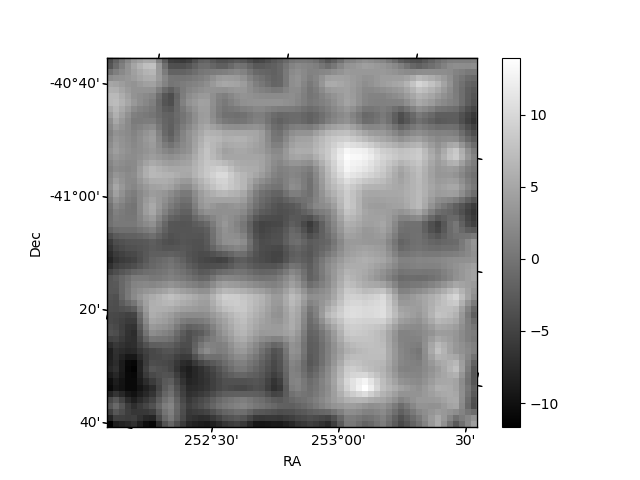
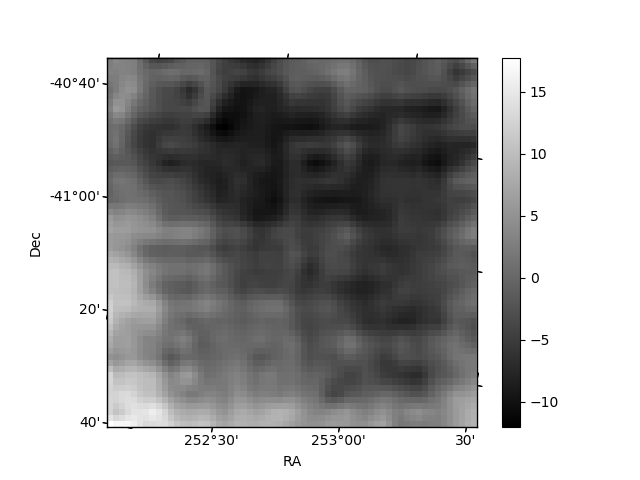
Histogram calculated using DETX and DETY for each event in the final _common_clean file
| Quadrant A | 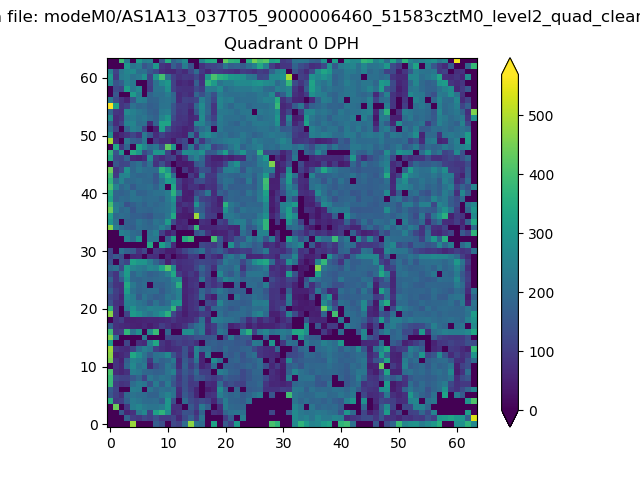 |
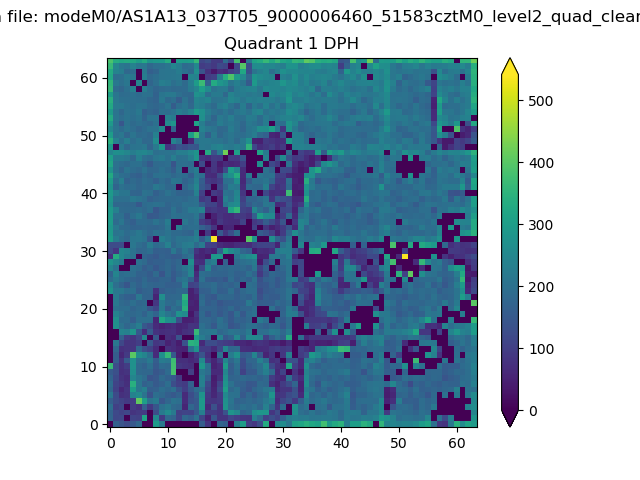 |
Quadrant B |
|---|---|---|---|
| Quadrant D | 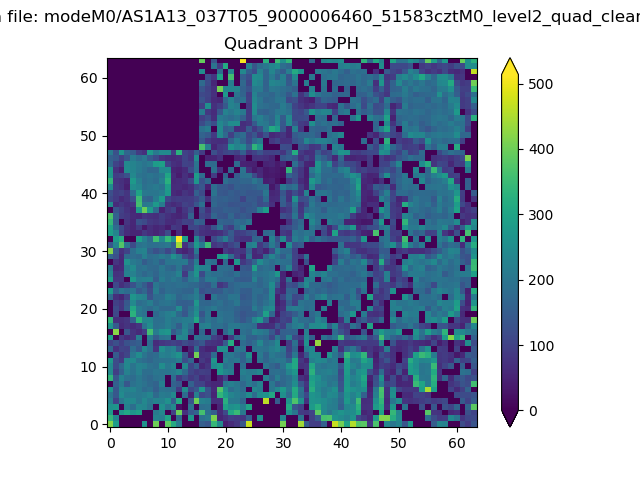 |
 |
Quadrant C |
| Plot type | Count rate plots | Images |
|---|---|---|
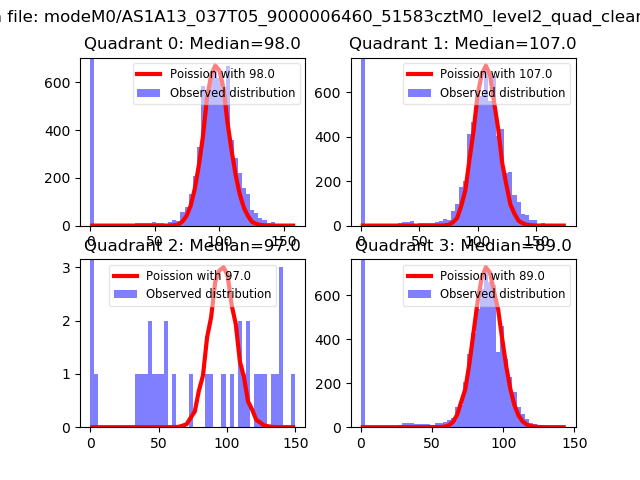
| Comparison with Poisson distribution Blue bars denote a histogram of data divided into 1 sec bins. Red curve is a Poisson curve with rate = median count rate of data. |
 |
 |
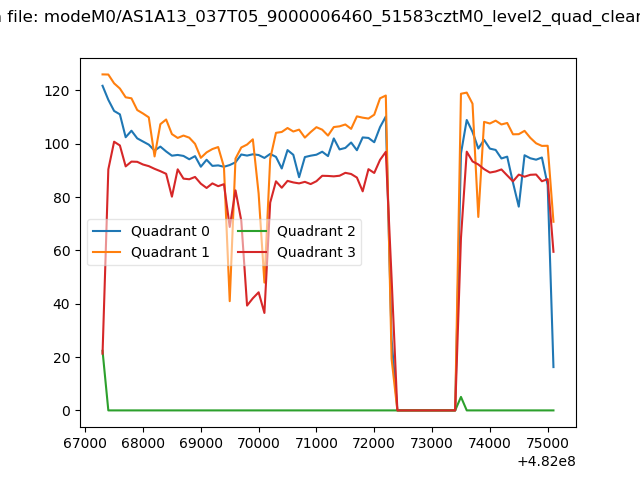
| Quadrant-wise count rates Data is divided into 100 sec bins |
 |
|
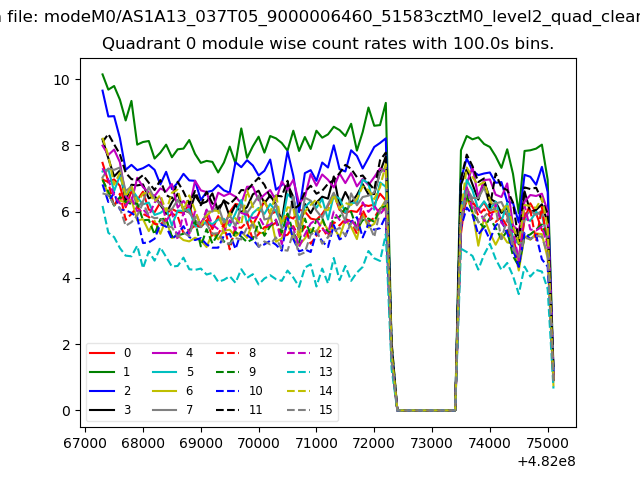
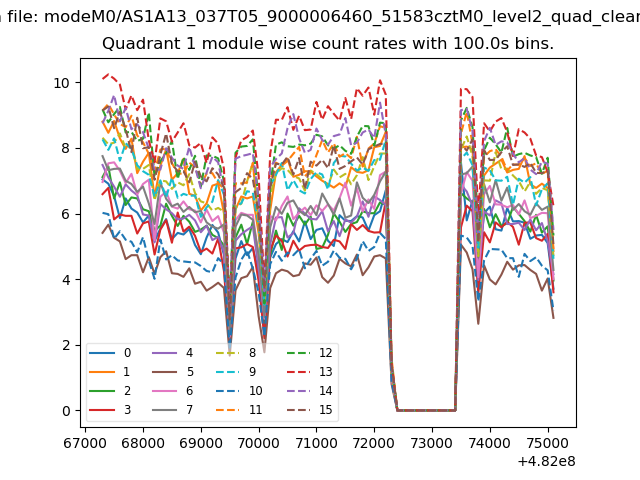
| Module-wise count rates for Quadrant A Data is divided into 100 sec bins |
 |
 |
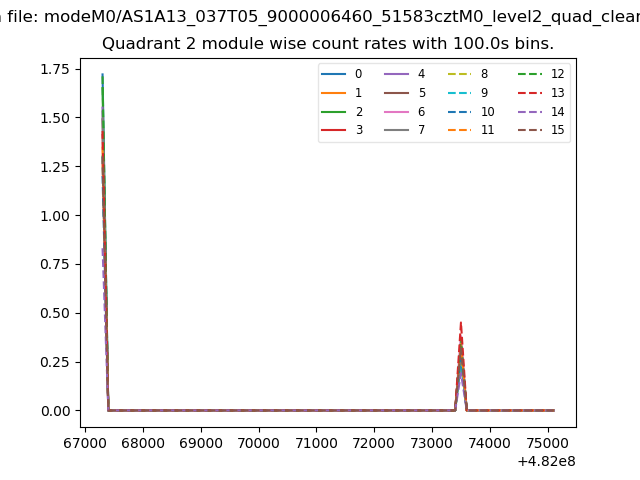
| Module-wise count rates for Quadrant B Data is divided into 100 sec bins |
 |
 |
| Module-wise count rates for Quadrant C Data is divided into 100 sec bins |
 |
 |
| Module-wise count rates for Quadrant D Data is divided into 100 sec bins |
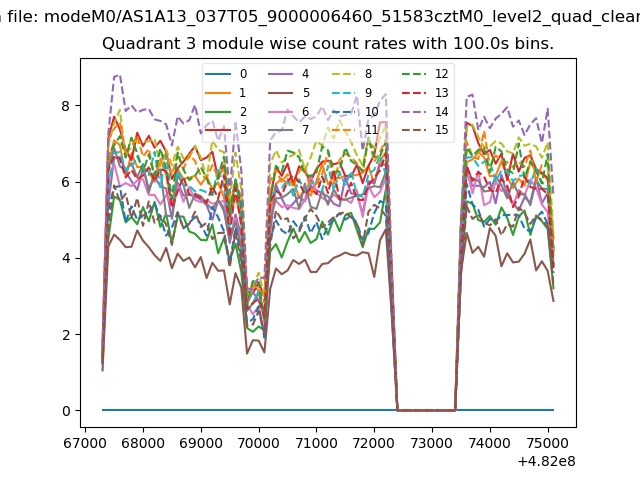 |
 |
| Parameter | Plot |
|---|---|
| CZT HV Monitor | 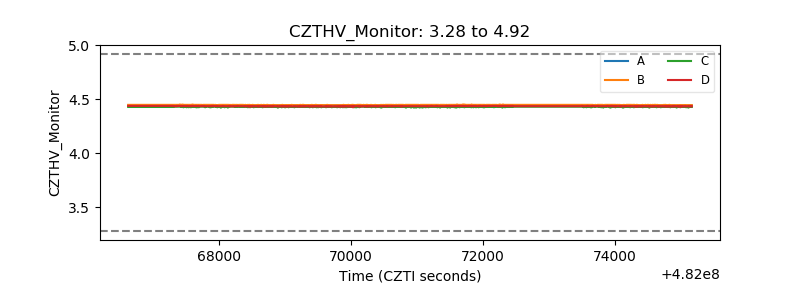 |
| D_VDD | 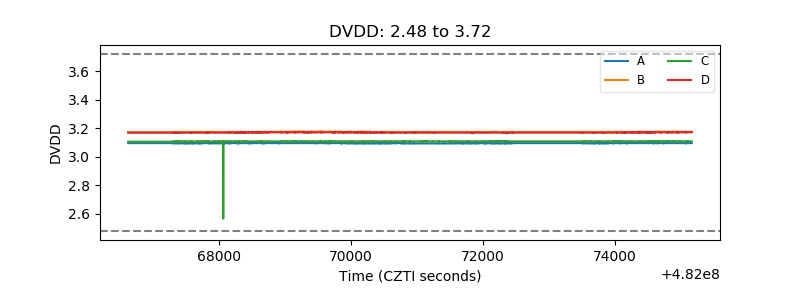 |
| Temperature 1 | 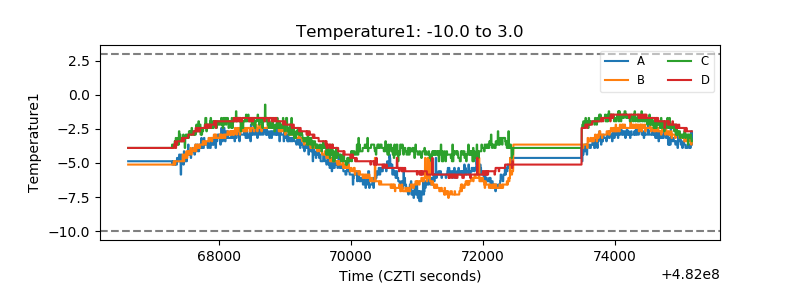 |
| Veto HV Monitor | 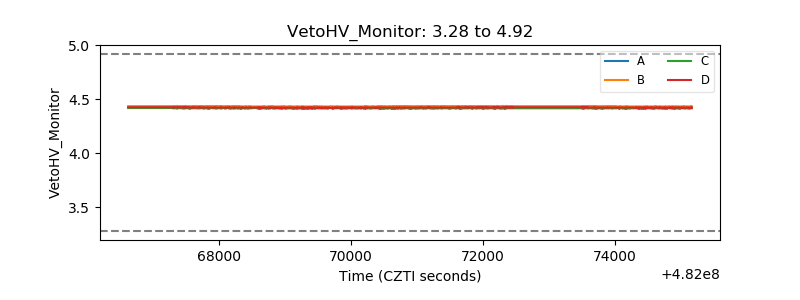 |
| Veto LLD | 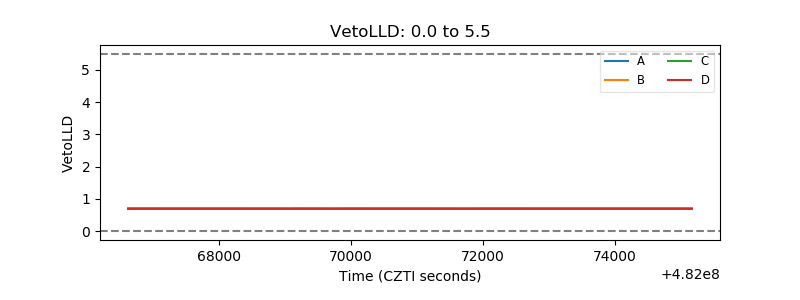 |
| Alpha Counter | 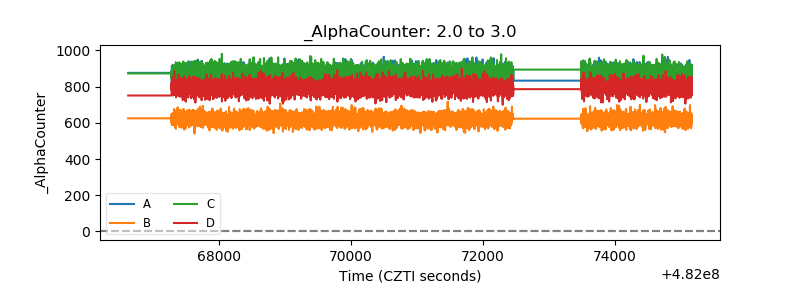 |
| _CPM_Rate | 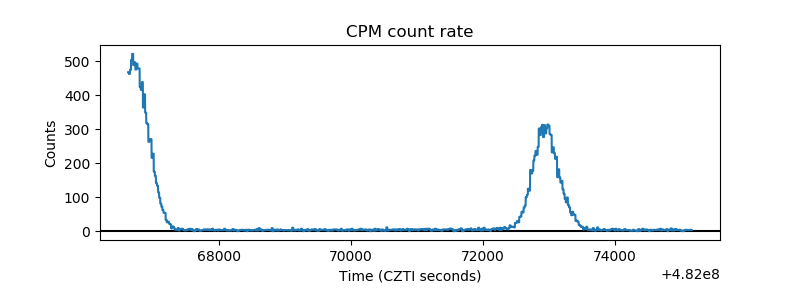 |
| CZT Counter | 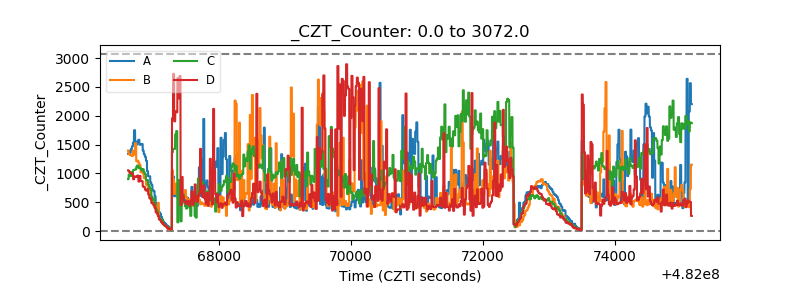 |
| +2.5 Volts monitor | 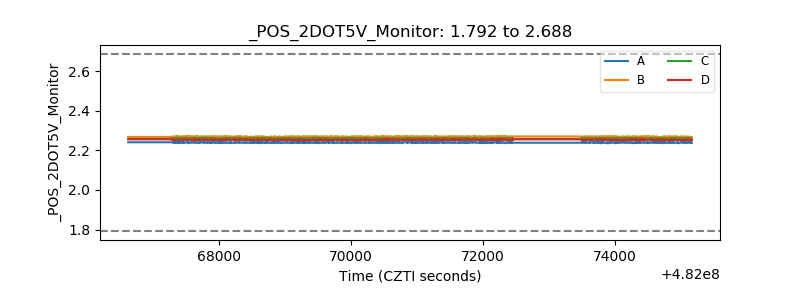 |
| +5 Volts monitor | 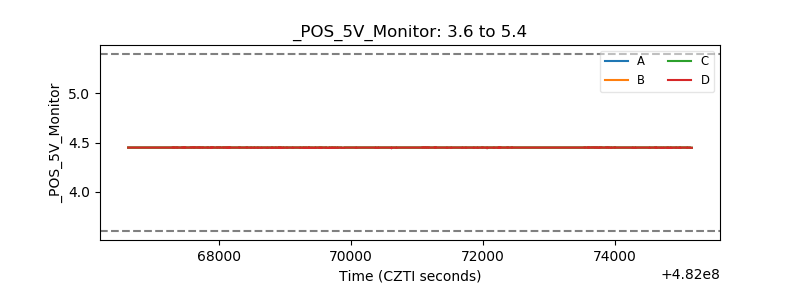 |
| _ROLL_ROT | 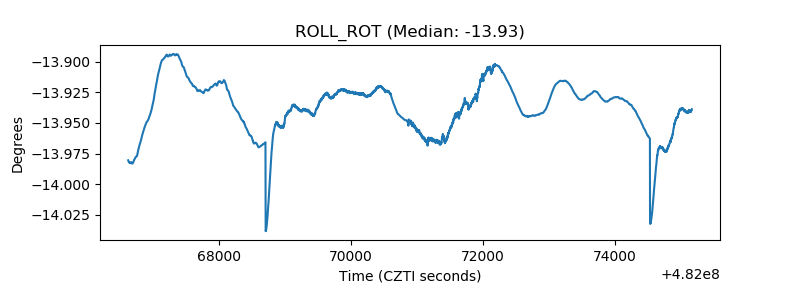 |
| _Roll_DEC | 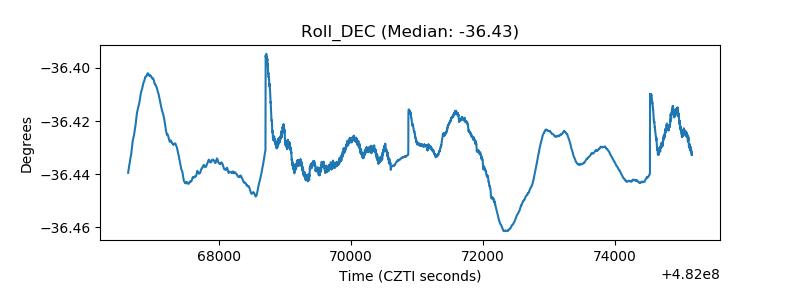 |
| _Roll_RA | 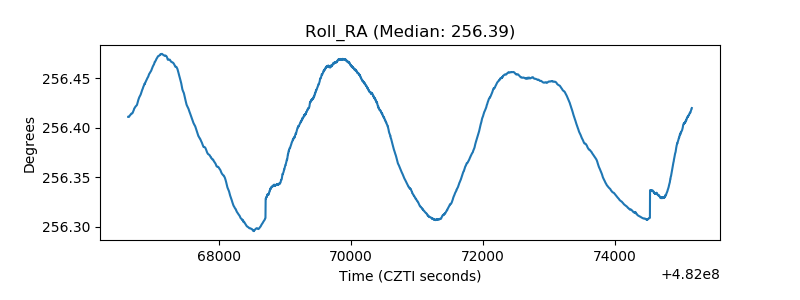 |
| Veto Counter | 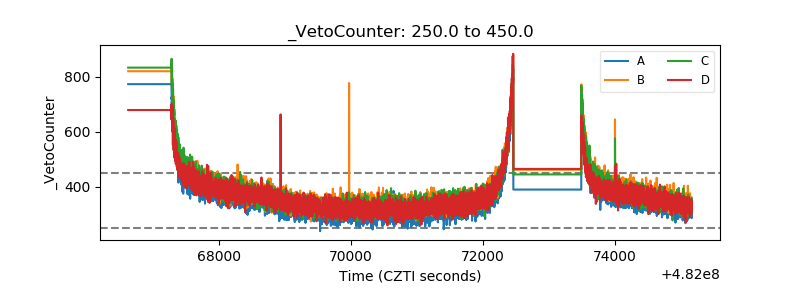 |