| Param | Original file | Final file |
|---|---|---|
| Filename | modeM0/AS1A13_037T05_9000006460_51584cztM0_level2.fits | modeM0/AS1A13_037T05_9000006460_51584cztM0_level2_quad_clean.evt |
| Size (bytes) | 648,187,200 | 91,376,640 |
| Size | 618.2 MB | 87.1 MB |
| Events in quadrant A | 5,897,338 | 627,531 |
| Events in quadrant B | 4,713,147 | 693,717 |
| Events in quadrant C | 7,103,341 | 395,671 |
| Events in quadrant D | 5,741,893 | 567,471 |
| Mode M9 | |||
|---|---|---|---|
| Quadrant | BADHDUFLAG | Total packets | Discarded packets |
| A | 0 | 12 | 0 |
| B | 0 | 13 | 0 |
| C | 0 | 13 | 0 |
| D | 0 | 13 | 0 |
| Mode M0 | |||
|---|---|---|---|
| Quadrant | BADHDUFLAG | Total packets | Discarded packets |
| A | 0 | 22243 | 3 |
| B | 0 | 18622 | 2 |
| C | 0 | 25979 | 2 |
| D | 0 | 21777 | 2 |
| Mode SS | |||
|---|---|---|---|
| Quadrant | BADHDUFLAG | Total packets | Discarded packets |
| A | 0 | 140 | 0 |
| B | 0 | 140 | 0 |
| C | 0 | 140 | 0 |
| D | 0 | 140 | 0 |
| Quadrant | Total seconds | Saturated seconds | Saturation percentage |
|---|---|---|---|
| A | 6926 | 646 | 9.327173% |
| B | 6926 | 428 | 6.179613% |
| C | 6926 | 2818 | 40.687265% |
| D | 6926 | 610 | 8.807392% |
Noise dominated data is calculated using 1-second bins in cleaned event files. If a bin has >2000 counts, and if more than 50% of those come from <1% of pixels, then it is considered to be noise-dominated and hence unusable.
| Quadrant | # 1 sec bins | Bins with >0 counts | Bins with >2000 counts | High rate bins dominated by noise | Noise dominated (total time) | Noise dominated (detector-on time) | Marked lightcurve |
|---|---|---|---|---|---|---|---|
| A | 7816 | 6927 | 379 | 379 | 4.85% | 5.47% | 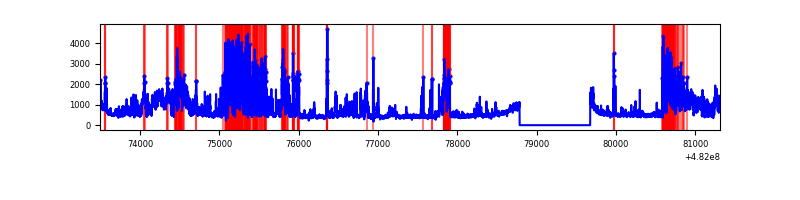 |
| B | 7816 | 6927 | 197 | 197 | 2.52% | 2.84% | 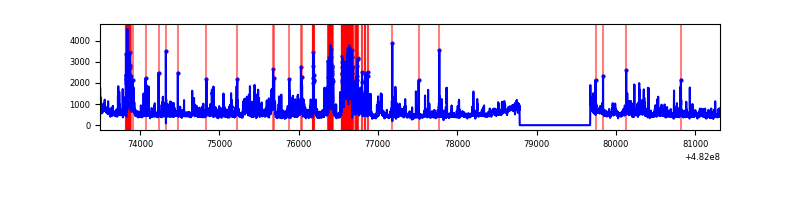 |
| C | 7816 | 6927 | 550 | 550 | 7.04% | 7.94% | 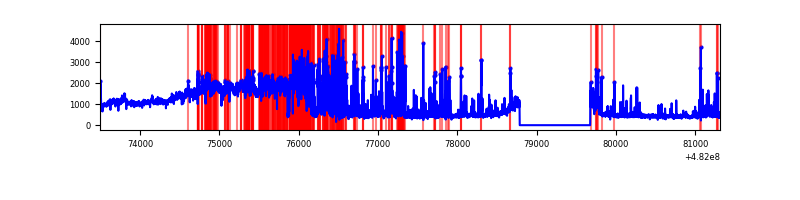 |
| D | 7816 | 6927 | 455 | 455 | 5.82% | 6.57% | 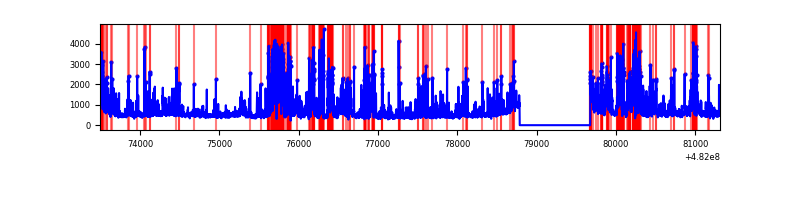 |
Top three noisy pixels from each quadrant. If the there are fewer than three noisy pixels in the level2.evt file, extra rows are filled as -1
| Pixel properties | Quadrant properties | ||||||
|---|---|---|---|---|---|---|---|
| Quadrant | DetID | PixID | Counts | Sigma | Mean | Median | Sigma |
| A | 8 | 43 | 939870 | 5065.55 | 761 | 743 | 185.4 |
| A | 12 | 3 | 840682 | 4530.54 | 761 | 743 | 185.4 |
| A | 12 | 250 | 442615 | 2383.41 | 761 | 743 | 185.4 |
| B | 10 | 44 | 882723 | 5389.92 | 765 | 738 | 163.6 |
| B | 1 | 207 | 178042 | 1083.53 | 765 | 738 | 163.6 |
| B | 0 | 171 | 117722 | 714.9 | 765 | 738 | 163.6 |
| C | 15 | 198 | 3080434 | 22559.61 | 501 | 498 | 136.5 |
| C | 15 | 246 | 346576 | 2534.92 | 501 | 498 | 136.5 |
| C | 15 | 215 | 341981 | 2501.26 | 501 | 498 | 136.5 |
| D | 8 | 176 | 1277287 | 6373.72 | 728 | 703 | 200.3 |
| D | 12 | 6 | 460949 | 2297.91 | 728 | 703 | 200.3 |
| D | 5 | 113 | 422069 | 2103.79 | 728 | 703 | 200.3 |
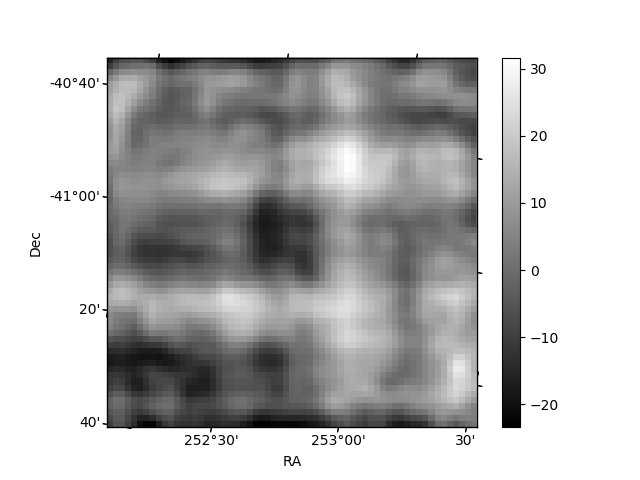
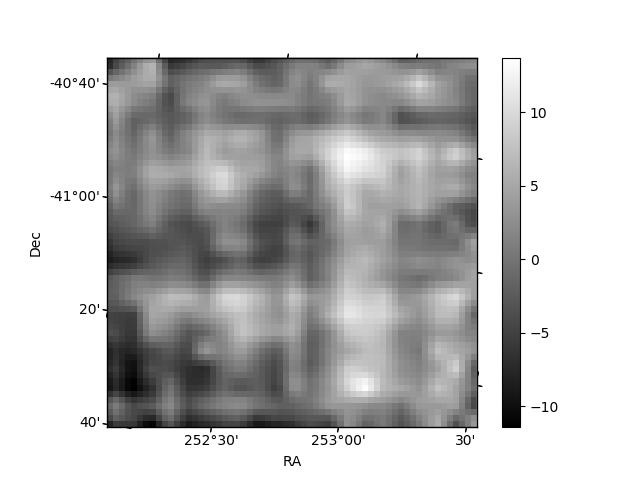
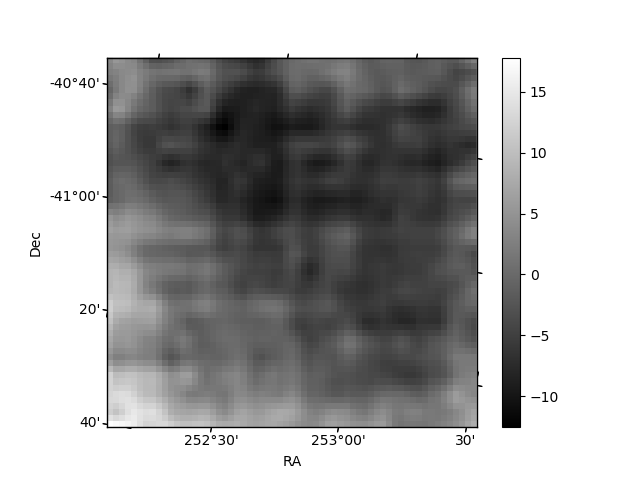
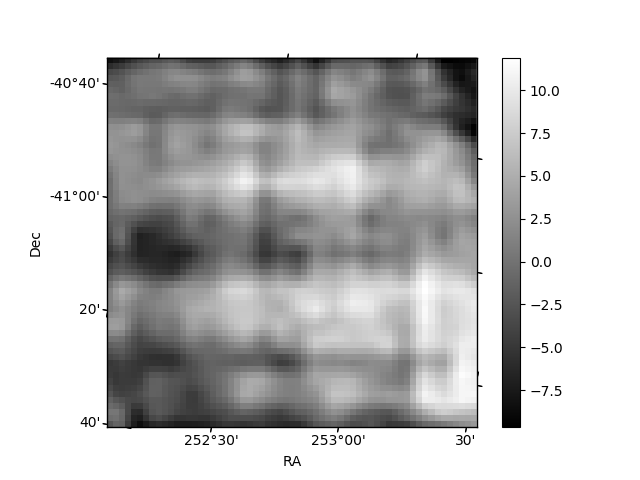
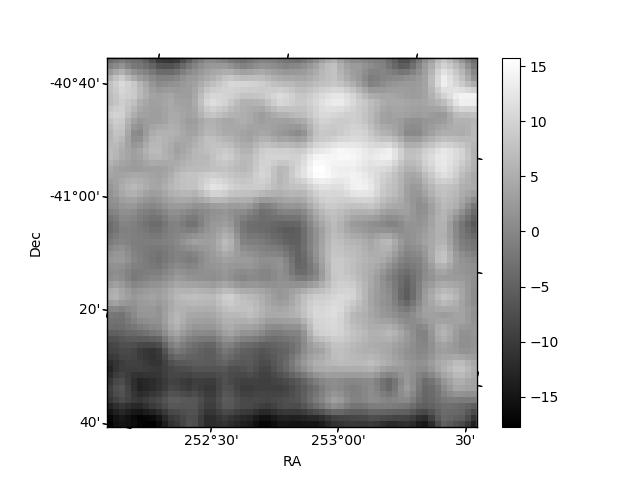
Histogram calculated using DETX and DETY for each event in the final _common_clean file
| Quadrant A | 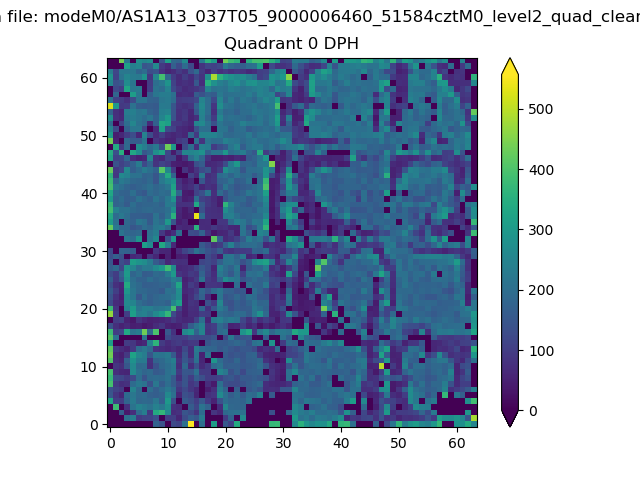 |
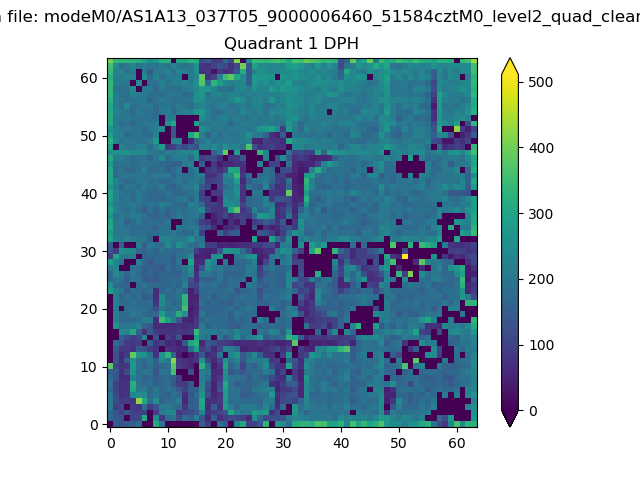 |
Quadrant B |
|---|---|---|---|
| Quadrant D | 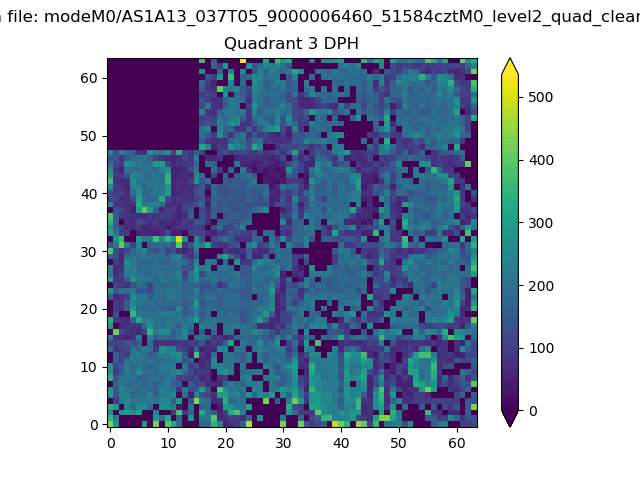 |
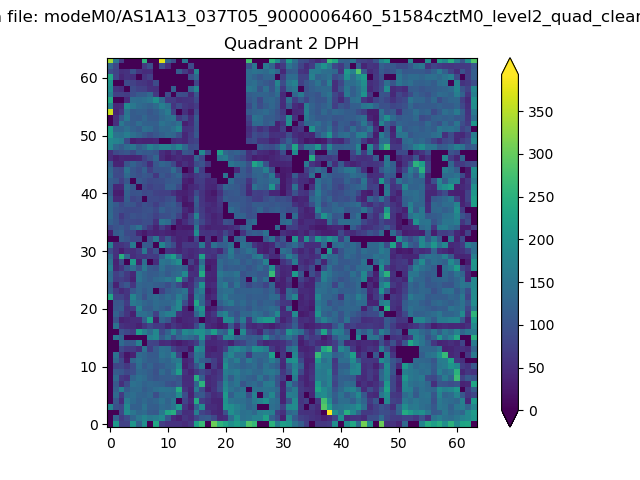 |
Quadrant C |
| Plot type | Count rate plots | Images |
|---|---|---|
| Comparison with Poisson distribution Blue bars denote a histogram of data divided into 1 sec bins. Red curve is a Poisson curve with rate = median count rate of data. |
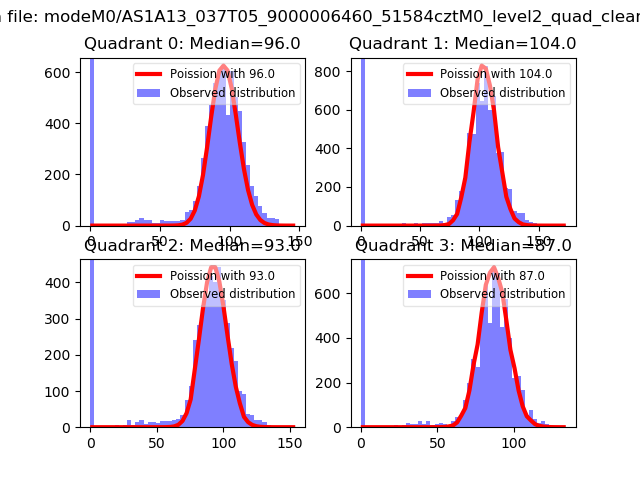 |
 |
| Quadrant-wise count rates Data is divided into 100 sec bins |
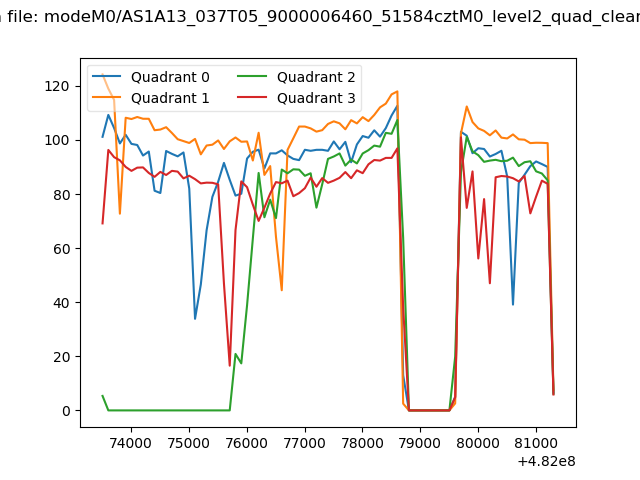 |
|
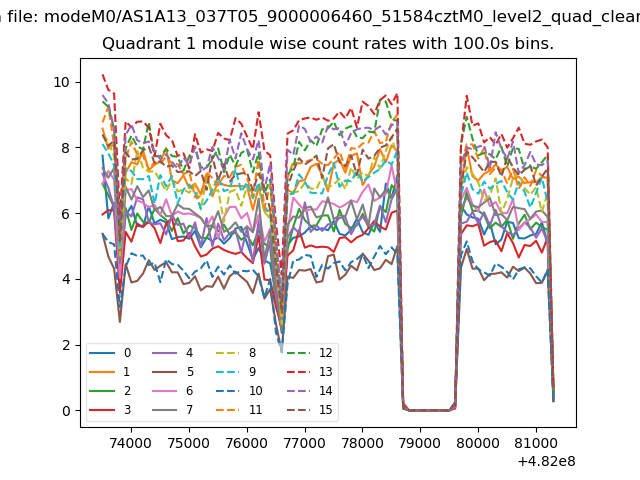
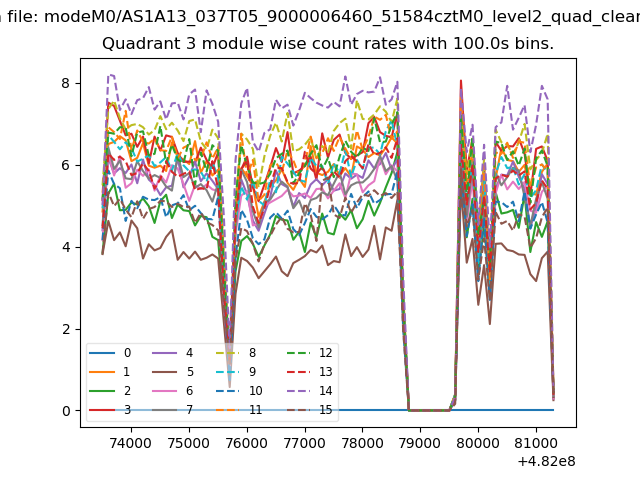
| Module-wise count rates for Quadrant A Data is divided into 100 sec bins |
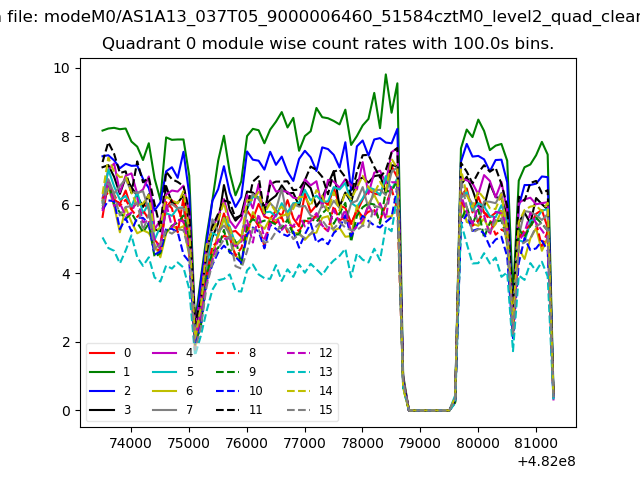 |
 |
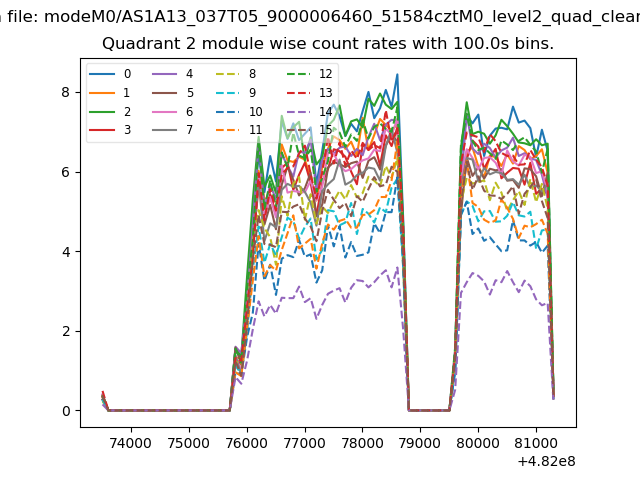
| Module-wise count rates for Quadrant B Data is divided into 100 sec bins |
 |
 |
| Module-wise count rates for Quadrant C Data is divided into 100 sec bins |
 |
 |
| Module-wise count rates for Quadrant D Data is divided into 100 sec bins |
 |
 |
| Parameter | Plot |
|---|---|
| CZT HV Monitor | 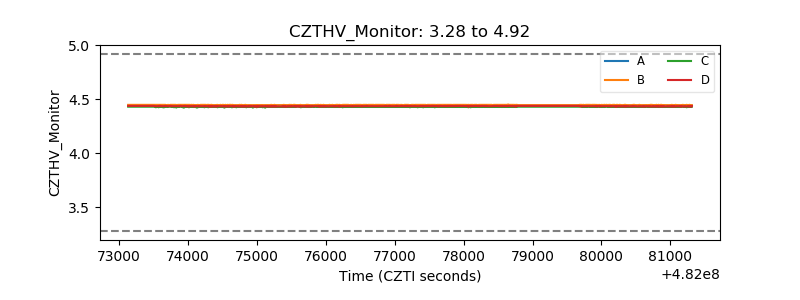 |
| D_VDD | 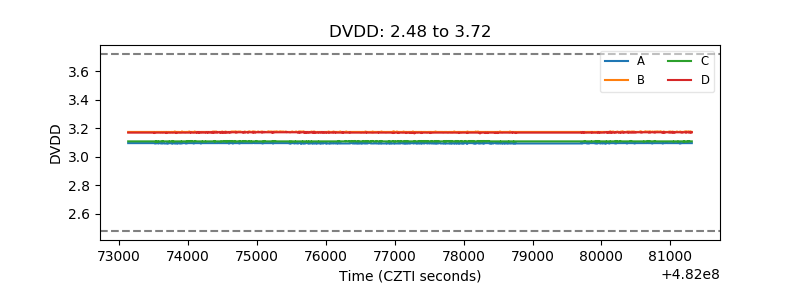 |
| Temperature 1 | 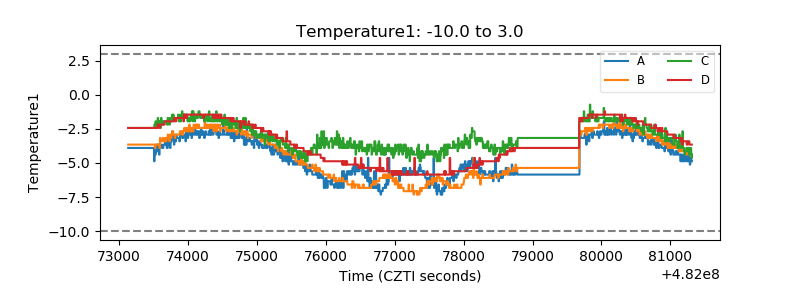 |
| Veto HV Monitor |  |
| Veto LLD | 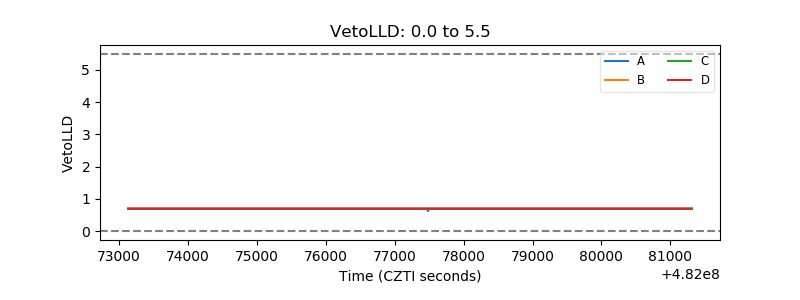 |
| Alpha Counter | 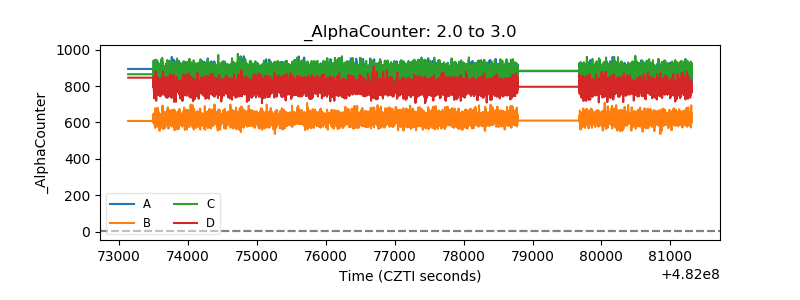 |
| _CPM_Rate | 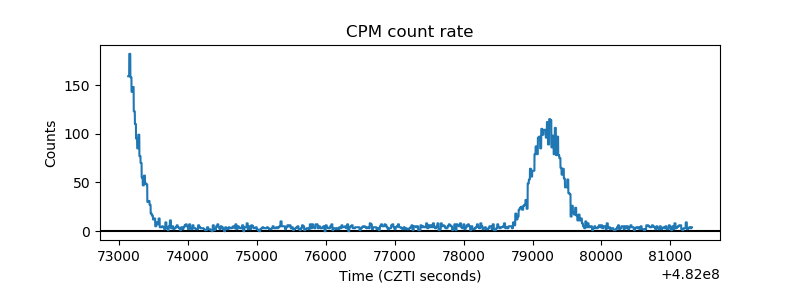 |
| CZT Counter | 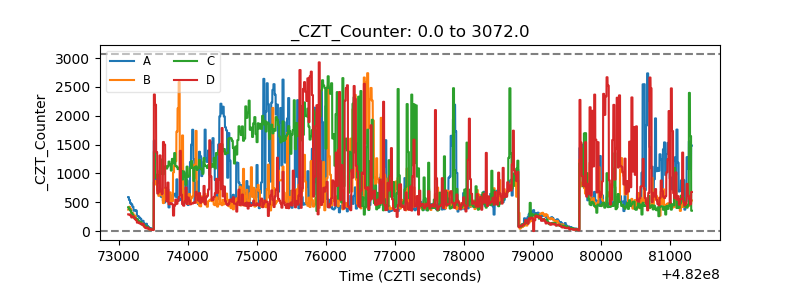 |
| +2.5 Volts monitor | 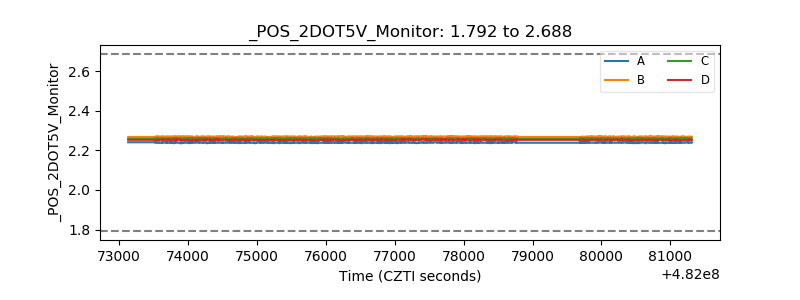 |
| +5 Volts monitor | 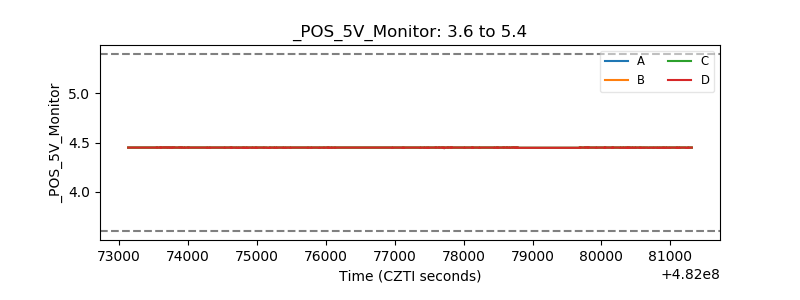 |
| _ROLL_ROT | 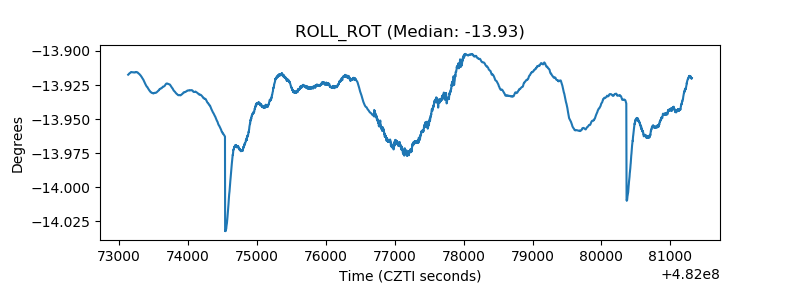 |
| _Roll_DEC | 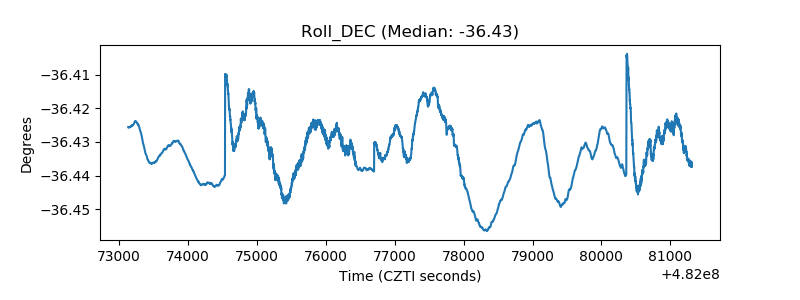 |
| _Roll_RA | 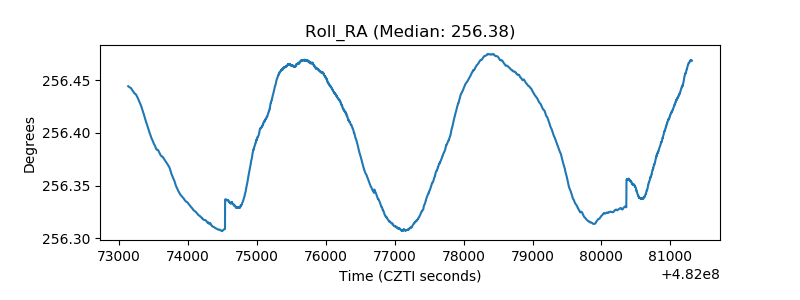 |
| Veto Counter | 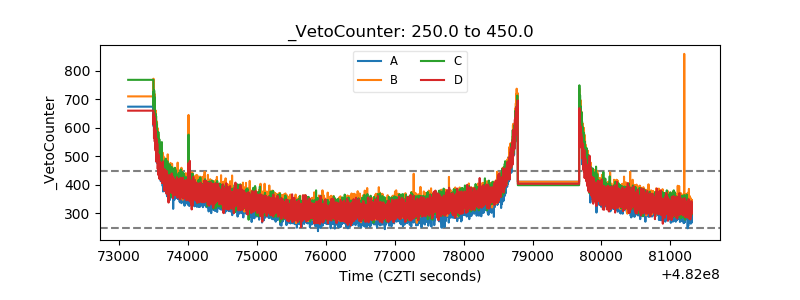 |