| Param | Original file | Final file |
|---|---|---|
| Filename | modeM0/AS1A13_037T05_9000006460_51586cztM0_level2.fits | modeM0/AS1A13_037T05_9000006460_51586cztM0_level2_quad_clean.evt |
| Size (bytes) | 789,416,640 | 81,207,360 |
| Size | 752.8 MB | 77.4 MB |
| Events in quadrant A | 6,777,337 | 597,719 |
| Events in quadrant B | 4,833,621 | 725,019 |
| Events in quadrant C | 9,959,699 | 99,077 |
| Events in quadrant D | 7,095,121 | 539,806 |
| Mode M0 | |||
|---|---|---|---|
| Quadrant | BADHDUFLAG | Total packets | Discarded packets |
| A | 0 | 25105 | 0 |
| B | 0 | 19247 | 0 |
| C | 0 | 34632 | 0 |
| D | 0 | 26026 | 1 |
| Mode SS | |||
|---|---|---|---|
| Quadrant | BADHDUFLAG | Total packets | Discarded packets |
| A | 0 | 144 | 0 |
| B | 0 | 144 | 0 |
| C | 0 | 144 | 0 |
| D | 0 | 144 | 0 |
| Quadrant | Total seconds | Saturated seconds | Saturation percentage |
|---|---|---|---|
| A | 7133 | 1080 | 15.140894% |
| B | 7134 | 363 | 5.088310% |
| C | 7134 | 6090 | 85.365854% |
| D | 7133 | 1046 | 14.664237% |
Noise dominated data is calculated using 1-second bins in cleaned event files. If a bin has >2000 counts, and if more than 50% of those come from <1% of pixels, then it is considered to be noise-dominated and hence unusable.
| Quadrant | # 1 sec bins | Bins with >0 counts | Bins with >2000 counts | High rate bins dominated by noise | Noise dominated (total time) | Noise dominated (detector-on time) | Marked lightcurve |
|---|---|---|---|---|---|---|---|
| A | 7133 | 7133 | 530 | 530 | 7.43% | 7.43% | 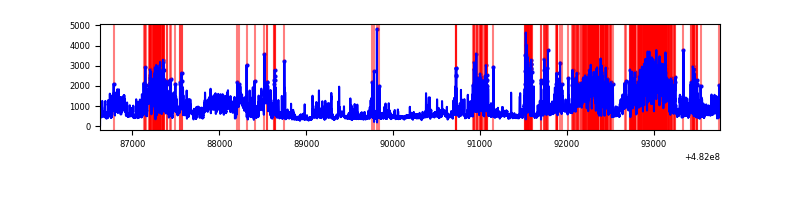 |
| B | 7134 | 7134 | 242 | 242 | 3.39% | 3.39% | 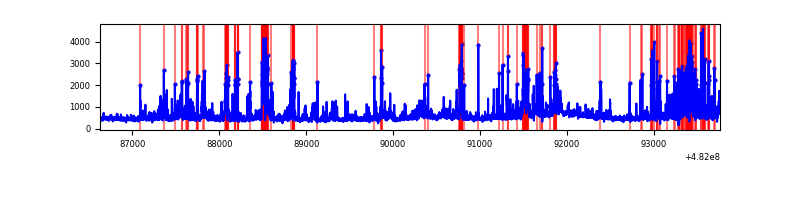 |
| C | 7134 | 7134 | 348 | 348 | 4.88% | 4.88% | 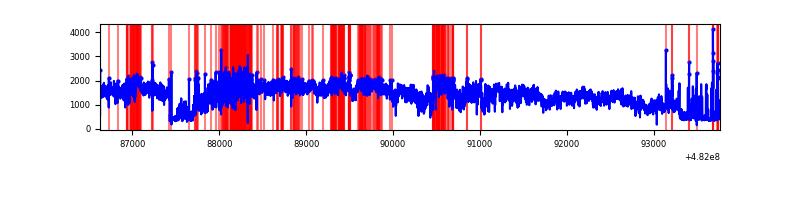 |
| D | 7133 | 7133 | 803 | 803 | 11.26% | 11.26% | 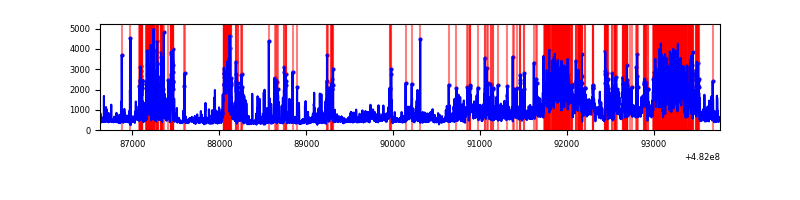 |
Top three noisy pixels from each quadrant. If the there are fewer than three noisy pixels in the level2.evt file, extra rows are filled as -1
| Pixel properties | Quadrant properties | ||||||
|---|---|---|---|---|---|---|---|
| Quadrant | DetID | PixID | Counts | Sigma | Mean | Median | Sigma |
| A | 12 | 250 | 2336523 | 12828.81 | 733 | 715 | 182.1 |
| A | 12 | 3 | 510572 | 2800.26 | 733 | 715 | 182.1 |
| A | 8 | 249 | 496526 | 2723.11 | 733 | 715 | 182.1 |
| B | 10 | 44 | 738500 | 4496.95 | 762 | 738 | 164.1 |
| B | 1 | 223 | 278208 | 1691.29 | 762 | 738 | 164.1 |
| B | 7 | 252 | 148708 | 901.94 | 762 | 738 | 164.1 |
| C | 15 | 198 | 8871371 | 177822.53 | 173 | 172 | 49.9 |
| C | 15 | 182 | 107246 | 2146.29 | 173 | 172 | 49.9 |
| C | 13 | 3 | 89602 | 1792.62 | 173 | 172 | 49.9 |
| D | 8 | 176 | 964169 | 4894.96 | 700 | 676 | 196.8 |
| D | 12 | 6 | 717009 | 3639.28 | 700 | 676 | 196.8 |
| D | 6 | 228 | 695112 | 3528.03 | 700 | 676 | 196.8 |
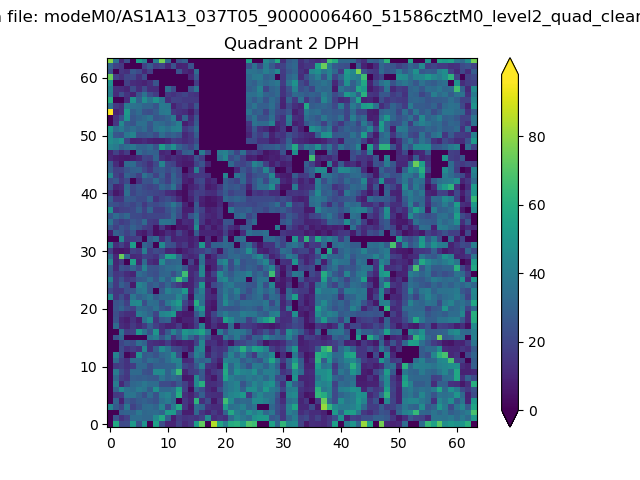
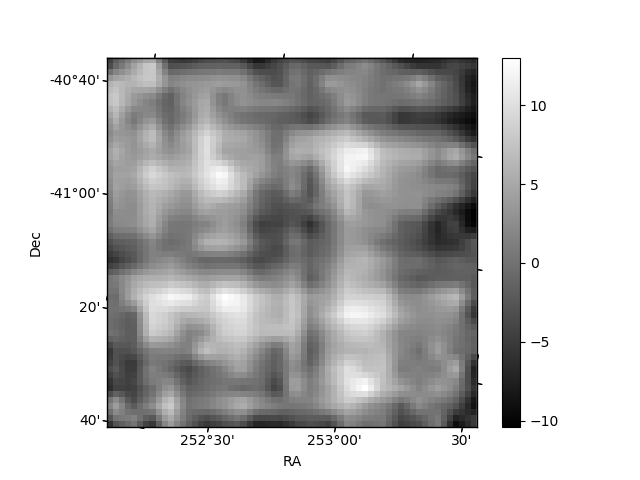
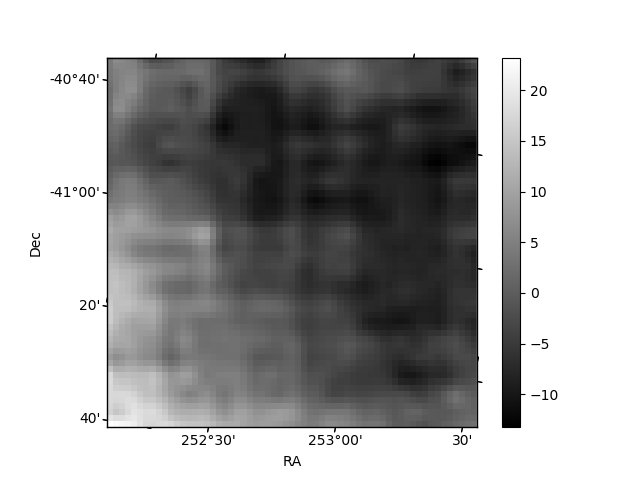
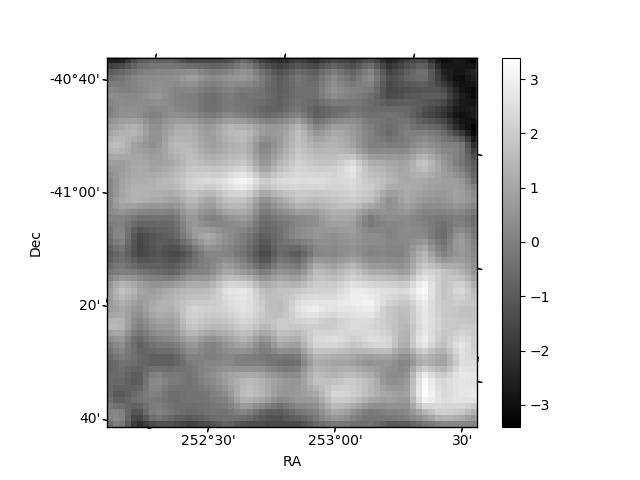
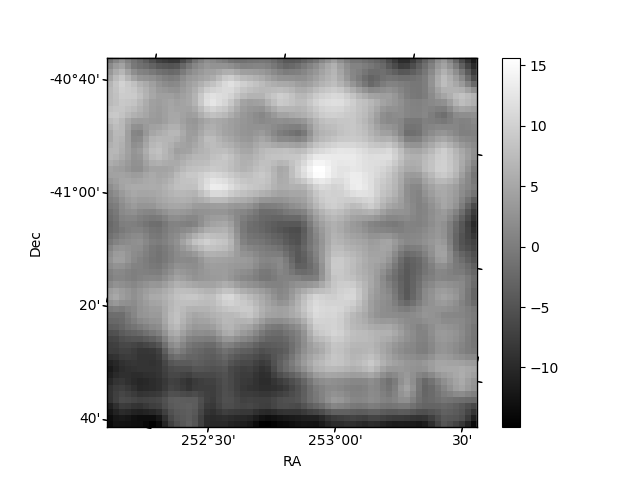
Histogram calculated using DETX and DETY for each event in the final _common_clean file
| Quadrant A |  |
 |
Quadrant B |
|---|---|---|---|
| Quadrant D | 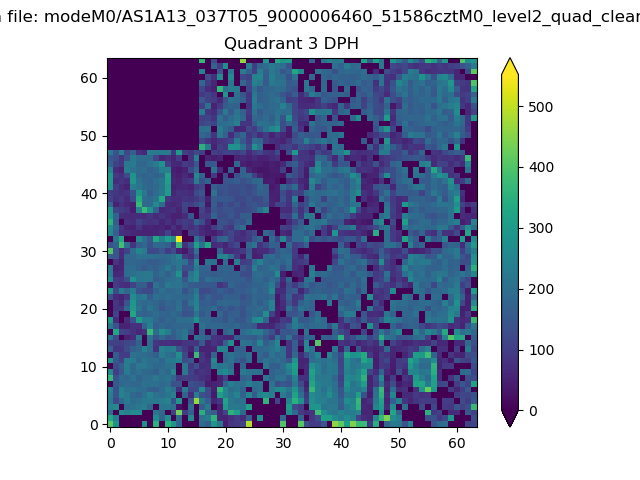 |
 |
Quadrant C |
| Plot type | Count rate plots | Images |
|---|---|---|
| Comparison with Poisson distribution Blue bars denote a histogram of data divided into 1 sec bins. Red curve is a Poisson curve with rate = median count rate of data. |
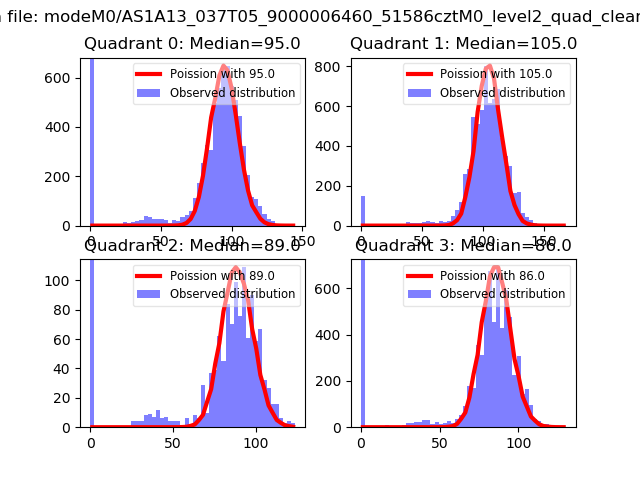 |
 |
| Quadrant-wise count rates Data is divided into 100 sec bins |
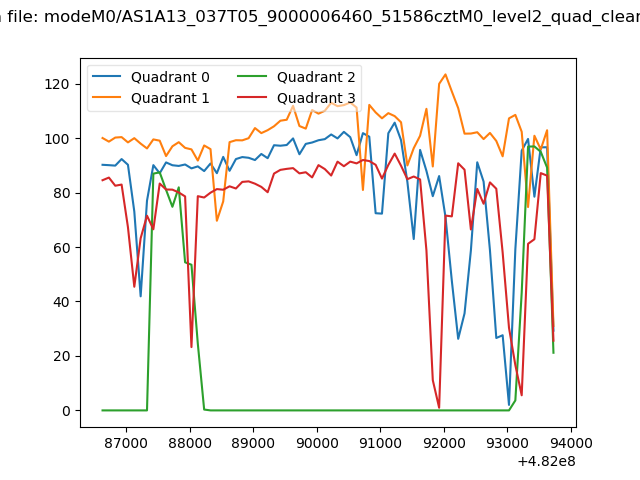 |
|
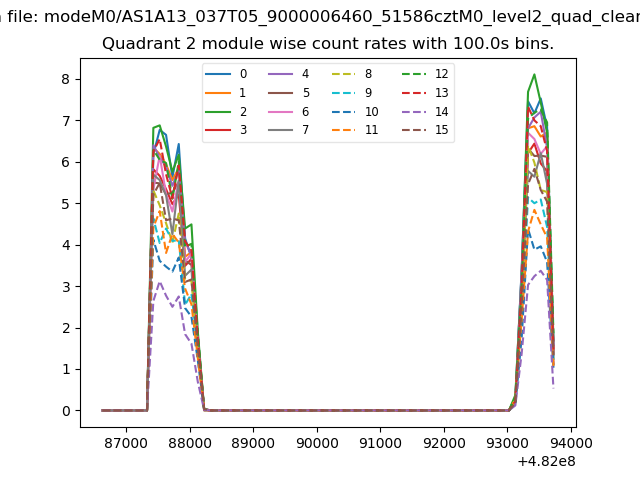
| Module-wise count rates for Quadrant A Data is divided into 100 sec bins |
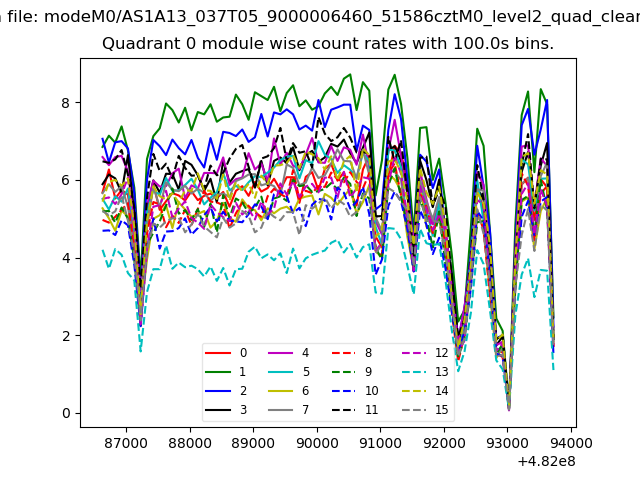 |
 |
| Module-wise count rates for Quadrant B Data is divided into 100 sec bins |
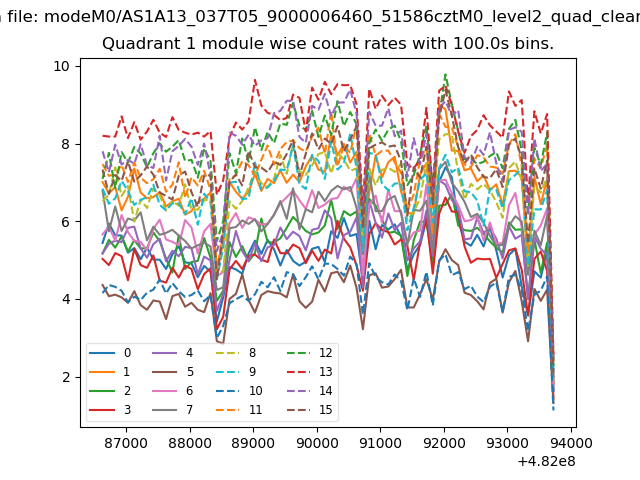 |
 |
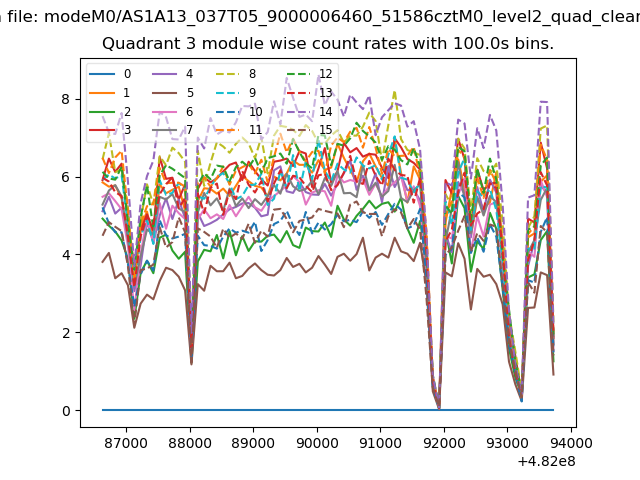
| Module-wise count rates for Quadrant C Data is divided into 100 sec bins |
 |
 |
| Module-wise count rates for Quadrant D Data is divided into 100 sec bins |
 |
 |
| Parameter | Plot |
|---|---|
| CZT HV Monitor | 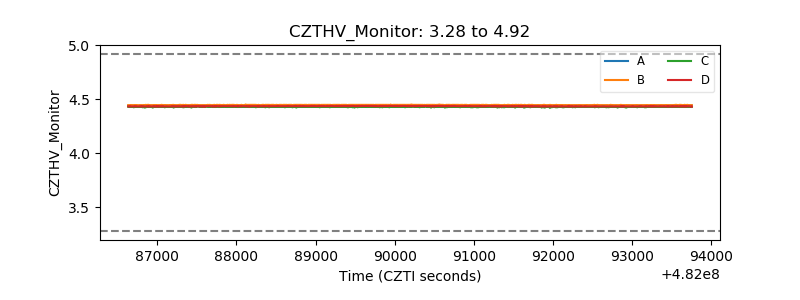 |
| D_VDD | 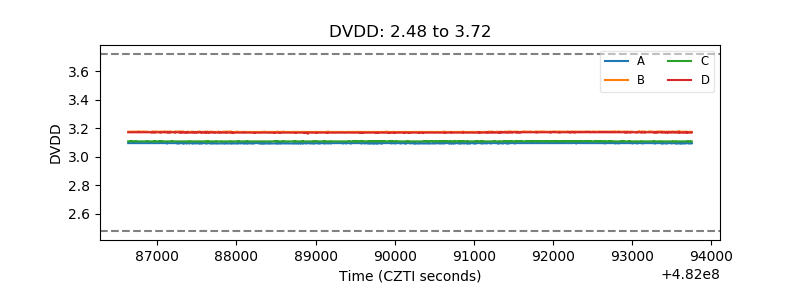 |
| Temperature 1 | 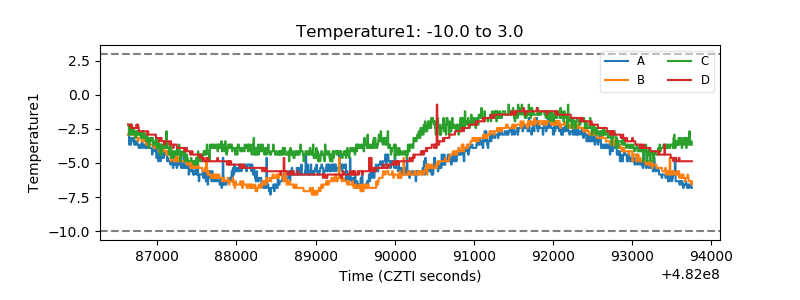 |
| Veto HV Monitor | 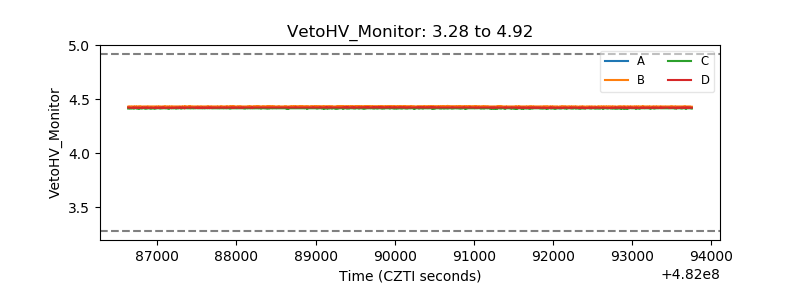 |
| Veto LLD | 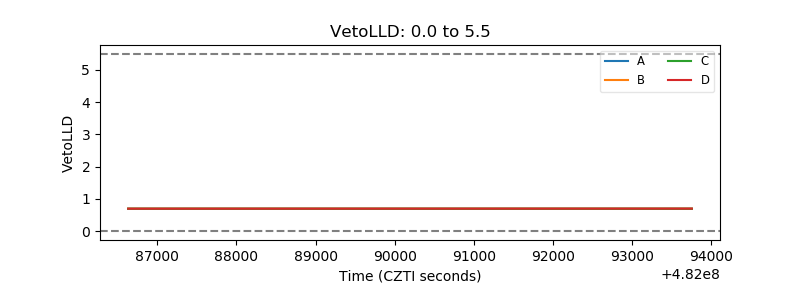 |
| Alpha Counter | 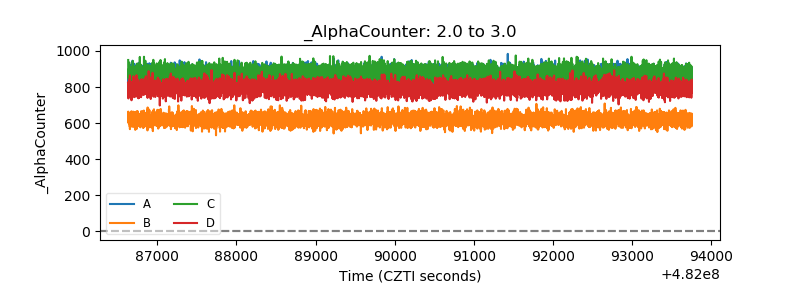 |
| _CPM_Rate |  |
| CZT Counter | 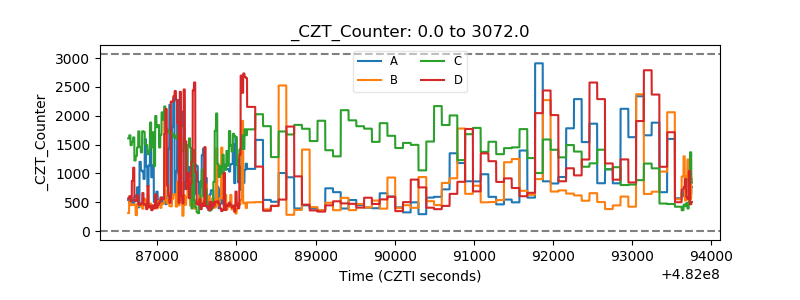 |
| +2.5 Volts monitor | 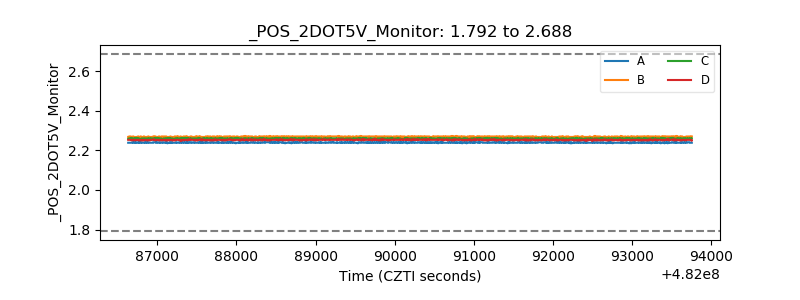 |
| +5 Volts monitor | 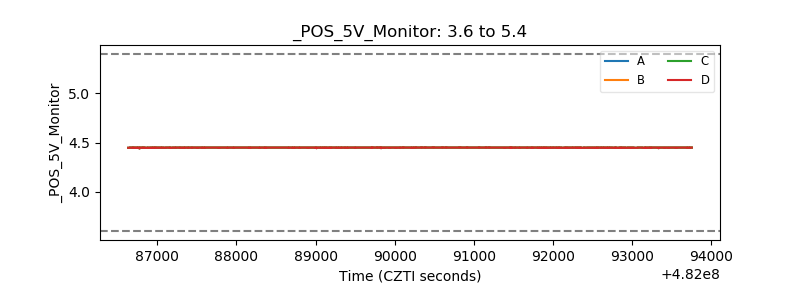 |
| _ROLL_ROT | 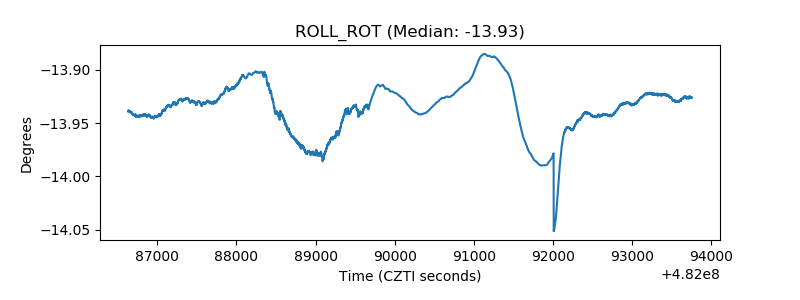 |
| _Roll_DEC | 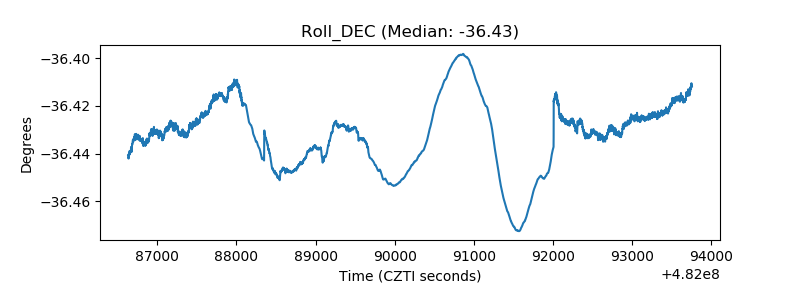 |
| _Roll_RA | 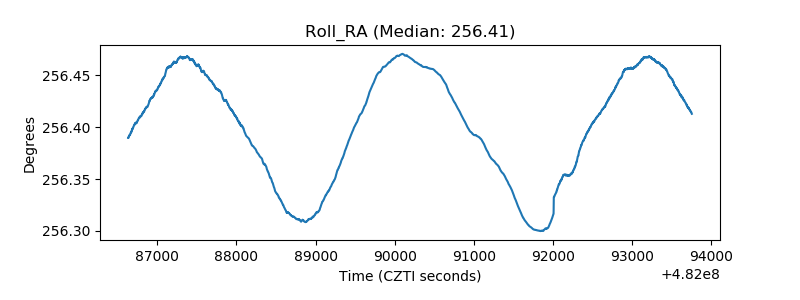 |
| Veto Counter | 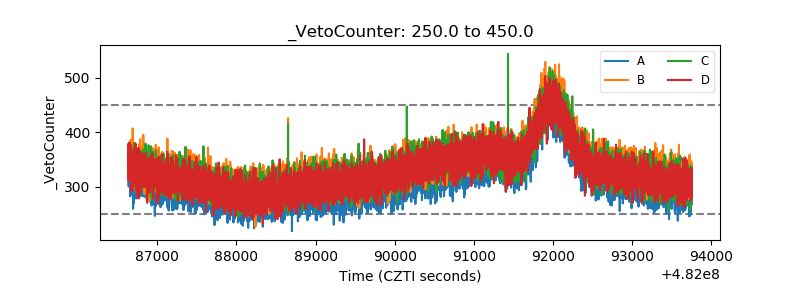 |