| Param | Original file | Final file |
|---|---|---|
| Filename | modeM0/AS1A13_037T05_9000006460_51587cztM0_level2.fits | modeM0/AS1A13_037T05_9000006460_51587cztM0_level2_quad_clean.evt |
| Size (bytes) | 784,946,880 | 104,143,680 |
| Size | 748.6 MB | 99.3 MB |
| Events in quadrant A | 7,673,058 | 630,547 |
| Events in quadrant B | 5,977,700 | 780,869 |
| Events in quadrant C | 6,168,394 | 591,906 |
| Events in quadrant D | 8,631,249 | 605,520 |
| Mode M0 | |||
|---|---|---|---|
| Quadrant | BADHDUFLAG | Total packets | Discarded packets |
| A | 0 | 28216 | 0 |
| B | 0 | 23106 | 0 |
| C | 0 | 23744 | 0 |
| D | 0 | 31133 | 0 |
| Mode SS | |||
|---|---|---|---|
| Quadrant | BADHDUFLAG | Total packets | Discarded packets |
| A | 0 | 156 | 0 |
| B | 0 | 156 | 0 |
| C | 0 | 156 | 0 |
| D | 0 | 156 | 0 |
| Quadrant | Total seconds | Saturated seconds | Saturation percentage |
|---|---|---|---|
| A | 7827 | 1366 | 17.452408% |
| B | 7826 | 537 | 6.861743% |
| C | 7826 | 1568 | 20.035778% |
| D | 7826 | 1006 | 12.854587% |
Noise dominated data is calculated using 1-second bins in cleaned event files. If a bin has >2000 counts, and if more than 50% of those come from <1% of pixels, then it is considered to be noise-dominated and hence unusable.
| Quadrant | # 1 sec bins | Bins with >0 counts | Bins with >2000 counts | High rate bins dominated by noise | Noise dominated (total time) | Noise dominated (detector-on time) | Marked lightcurve |
|---|---|---|---|---|---|---|---|
| A | 7827 | 7827 | 970 | 970 | 12.39% | 12.39% | 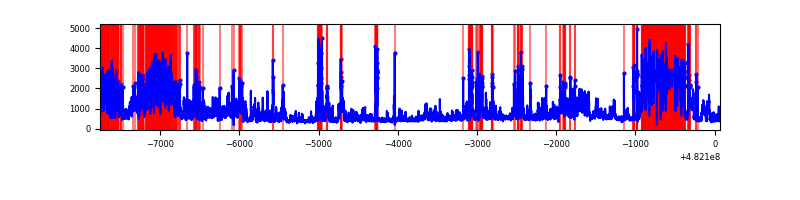 |
| B | 7826 | 7826 | 337 | 337 | 4.31% | 4.31% | 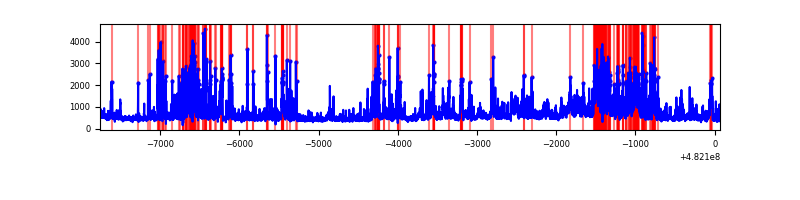 |
| C | 7826 | 7826 | 417 | 417 | 5.33% | 5.33% | 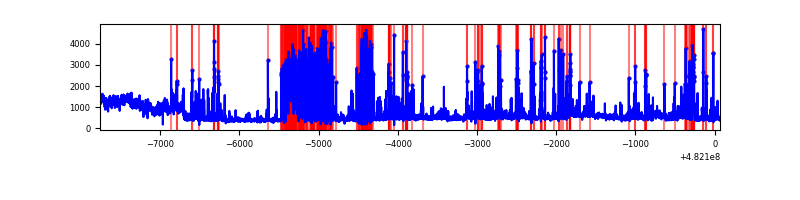 |
| D | 7826 | 7826 | 954 | 954 | 12.19% | 12.19% | 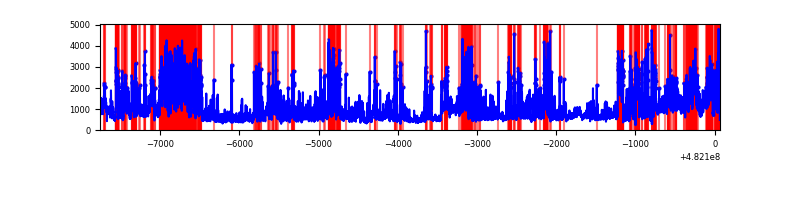 |
Top three noisy pixels from each quadrant. If the there are fewer than three noisy pixels in the level2.evt file, extra rows are filled as -1
| Pixel properties | Quadrant properties | ||||||
|---|---|---|---|---|---|---|---|
| Quadrant | DetID | PixID | Counts | Sigma | Mean | Median | Sigma |
| A | 12 | 250 | 1782359 | 9169.05 | 777 | 761 | 194.3 |
| A | 7 | 160 | 1295316 | 6662.47 | 777 | 761 | 194.3 |
| A | 12 | 3 | 491500 | 2525.6 | 777 | 761 | 194.3 |
| B | 10 | 44 | 1373337 | 7835.62 | 822 | 796 | 175.2 |
| B | 1 | 223 | 375999 | 2141.97 | 822 | 796 | 175.2 |
| B | 5 | 185 | 300645 | 1711.79 | 822 | 796 | 175.2 |
| C | 15 | 198 | 1183140 | 6176.77 | 693 | 689 | 191.4 |
| C | 15 | 147 | 926611 | 4836.74 | 693 | 689 | 191.4 |
| C | 0 | 177 | 449477 | 2344.33 | 693 | 689 | 191.4 |
| D | 8 | 176 | 1310163 | 6066.46 | 771 | 745 | 215.8 |
| D | 5 | 113 | 1147853 | 5314.49 | 771 | 745 | 215.8 |
| D | 6 | 228 | 1050349 | 4862.76 | 771 | 745 | 215.8 |
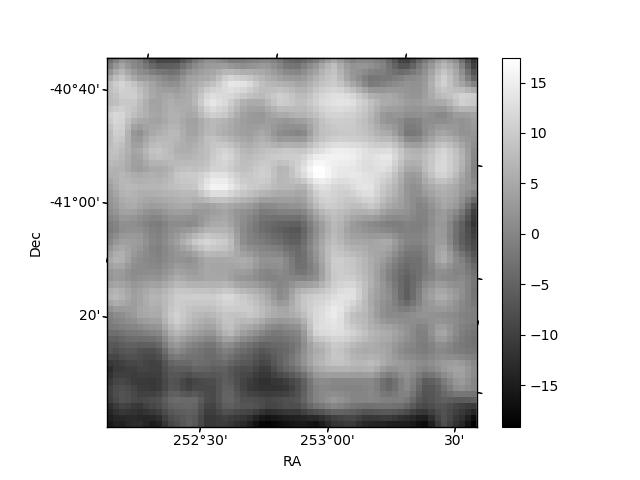
Histogram calculated using DETX and DETY for each event in the final _common_clean file
| Quadrant A | 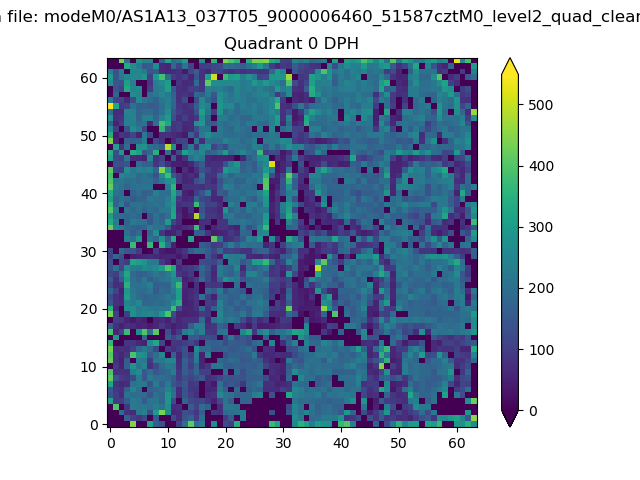 |
 |
Quadrant B |
|---|---|---|---|
| Quadrant D | 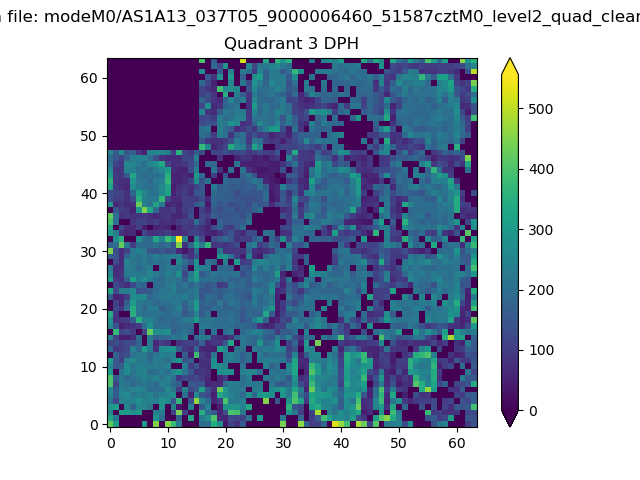 |
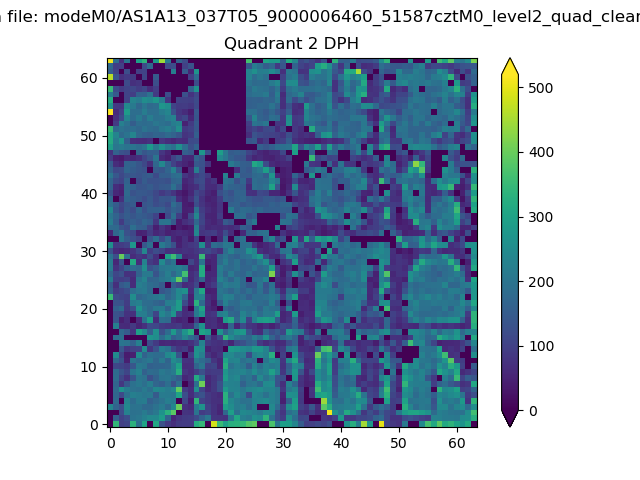 |
Quadrant C |
| Plot type | Count rate plots | Images |
|---|---|---|
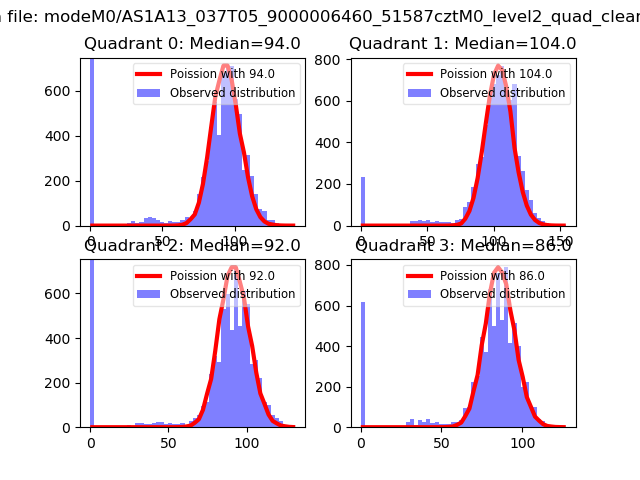
| Comparison with Poisson distribution Blue bars denote a histogram of data divided into 1 sec bins. Red curve is a Poisson curve with rate = median count rate of data. |
 |
 |
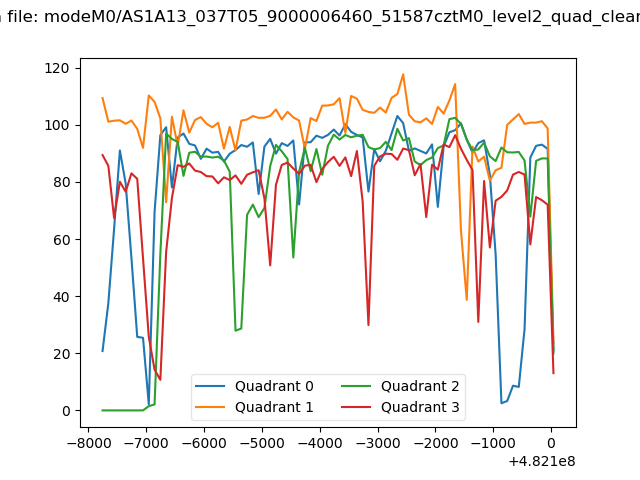
| Quadrant-wise count rates Data is divided into 100 sec bins |
 |
|
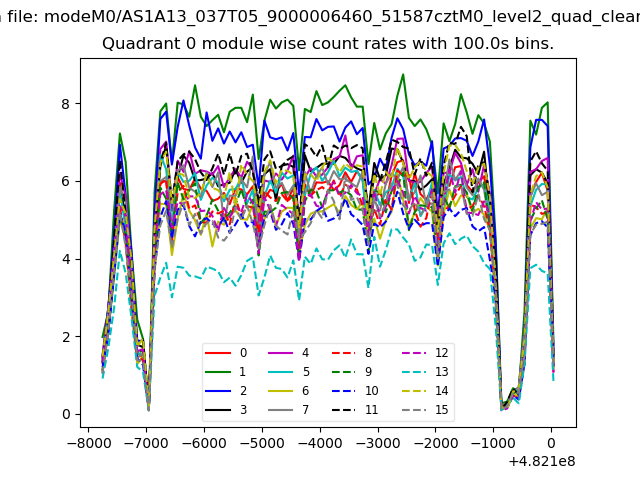
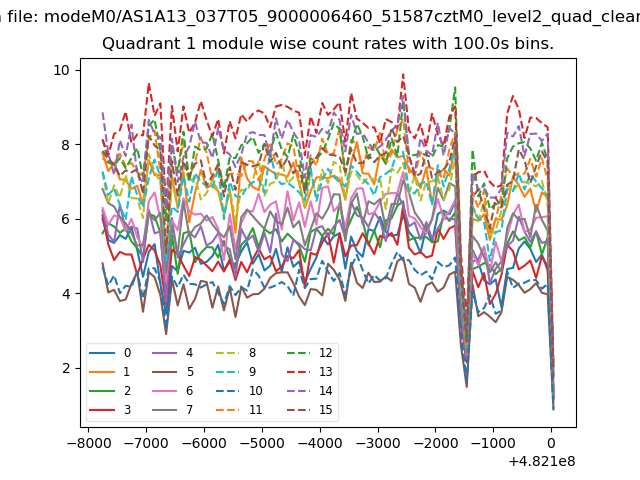
| Module-wise count rates for Quadrant A Data is divided into 100 sec bins |
 |
 |
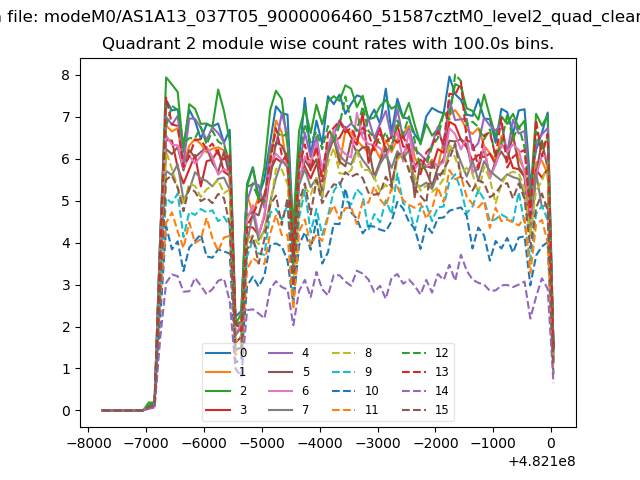
| Module-wise count rates for Quadrant B Data is divided into 100 sec bins |
 |
 |
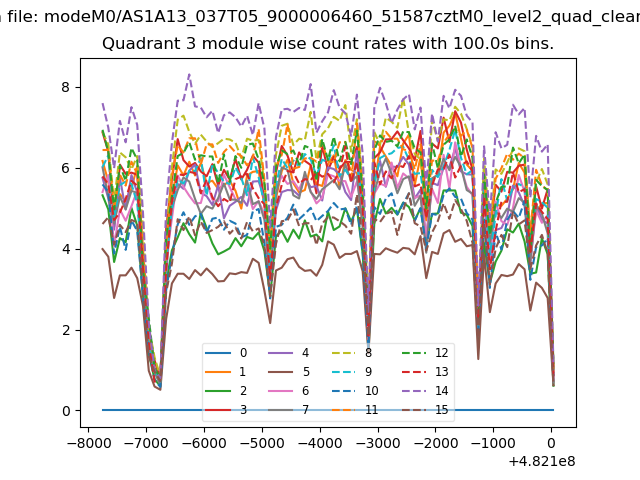
| Module-wise count rates for Quadrant C Data is divided into 100 sec bins |
 |
 |
| Module-wise count rates for Quadrant D Data is divided into 100 sec bins |
 |
 |
| Parameter | Plot |
|---|---|
| CZT HV Monitor | 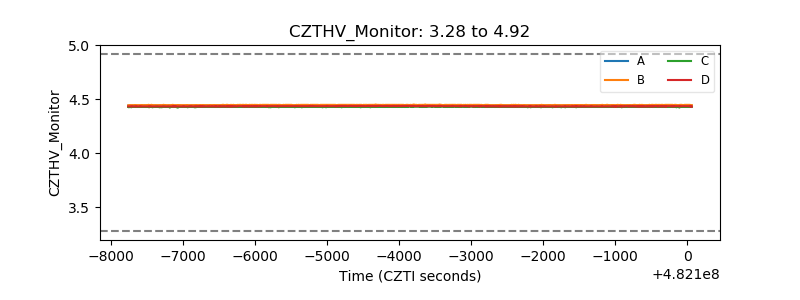 |
| D_VDD | 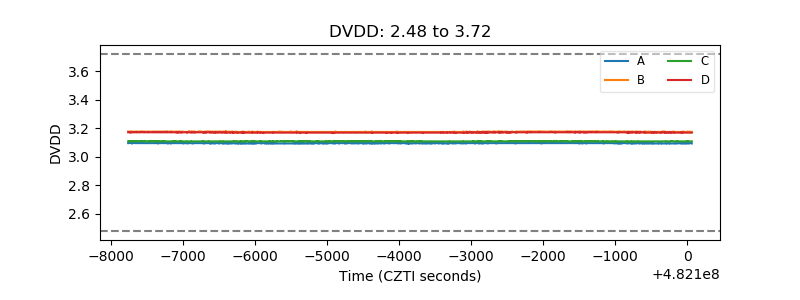 |
| Temperature 1 | 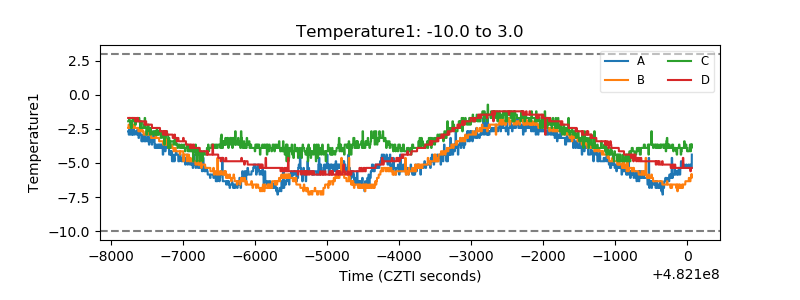 |
| Veto HV Monitor | 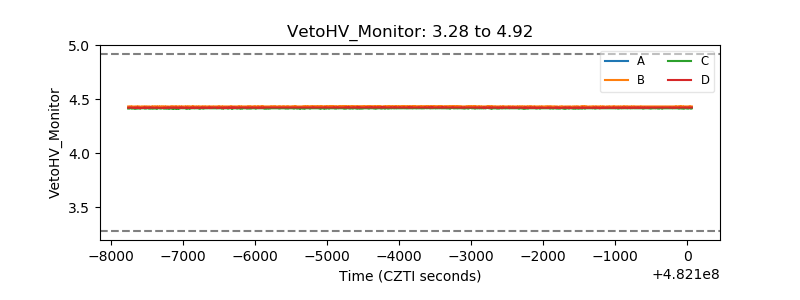 |
| Veto LLD | 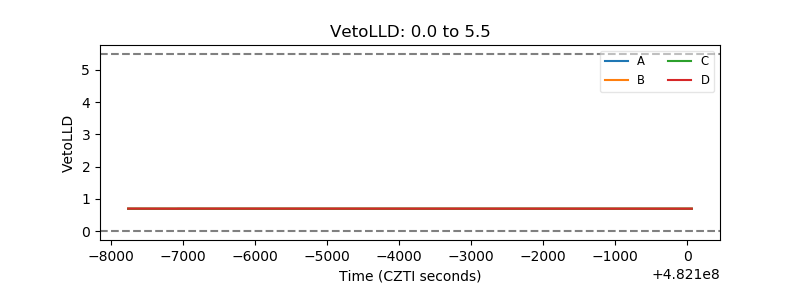 |
| Alpha Counter | 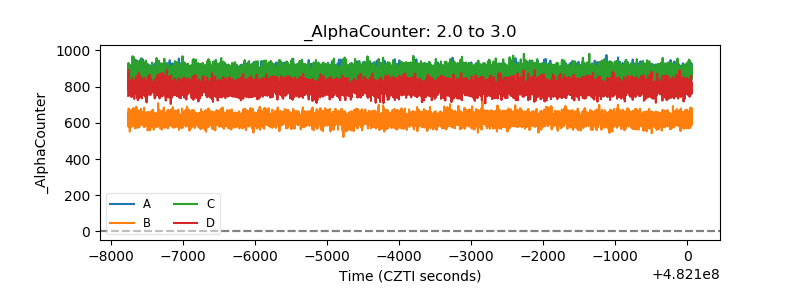 |
| _CPM_Rate | 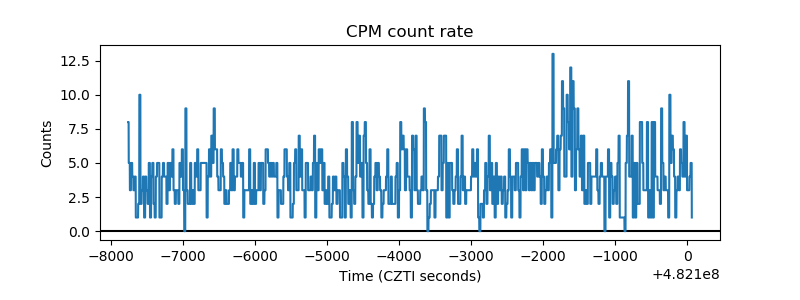 |
| CZT Counter | 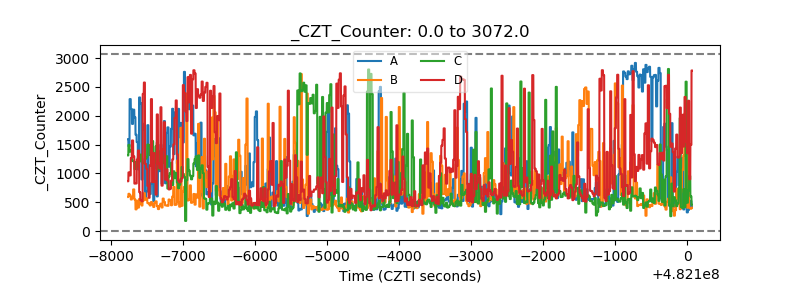 |
| +2.5 Volts monitor | 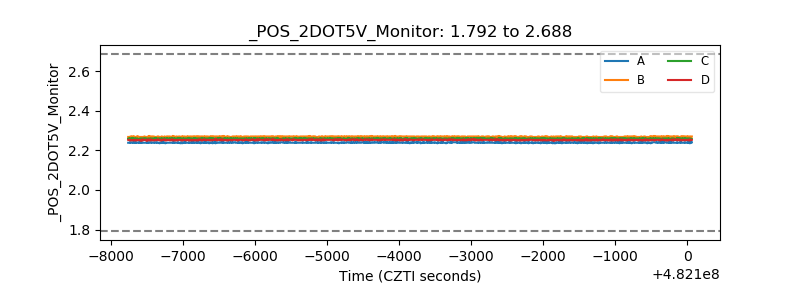 |
| +5 Volts monitor | 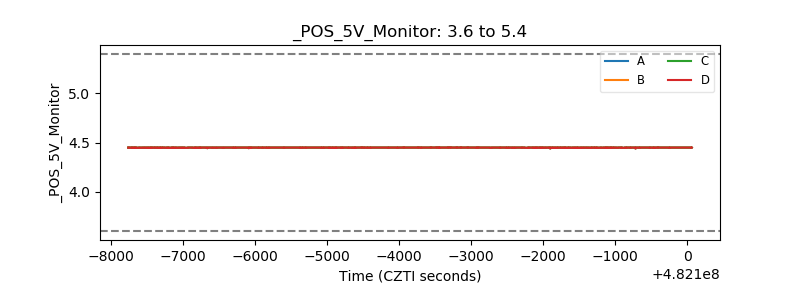 |
| _ROLL_ROT | 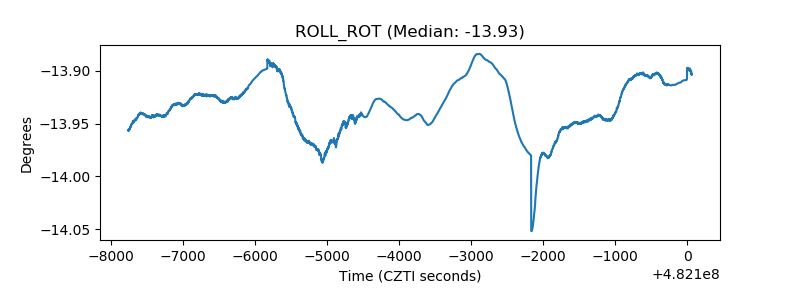 |
| _Roll_DEC | 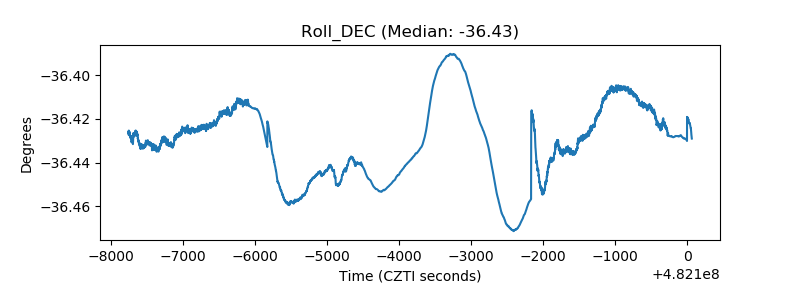 |
| _Roll_RA | 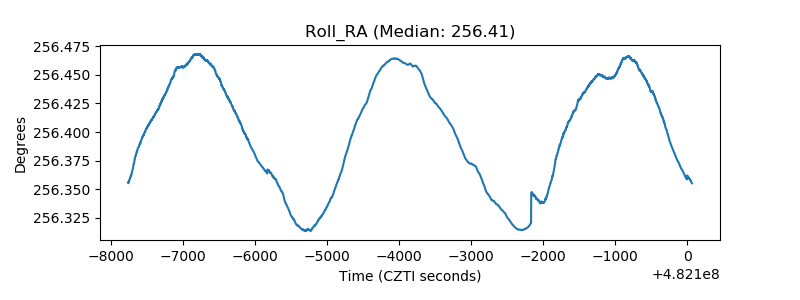 |
| Veto Counter | 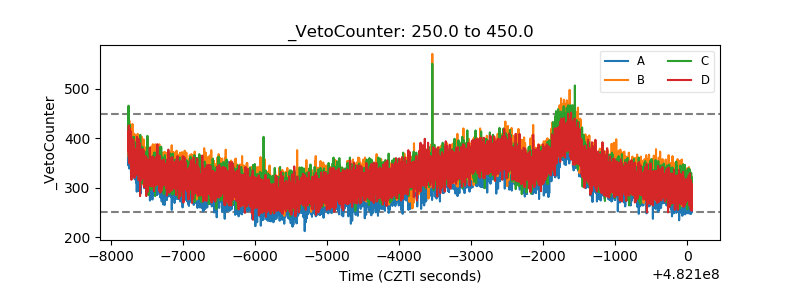 |