| Param | Original file | Final file |
|---|---|---|
| Filename | modeM0/AS1A13_037T05_9000006460_51594cztM0_level2.fits | modeM0/AS1A13_037T05_9000006460_51594cztM0_level2_quad_clean.evt |
| Size (bytes) | 2,551,199,040 | 363,648,960 |
| Size | 2.4 GB | 346.8 MB |
| Events in quadrant A | 18,800,082 | 2,426,107 |
| Events in quadrant B | 20,684,885 | 2,624,014 |
| Events in quadrant C | 23,190,958 | 2,163,710 |
| Events in quadrant D | 29,680,473 | 1,939,455 |
| Mode M9 | |||
|---|---|---|---|
| Quadrant | BADHDUFLAG | Total packets | Discarded packets |
| A | 0 | 13 | 0 |
| B | 0 | 13 | 0 |
| C | 0 | 13 | 0 |
| D | 0 | 13 | 0 |
| Mode M0 | |||
|---|---|---|---|
| Quadrant | BADHDUFLAG | Total packets | Discarded packets |
| A | 0 | 74511 | 3 |
| B | 0 | 80114 | 3 |
| C | 0 | 87901 | 3 |
| D | 0 | 107013 | 3 |
| Mode SS | |||
|---|---|---|---|
| Quadrant | BADHDUFLAG | Total packets | Discarded packets |
| A | 0 | 548 | 0 |
| B | 0 | 548 | 0 |
| C | 0 | 548 | 0 |
| D | 0 | 548 | 0 |
| Quadrant | Total seconds | Saturated seconds | Saturation percentage |
|---|---|---|---|
| A | 26984 | 1752 | 6.492736% |
| B | 26983 | 2124 | 7.871623% |
| C | 26983 | 3698 | 13.704925% |
| D | 26984 | 4775 | 17.695672% |
Noise dominated data is calculated using 1-second bins in cleaned event files. If a bin has >2000 counts, and if more than 50% of those come from <1% of pixels, then it is considered to be noise-dominated and hence unusable.
| Quadrant | # 1 sec bins | Bins with >0 counts | Bins with >2000 counts | High rate bins dominated by noise | Noise dominated (total time) | Noise dominated (detector-on time) | Marked lightcurve |
|---|---|---|---|---|---|---|---|
| A | 28334 | 26988 | 1165 | 1165 | 4.11% | 4.32% |  |
| B | 28333 | 26987 | 1215 | 1215 | 4.29% | 4.50% |  |
| C | 28333 | 26985 | 2644 | 2644 | 9.33% | 9.80% | 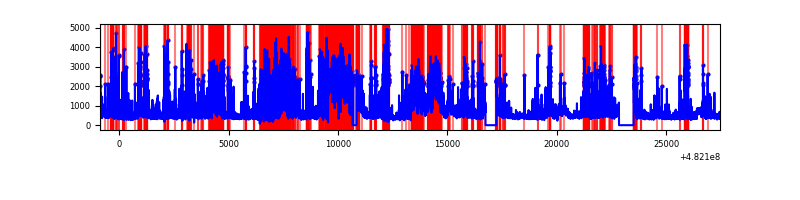 |
| D | 28334 | 26987 | 4486 | 4486 | 15.83% | 16.62% |  |
Top three noisy pixels from each quadrant. If the there are fewer than three noisy pixels in the level2.evt file, extra rows are filled as -1
| Pixel properties | Quadrant properties | ||||||
|---|---|---|---|---|---|---|---|
| Quadrant | DetID | PixID | Counts | Sigma | Mean | Median | Sigma |
| A | 12 | 250 | 2797873 | 4030.93 | 2834 | 2767 | 693.4 |
| A | 7 | 160 | 1170134 | 1683.5 | 2834 | 2767 | 693.4 |
| A | 3 | 130 | 589182 | 845.69 | 2834 | 2767 | 693.4 |
| B | 10 | 44 | 4076726 | 6754.95 | 2833 | 2730 | 603.1 |
| B | 4 | 174 | 1503045 | 2487.62 | 2833 | 2730 | 603.1 |
| B | 5 | 185 | 600113 | 990.5 | 2833 | 2730 | 603.1 |
| C | 15 | 232 | 4045467 | 5496.08 | 2670 | 2652 | 735.6 |
| C | 15 | 198 | 3180090 | 4319.63 | 2670 | 2652 | 735.6 |
| C | 9 | 38 | 1018763 | 1381.37 | 2670 | 2652 | 735.6 |
| D | 5 | 113 | 9339170 | 13078.3 | 2583 | 2497 | 713.9 |
| D | 8 | 176 | 2208187 | 3089.61 | 2583 | 2497 | 713.9 |
| D | 12 | 6 | 1907788 | 2668.83 | 2583 | 2497 | 713.9 |
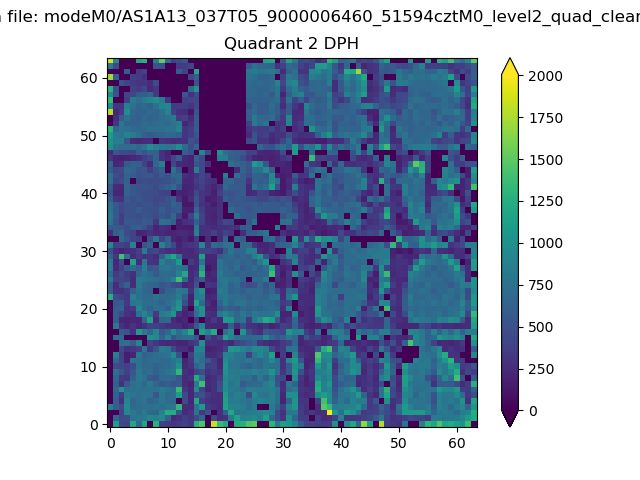
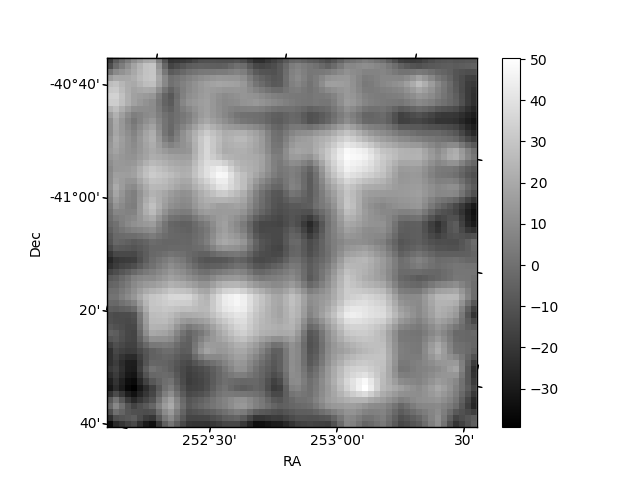
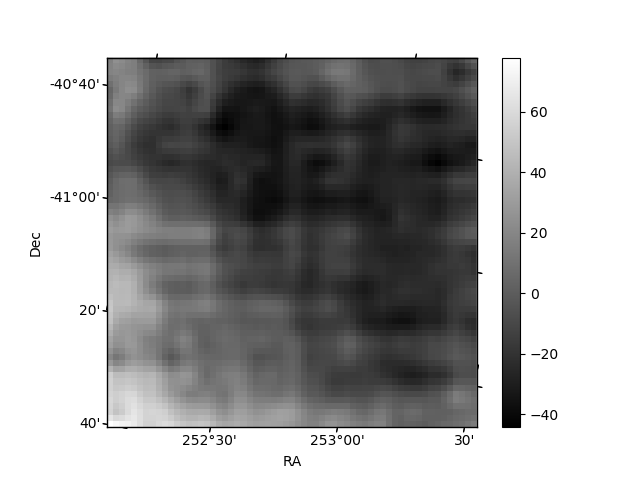
Histogram calculated using DETX and DETY for each event in the final _common_clean file
| Quadrant A | 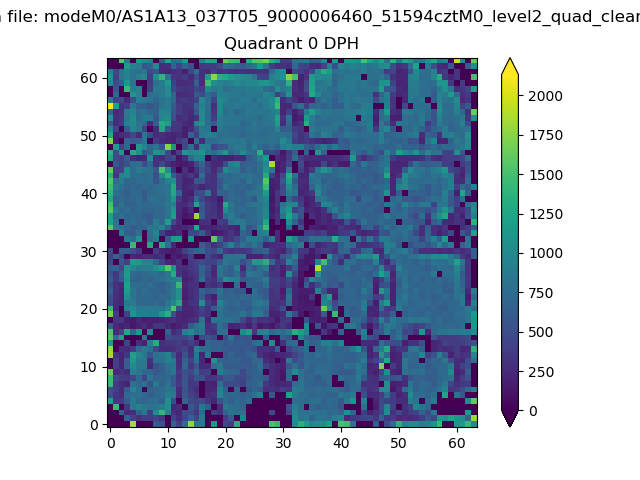 |
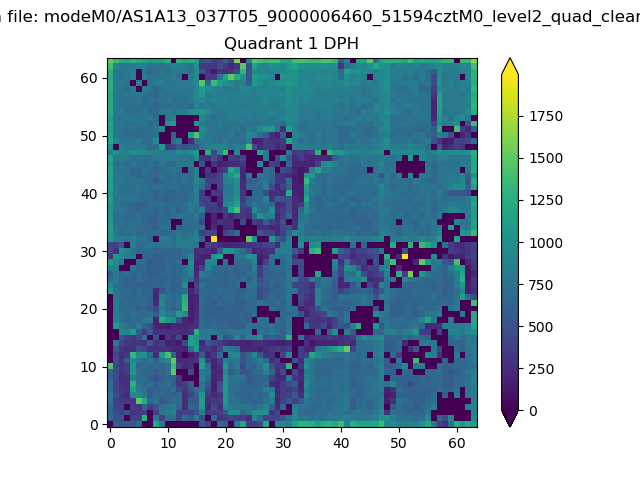 |
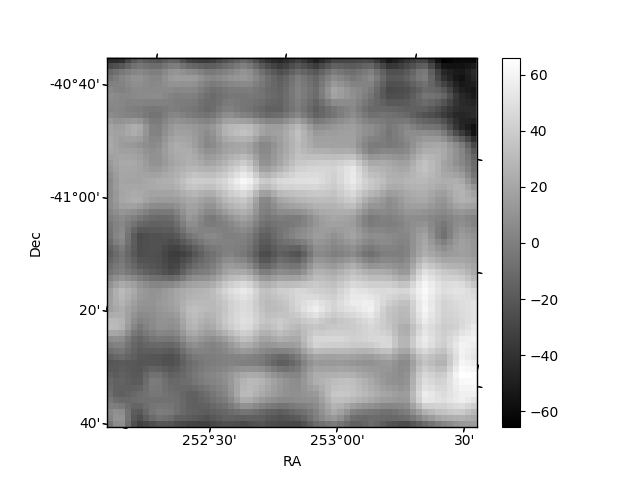
Quadrant B |
|---|---|---|---|
| Quadrant D | 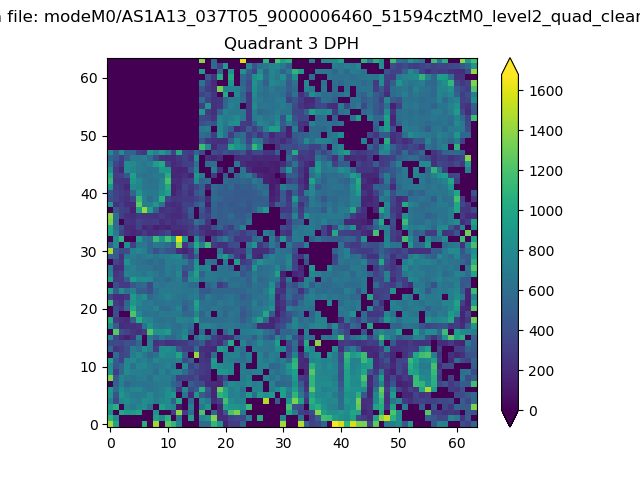 |
 |
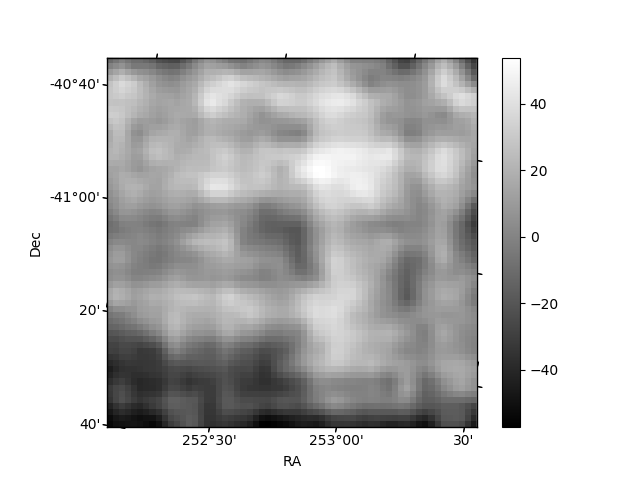
Quadrant C |
| Plot type | Count rate plots | Images |
|---|---|---|
| Comparison with Poisson distribution Blue bars denote a histogram of data divided into 1 sec bins. Red curve is a Poisson curve with rate = median count rate of data. |
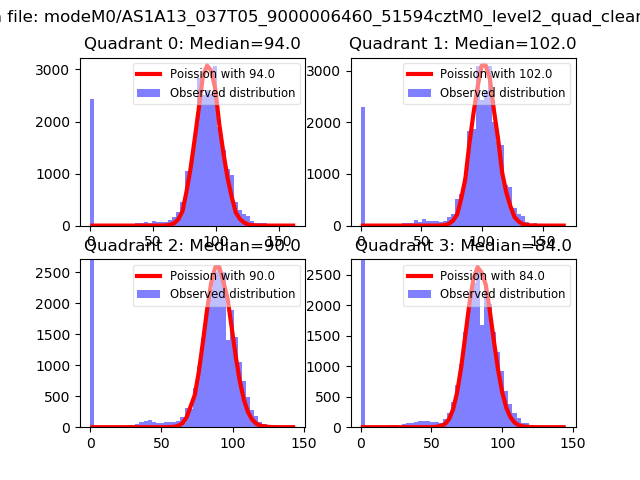 |
 |
| Quadrant-wise count rates Data is divided into 100 sec bins |
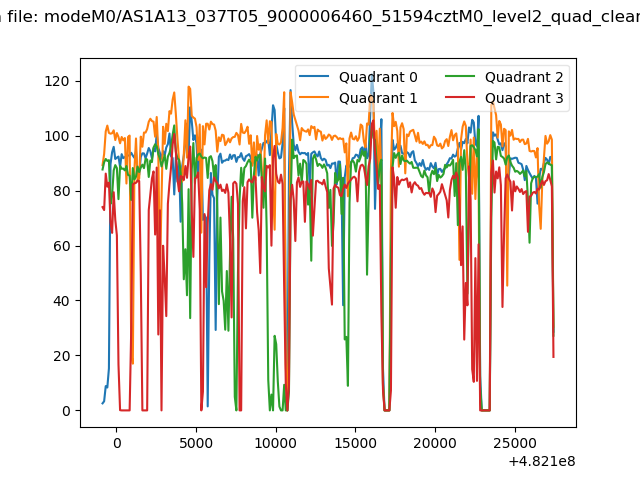 |
|
| Module-wise count rates for Quadrant A Data is divided into 100 sec bins |
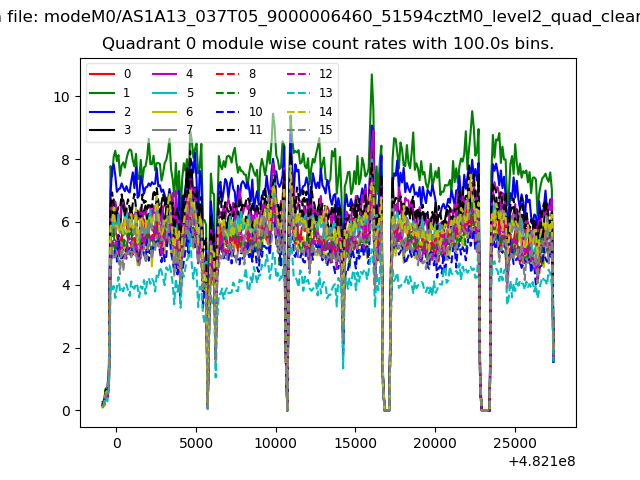 |
 |
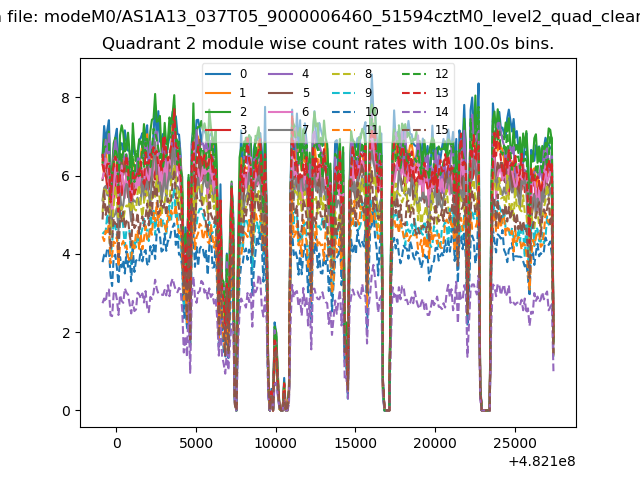
| Module-wise count rates for Quadrant B Data is divided into 100 sec bins |
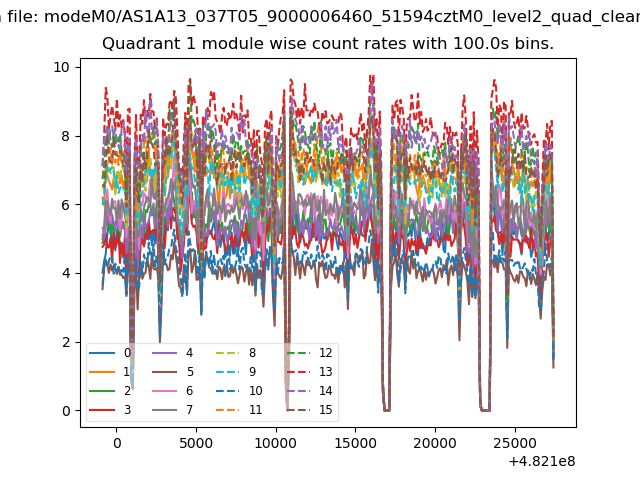 |
 |
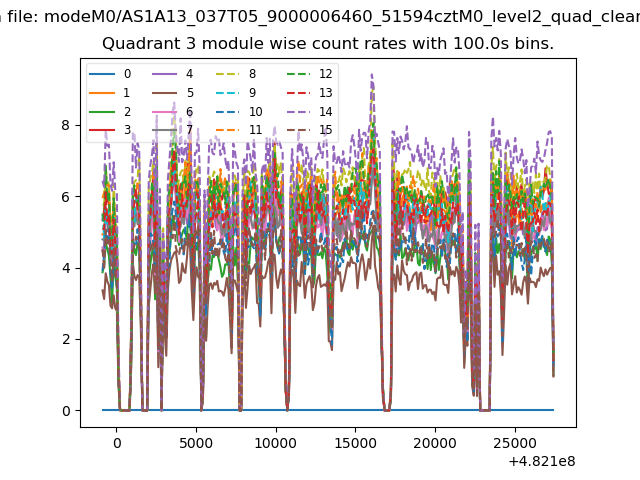
| Module-wise count rates for Quadrant C Data is divided into 100 sec bins |
 |
 |
| Module-wise count rates for Quadrant D Data is divided into 100 sec bins |
 |
 |
| Parameter | Plot |
|---|---|
| CZT HV Monitor | 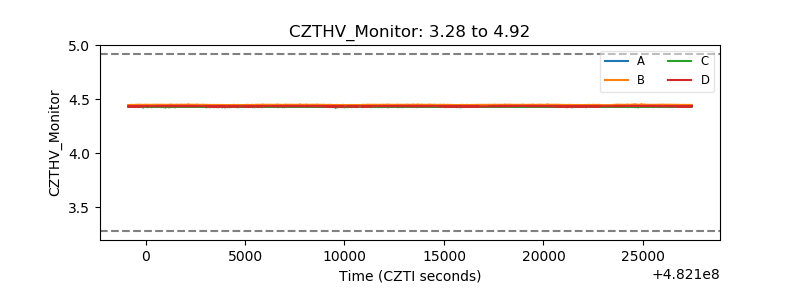 |
| D_VDD | 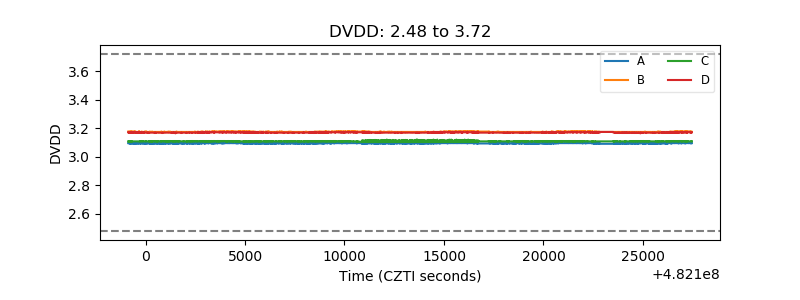 |
| Temperature 1 | 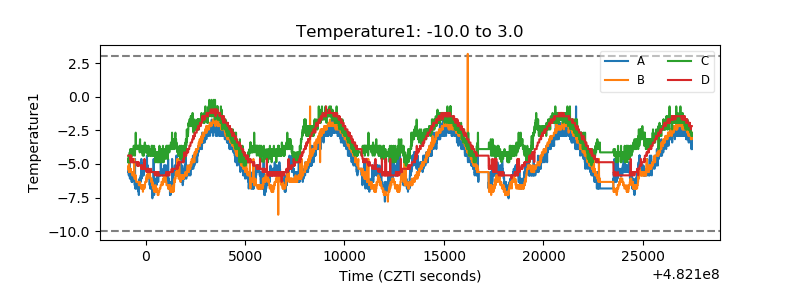 |
| Veto HV Monitor | 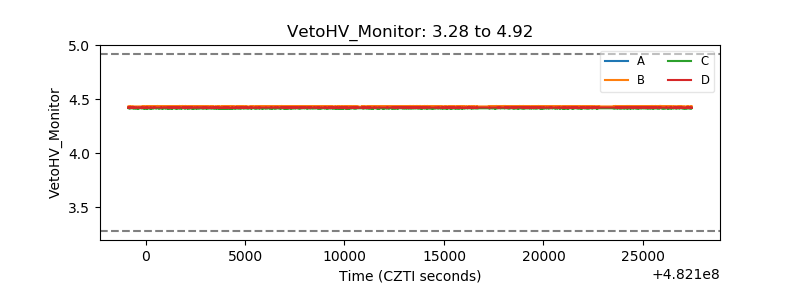 |
| Veto LLD | 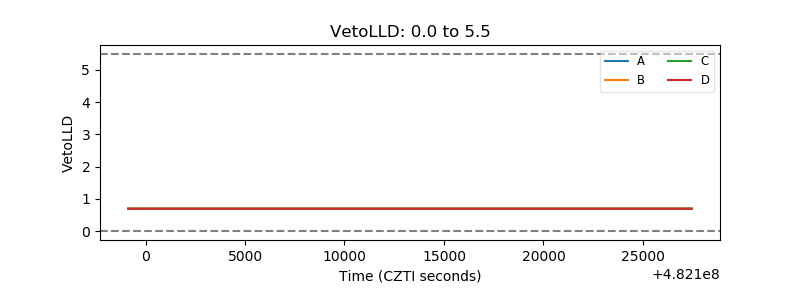 |
| Alpha Counter | 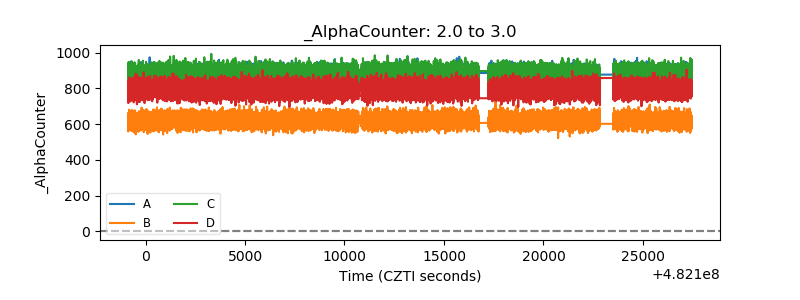 |
| _CPM_Rate | 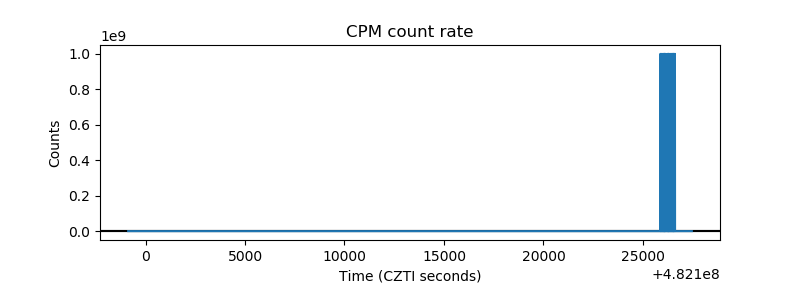 |
| CZT Counter | 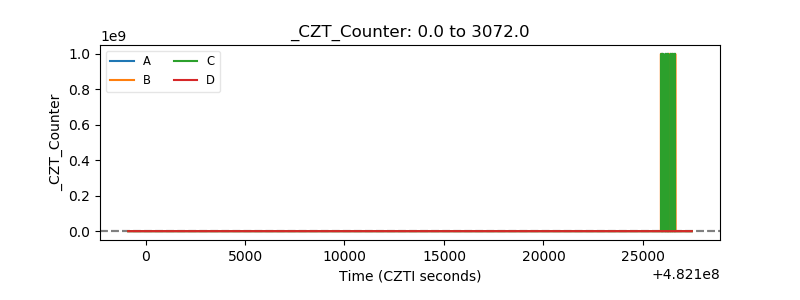 |
| +2.5 Volts monitor | 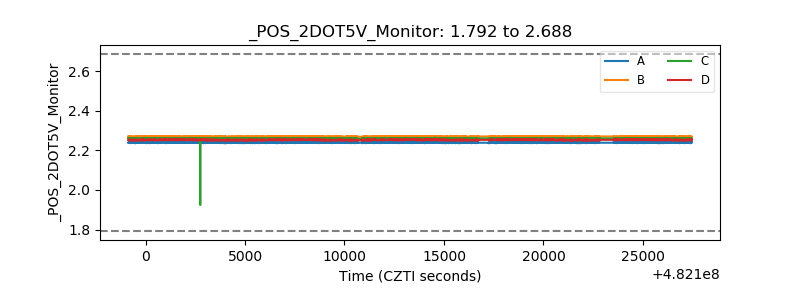 |
| +5 Volts monitor | 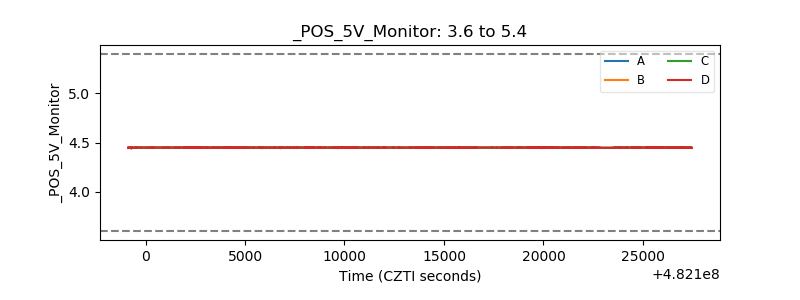 |
| _ROLL_ROT | 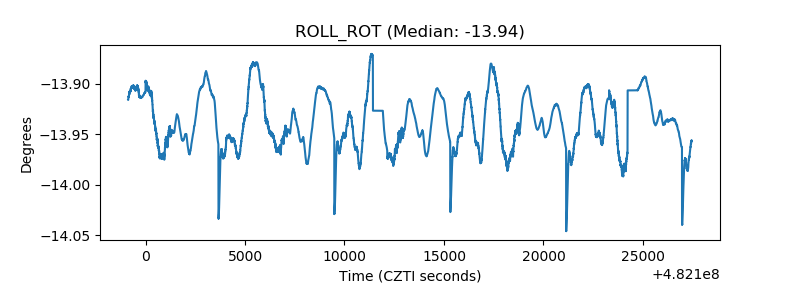 |
| _Roll_DEC | 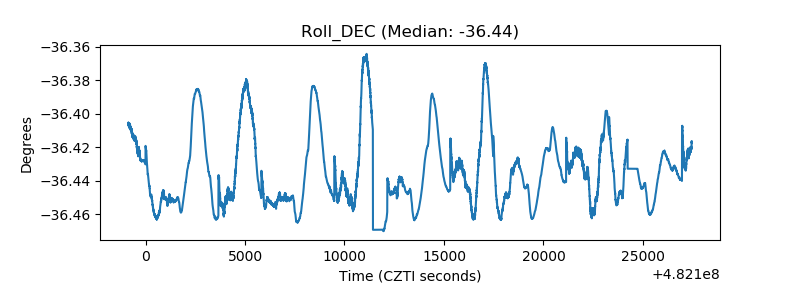 |
| _Roll_RA | 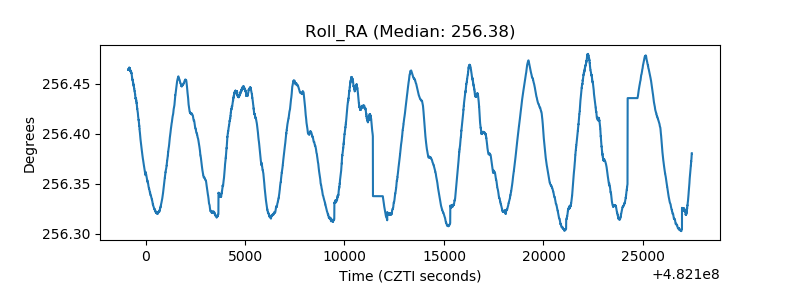 |
| Veto Counter | 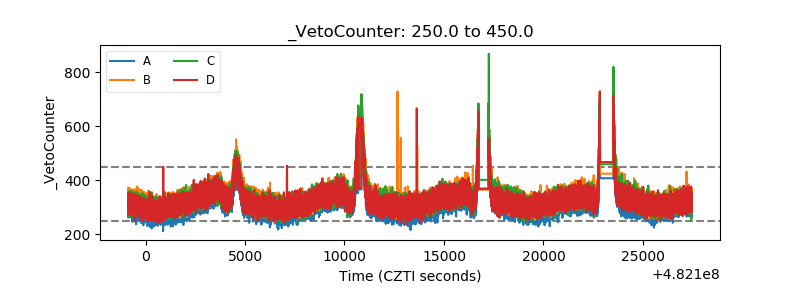 |