| Param | Original file | Final file |
|---|---|---|
| Filename | modeM0/AS1A13_037T05_9000006460_51599cztM0_level2.fits | modeM0/AS1A13_037T05_9000006460_51599cztM0_level2_quad_clean.evt |
| Size (bytes) | 616,331,520 | 99,040,320 |
| Size | 587.8 MB | 94.5 MB |
| Events in quadrant A | 5,699,234 | 643,681 |
| Events in quadrant B | 4,606,515 | 702,060 |
| Events in quadrant C | 5,429,013 | 585,128 |
| Events in quadrant D | 6,527,986 | 572,433 |
| Mode M9 | |||
|---|---|---|---|
| Quadrant | BADHDUFLAG | Total packets | Discarded packets |
| A | 0 | 11 | 0 |
| B | 0 | 12 | 0 |
| C | 0 | 12 | 0 |
| D | 0 | 12 | 0 |
| Mode M0 | |||
|---|---|---|---|
| Quadrant | BADHDUFLAG | Total packets | Discarded packets |
| A | 0 | 21848 | 2 |
| B | 0 | 18519 | 2 |
| C | 0 | 21142 | 2 |
| D | 0 | 24349 | 2 |
| Mode SS | |||
|---|---|---|---|
| Quadrant | BADHDUFLAG | Total packets | Discarded packets |
| A | 0 | 144 | 0 |
| B | 0 | 144 | 0 |
| C | 0 | 144 | 0 |
| D | 0 | 144 | 0 |
| Quadrant | Total seconds | Saturated seconds | Saturation percentage |
|---|---|---|---|
| A | 7117 | 563 | 7.910637% |
| B | 7117 | 507 | 7.123788% |
| C | 7116 | 918 | 12.900506% |
| D | 7116 | 643 | 9.035975% |
Noise dominated data is calculated using 1-second bins in cleaned event files. If a bin has >2000 counts, and if more than 50% of those come from <1% of pixels, then it is considered to be noise-dominated and hence unusable.
| Quadrant | # 1 sec bins | Bins with >0 counts | Bins with >2000 counts | High rate bins dominated by noise | Noise dominated (total time) | Noise dominated (detector-on time) | Marked lightcurve |
|---|---|---|---|---|---|---|---|
| A | 7847 | 7117 | 211 | 211 | 2.69% | 2.96% | 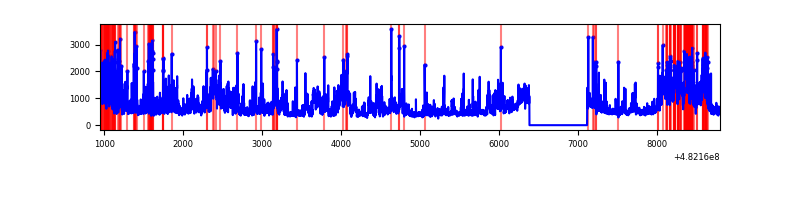 |
| B | 7847 | 7117 | 225 | 225 | 2.87% | 3.16% | 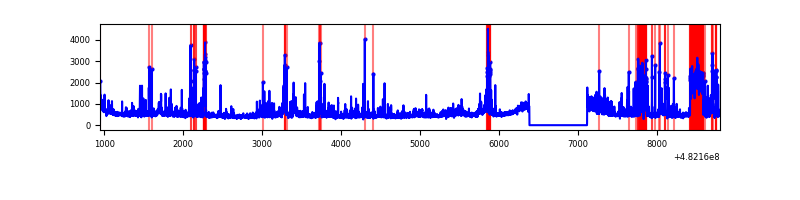 |
| C | 7846 | 7116 | 653 | 653 | 8.32% | 9.18% | 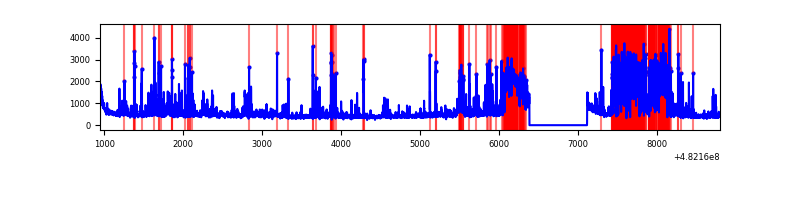 |
| D | 7846 | 7117 | 514 | 514 | 6.55% | 7.22% | 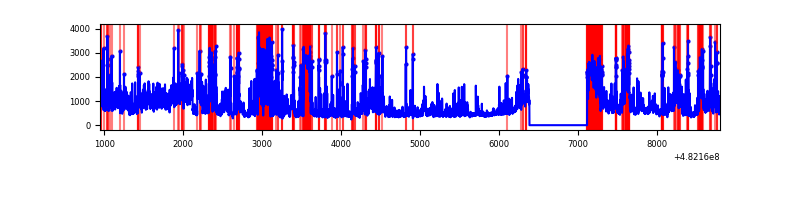 |
Top three noisy pixels from each quadrant. If the there are fewer than three noisy pixels in the level2.evt file, extra rows are filled as -1
| Pixel properties | Quadrant properties | ||||||
|---|---|---|---|---|---|---|---|
| Quadrant | DetID | PixID | Counts | Sigma | Mean | Median | Sigma |
| A | 12 | 250 | 1150487 | 5953.47 | 782 | 762 | 193.1 |
| A | 8 | 10 | 493617 | 2552.08 | 782 | 762 | 193.1 |
| A | 12 | 3 | 457631 | 2365.74 | 782 | 762 | 193.1 |
| B | 5 | 172 | 517978 | 3074.51 | 780 | 752 | 168.2 |
| B | 4 | 174 | 169098 | 1000.69 | 780 | 752 | 168.2 |
| B | 5 | 185 | 134995 | 797.97 | 780 | 752 | 168.2 |
| C | 13 | 3 | 1414984 | 7103.99 | 724 | 722 | 199.1 |
| C | 15 | 198 | 527042 | 2643.76 | 724 | 722 | 199.1 |
| C | 10 | 19 | 256906 | 1286.84 | 724 | 722 | 199.1 |
| D | 8 | 176 | 1312007 | 6420.96 | 737 | 713 | 204.2 |
| D | 2 | 163 | 547331 | 2676.6 | 737 | 713 | 204.2 |
| D | 12 | 6 | 436147 | 2132.17 | 737 | 713 | 204.2 |
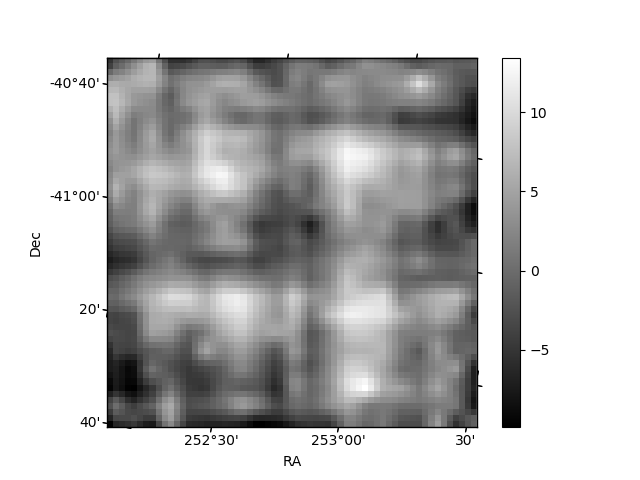
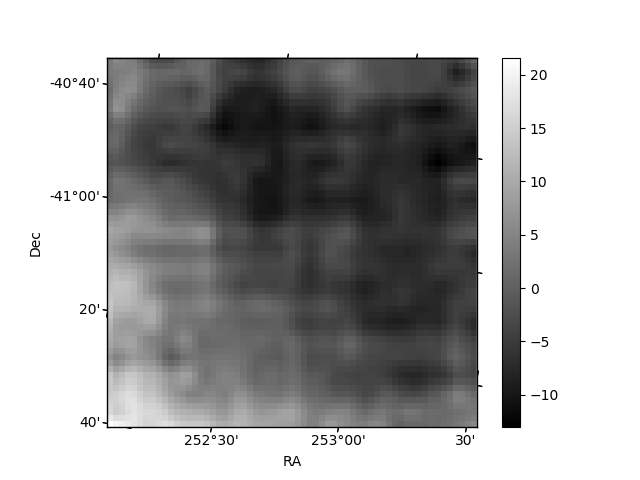
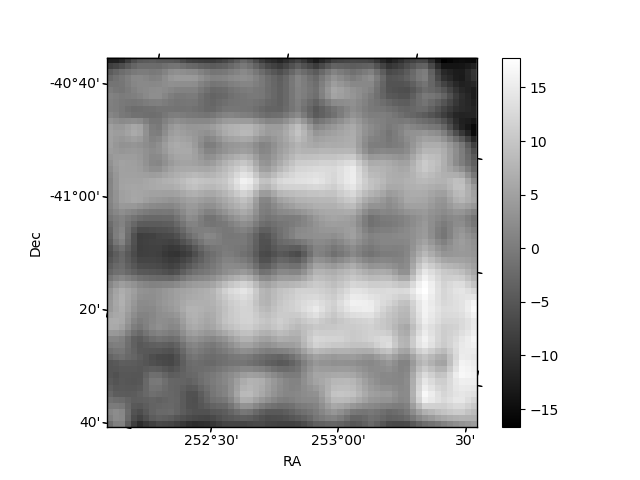
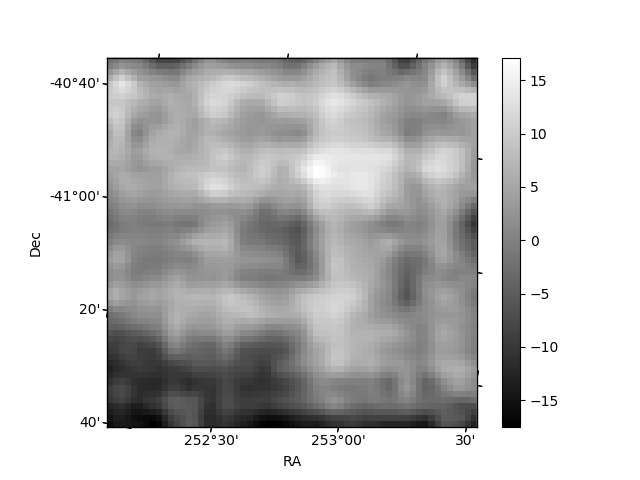
Histogram calculated using DETX and DETY for each event in the final _common_clean file
| Quadrant A | 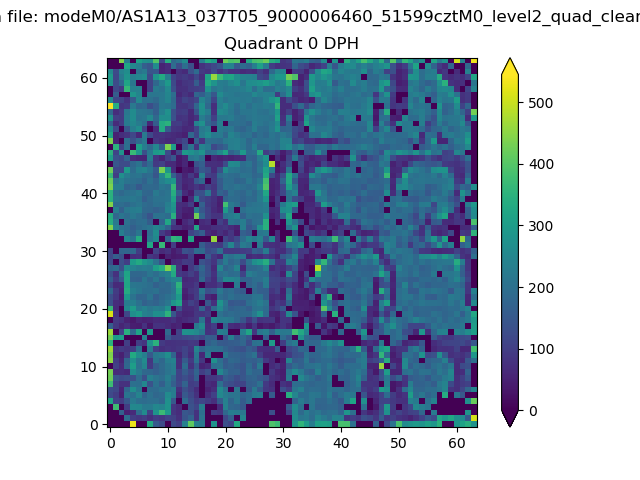 |
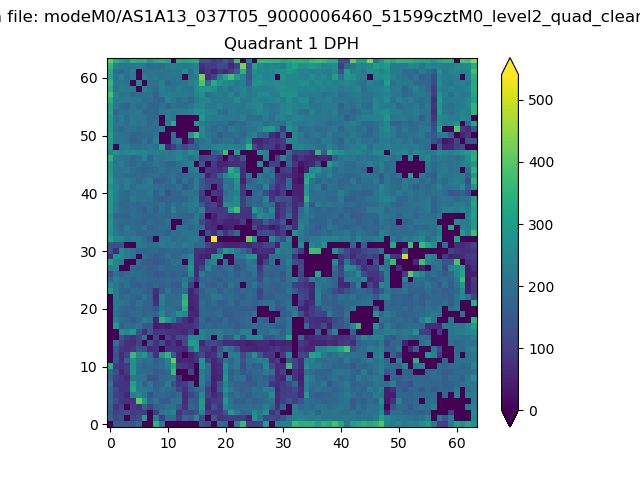 |
Quadrant B |
|---|---|---|---|
| Quadrant D | 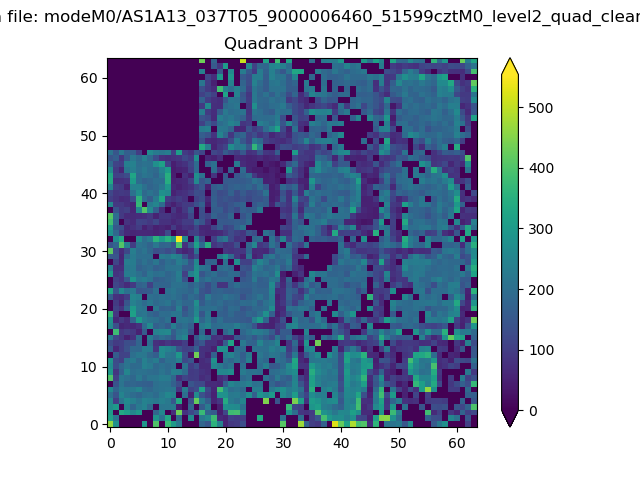 |
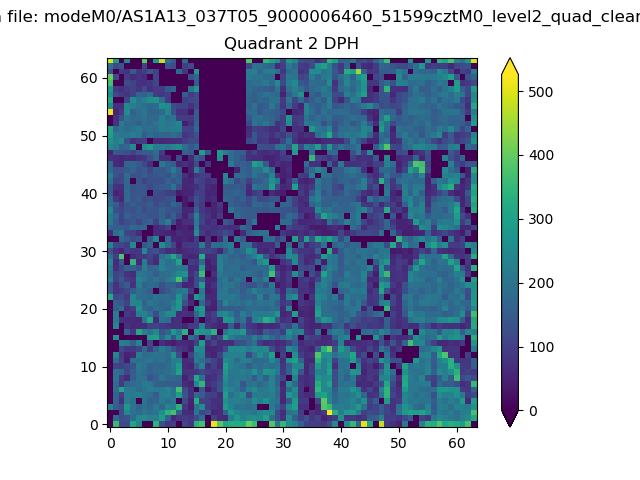 |
Quadrant C |
| Plot type | Count rate plots | Images |
|---|---|---|
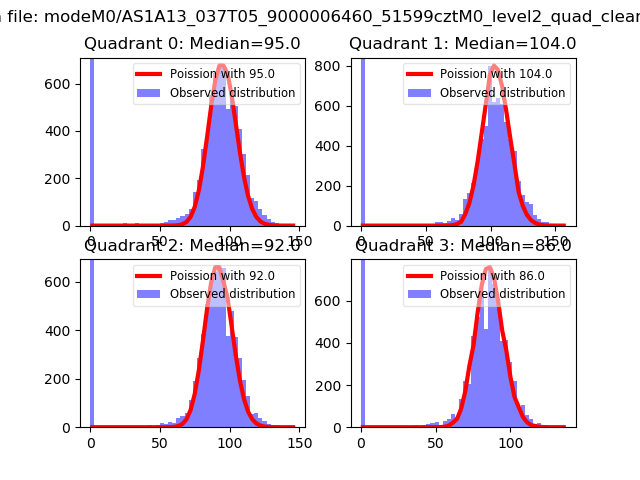
| Comparison with Poisson distribution Blue bars denote a histogram of data divided into 1 sec bins. Red curve is a Poisson curve with rate = median count rate of data. |
 |
 |
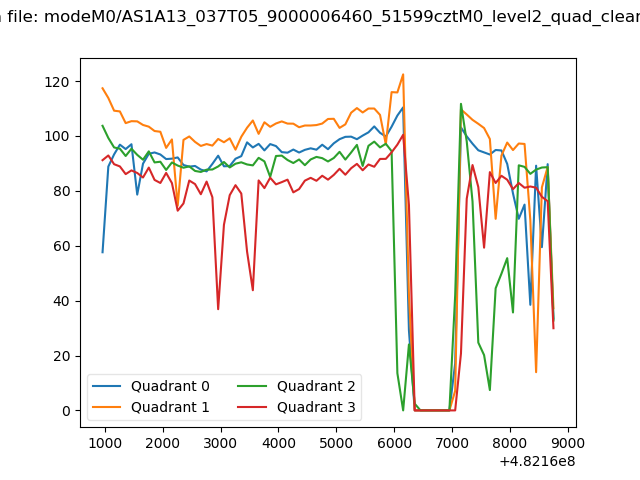
| Quadrant-wise count rates Data is divided into 100 sec bins |
 |
|
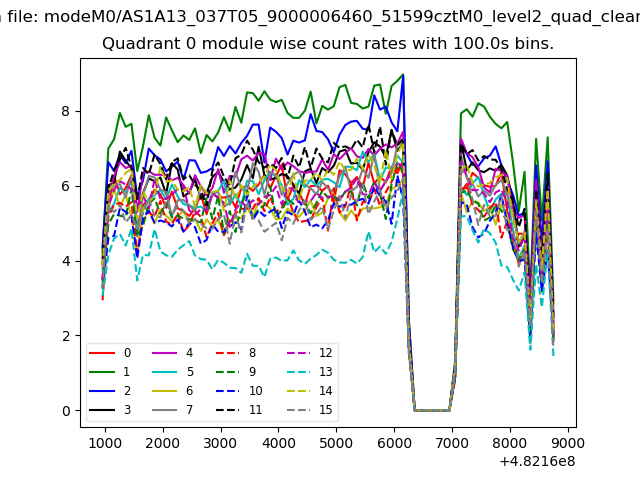
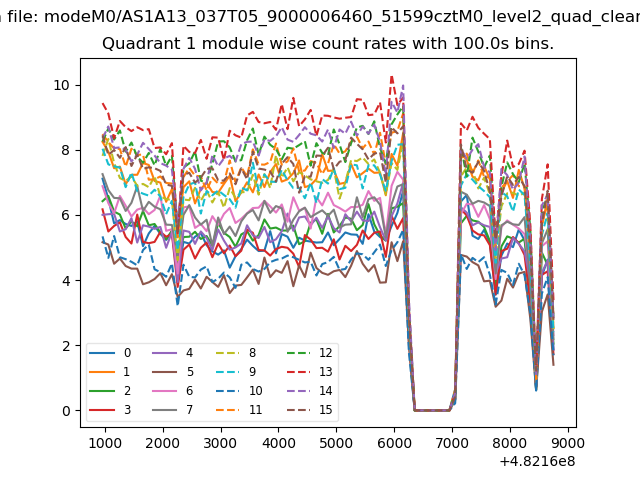
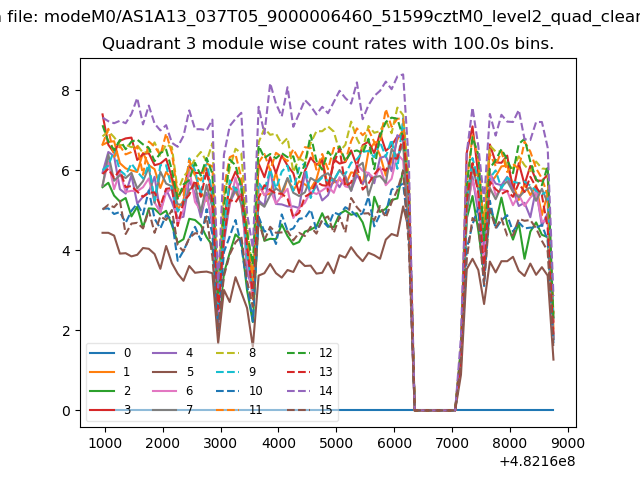
| Module-wise count rates for Quadrant A Data is divided into 100 sec bins |
 |
 |
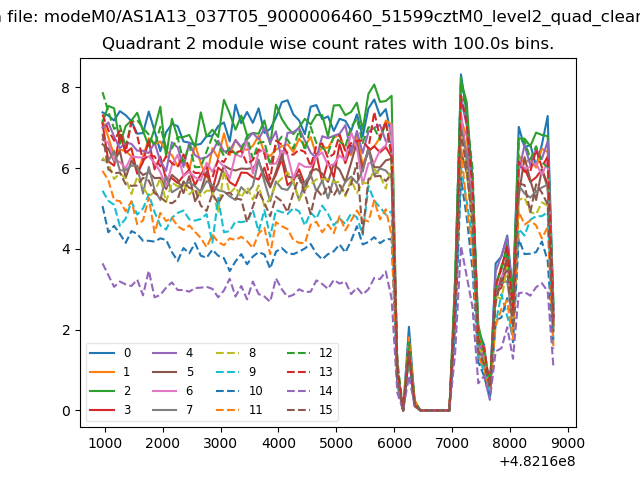
| Module-wise count rates for Quadrant B Data is divided into 100 sec bins |
 |
 |
| Module-wise count rates for Quadrant C Data is divided into 100 sec bins |
 |
 |
| Module-wise count rates for Quadrant D Data is divided into 100 sec bins |
 |
 |
| Parameter | Plot |
|---|---|
| CZT HV Monitor | 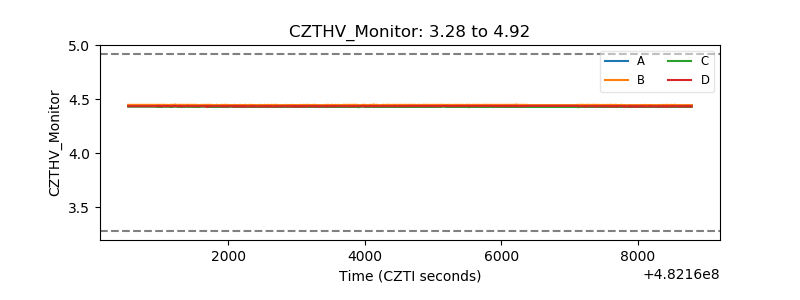 |
| D_VDD | 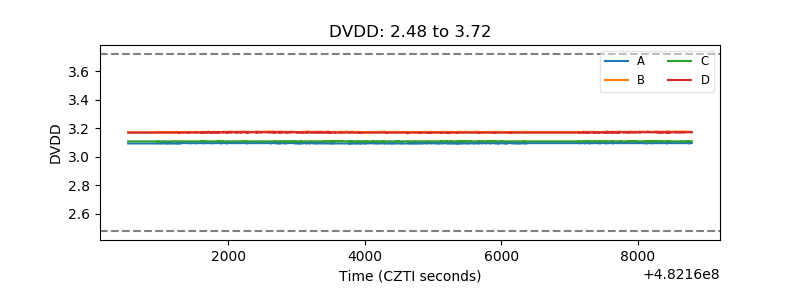 |
| Temperature 1 | 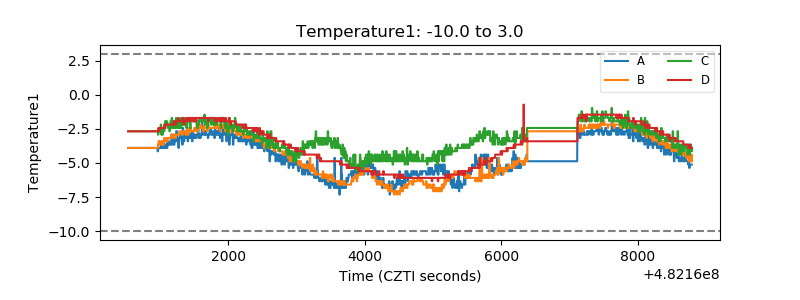 |
| Veto HV Monitor | 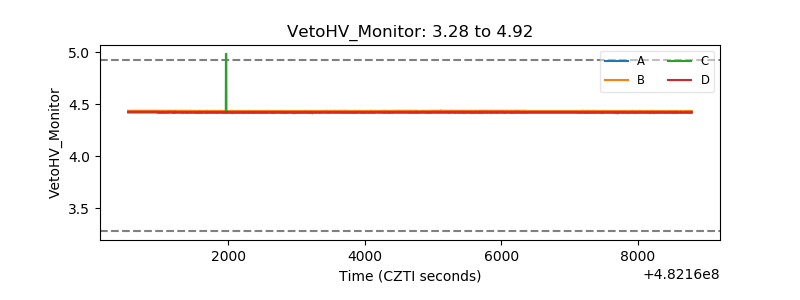 |
| Veto LLD | 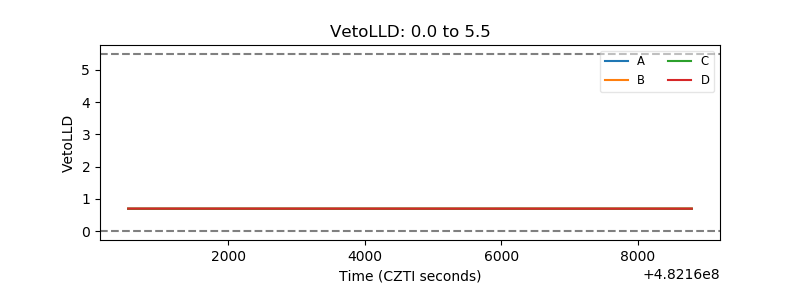 |
| Alpha Counter | 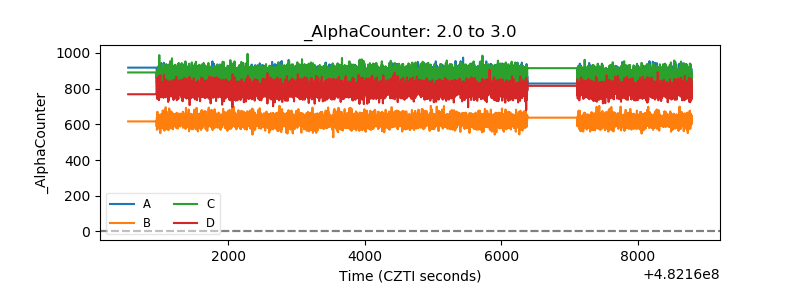 |
| _CPM_Rate | 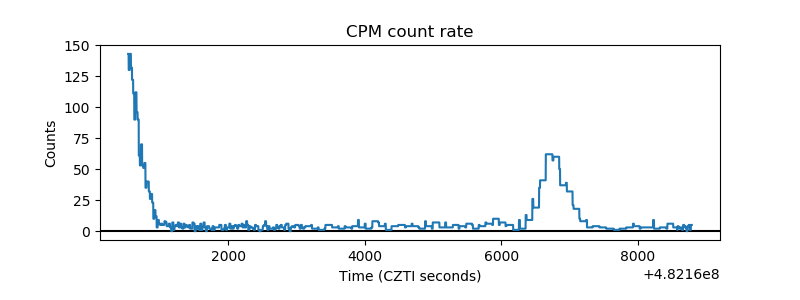 |
| CZT Counter | 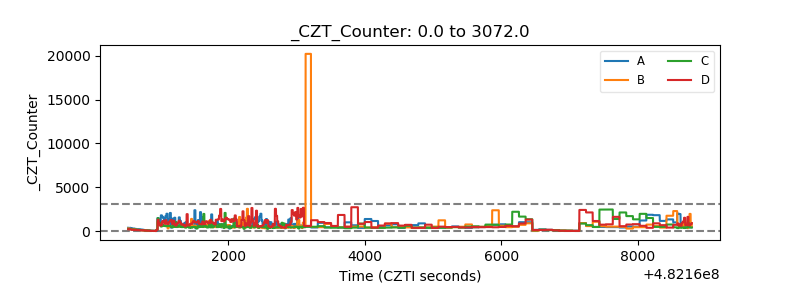 |
| +2.5 Volts monitor | 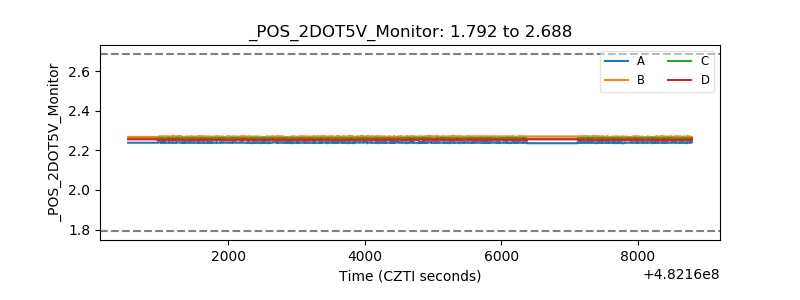 |
| +5 Volts monitor | 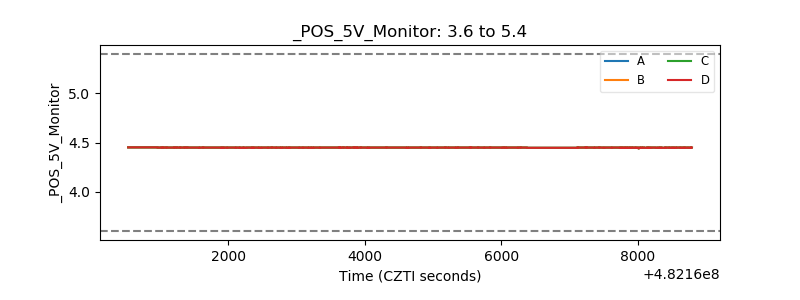 |
| _ROLL_ROT | 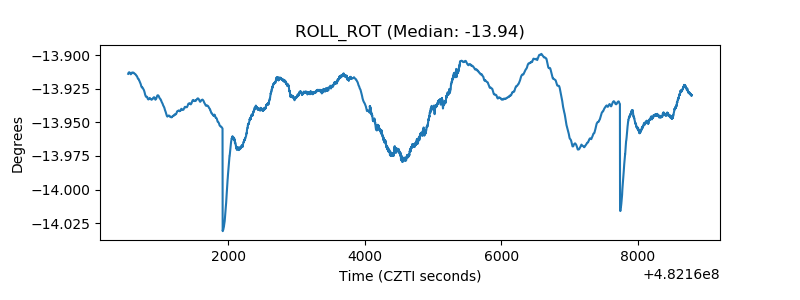 |
| _Roll_DEC | 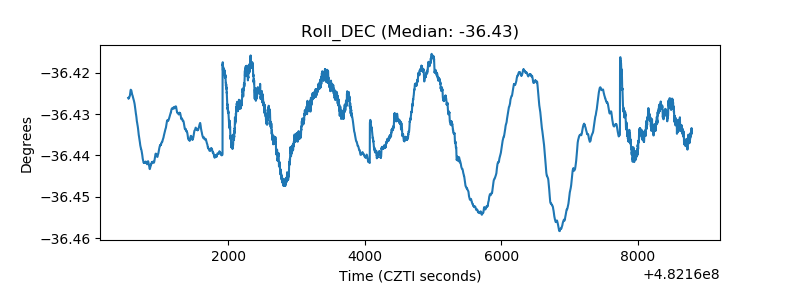 |
| _Roll_RA | 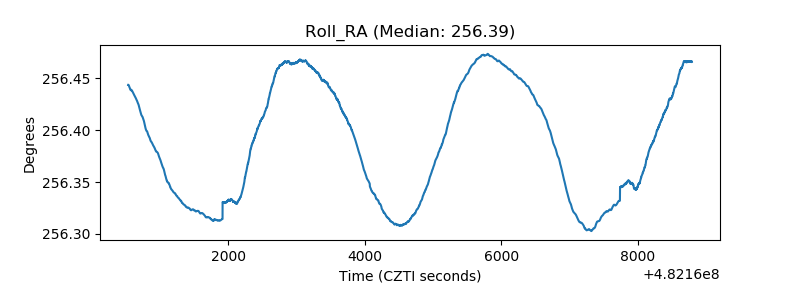 |
| Veto Counter | 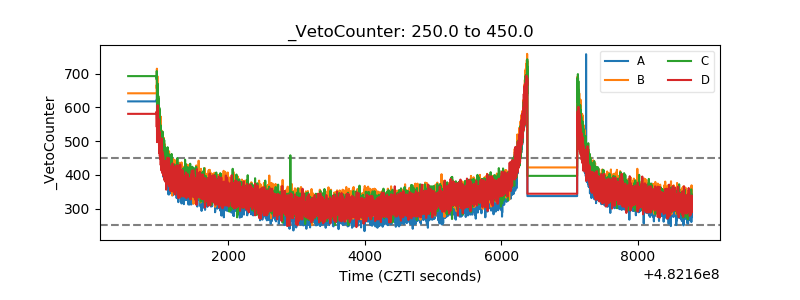 |