| Param | Original file | Final file |
|---|---|---|
| Filename | modeM0/AS1A13_037T05_9000006460_51600cztM0_level2.fits | modeM0/AS1A13_037T05_9000006460_51600cztM0_level2_quad_clean.evt |
| Size (bytes) | 568,661,760 | 97,401,600 |
| Size | 542.3 MB | 92.9 MB |
| Events in quadrant A | 5,989,905 | 594,191 |
| Events in quadrant B | 4,694,873 | 675,361 |
| Events in quadrant C | 4,532,706 | 621,082 |
| Events in quadrant D | 5,290,307 | 572,678 |
| Mode M9 | |||
|---|---|---|---|
| Quadrant | BADHDUFLAG | Total packets | Discarded packets |
| A | 0 | 1 | 0 |
| B | 0 | 1 | 0 |
| C | 0 | 1 | 0 |
| D | 0 | 1 | 0 |
| Mode M0 | |||
|---|---|---|---|
| Quadrant | BADHDUFLAG | Total packets | Discarded packets |
| A | 0 | 22624 | 1 |
| B | 0 | 18650 | 1 |
| C | 0 | 18511 | 1 |
| D | 0 | 20531 | 1 |
| Mode SS | |||
|---|---|---|---|
| Quadrant | BADHDUFLAG | Total packets | Discarded packets |
| A | 0 | 140 | 0 |
| B | 0 | 140 | 0 |
| C | 0 | 140 | 0 |
| D | 0 | 140 | 0 |
| Quadrant | Total seconds | Saturated seconds | Saturation percentage |
|---|---|---|---|
| A | 6981 | 1032 | 14.782982% |
| B | 6981 | 644 | 9.225039% |
| C | 6981 | 466 | 6.675261% |
| D | 6980 | 560 | 8.022923% |
Noise dominated data is calculated using 1-second bins in cleaned event files. If a bin has >2000 counts, and if more than 50% of those come from <1% of pixels, then it is considered to be noise-dominated and hence unusable.
| Quadrant | # 1 sec bins | Bins with >0 counts | Bins with >2000 counts | High rate bins dominated by noise | Noise dominated (total time) | Noise dominated (detector-on time) | Marked lightcurve |
|---|---|---|---|---|---|---|---|
| A | 6996 | 6982 | 495 | 495 | 7.08% | 7.09% | 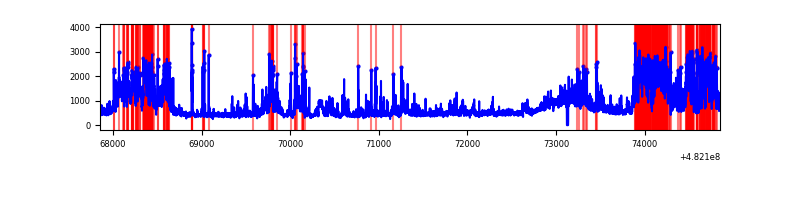 |
| B | 6996 | 6982 | 203 | 203 | 2.90% | 2.91% | 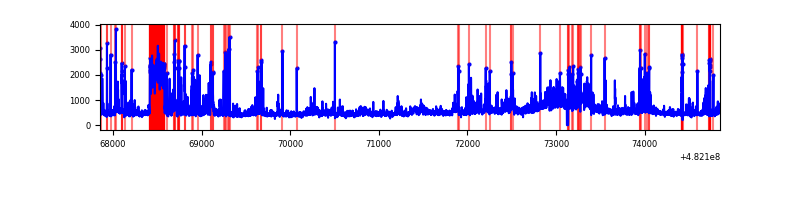 |
| C | 6996 | 6982 | 325 | 325 | 4.65% | 4.65% | 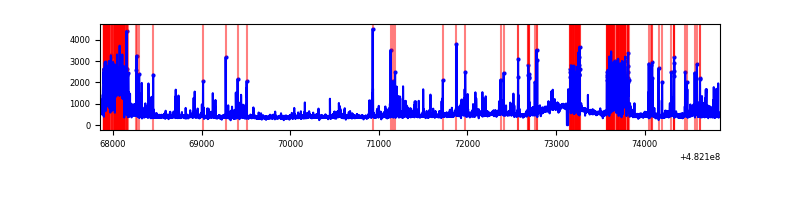 |
| D | 6995 | 6981 | 486 | 486 | 6.95% | 6.96% | 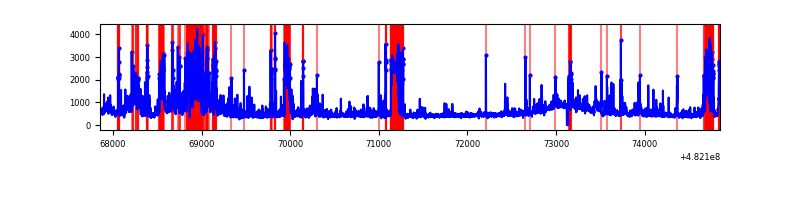 |
Top three noisy pixels from each quadrant. If the there are fewer than three noisy pixels in the level2.evt file, extra rows are filled as -1
| Pixel properties | Quadrant properties | ||||||
|---|---|---|---|---|---|---|---|
| Quadrant | DetID | PixID | Counts | Sigma | Mean | Median | Sigma |
| A | 12 | 250 | 1325855 | 7065.94 | 765 | 746 | 187.5 |
| A | 4 | 175 | 731021 | 3894.08 | 765 | 746 | 187.5 |
| A | 8 | 10 | 327904 | 1744.52 | 765 | 746 | 187.5 |
| B | 5 | 172 | 375991 | 2270.46 | 770 | 744 | 165.3 |
| B | 4 | 174 | 323049 | 1950.13 | 770 | 744 | 165.3 |
| B | 10 | 44 | 163008 | 981.79 | 770 | 744 | 165.3 |
| C | 13 | 3 | 941613 | 4621.0 | 748 | 744 | 203.6 |
| C | 10 | 19 | 292929 | 1435.04 | 748 | 744 | 203.6 |
| C | 1 | 243 | 136234 | 665.45 | 748 | 744 | 203.6 |
| D | 12 | 6 | 643944 | 3110.91 | 743 | 719 | 206.8 |
| D | 5 | 113 | 639499 | 3089.41 | 743 | 719 | 206.8 |
| D | 8 | 176 | 337547 | 1629.04 | 743 | 719 | 206.8 |
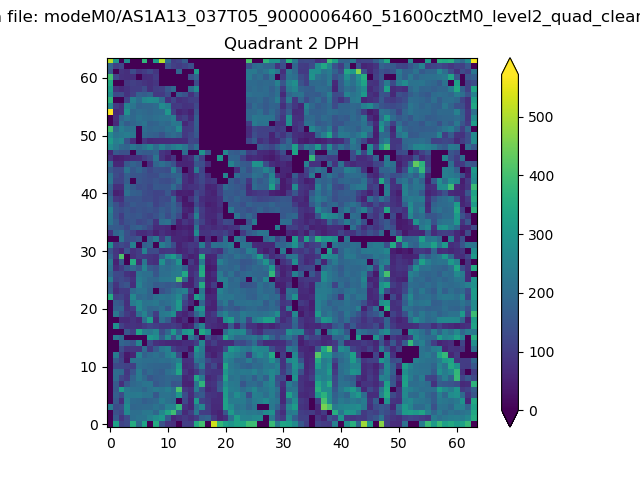
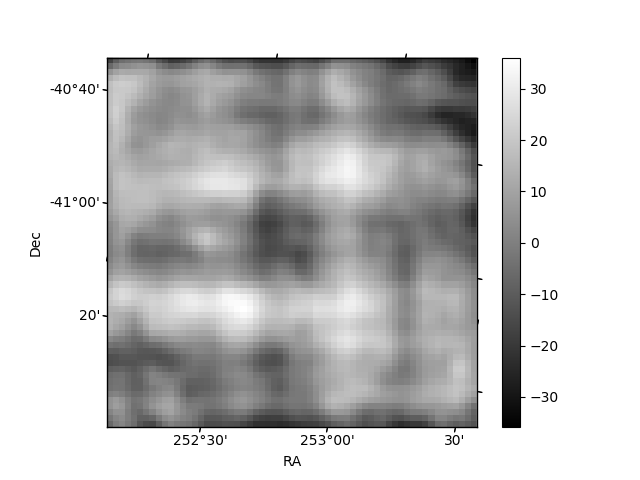
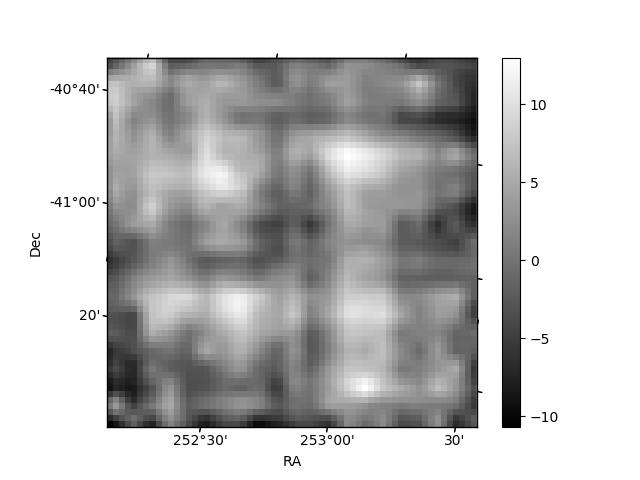
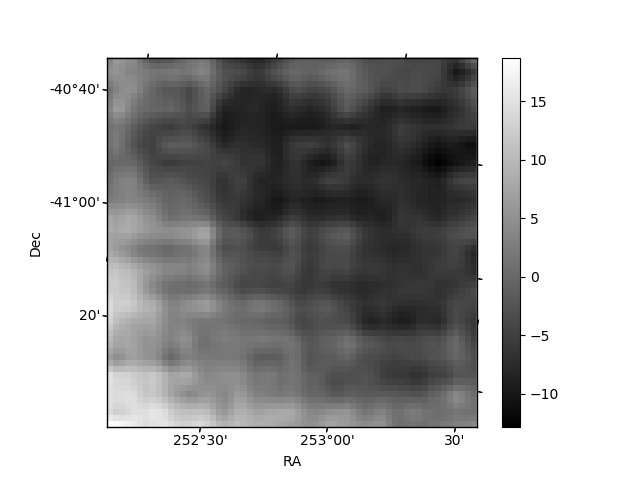
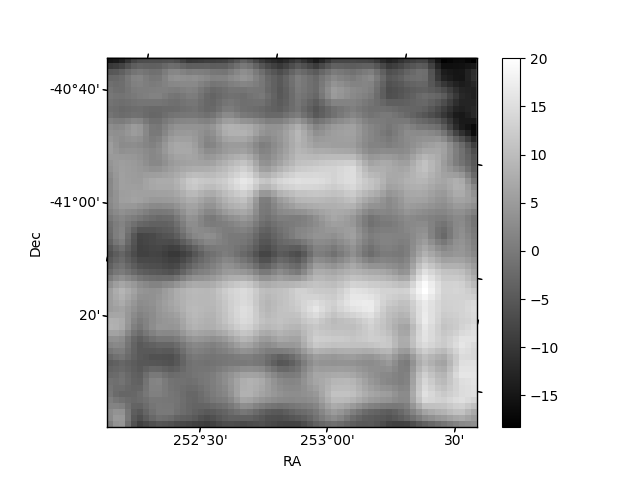
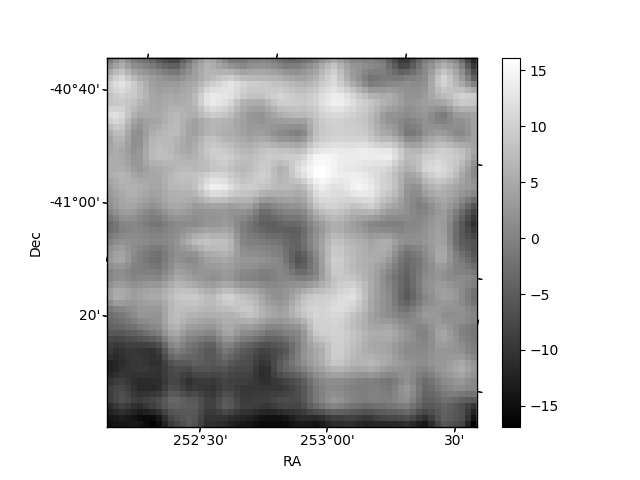
Histogram calculated using DETX and DETY for each event in the final _common_clean file
| Quadrant A | 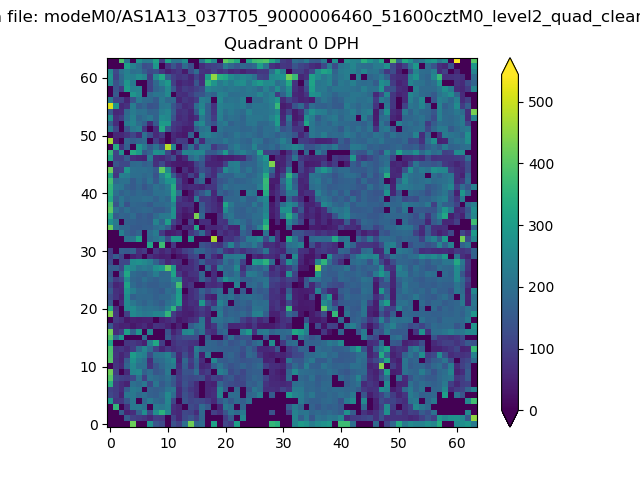 |
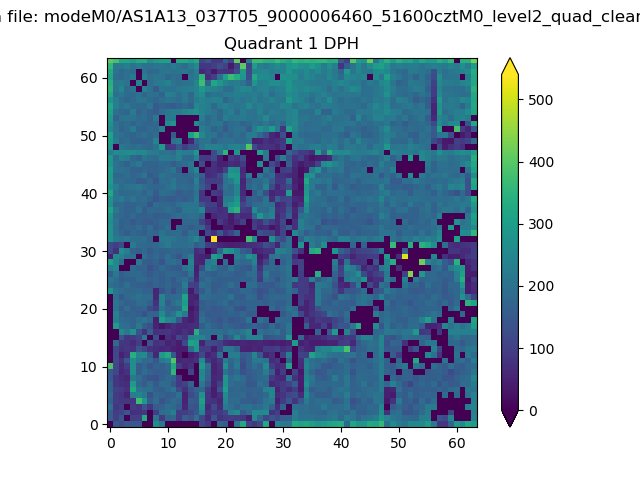 |
Quadrant B |
|---|---|---|---|
| Quadrant D | 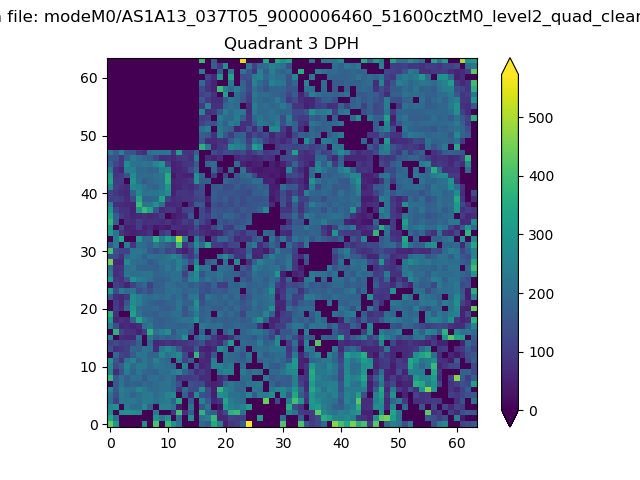 |
 |
Quadrant C |
| Plot type | Count rate plots | Images |
|---|---|---|
| Comparison with Poisson distribution Blue bars denote a histogram of data divided into 1 sec bins. Red curve is a Poisson curve with rate = median count rate of data. |
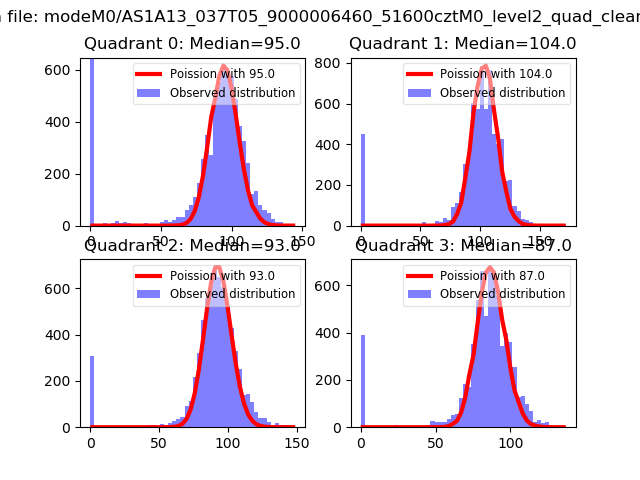 |
 |
| Quadrant-wise count rates Data is divided into 100 sec bins |
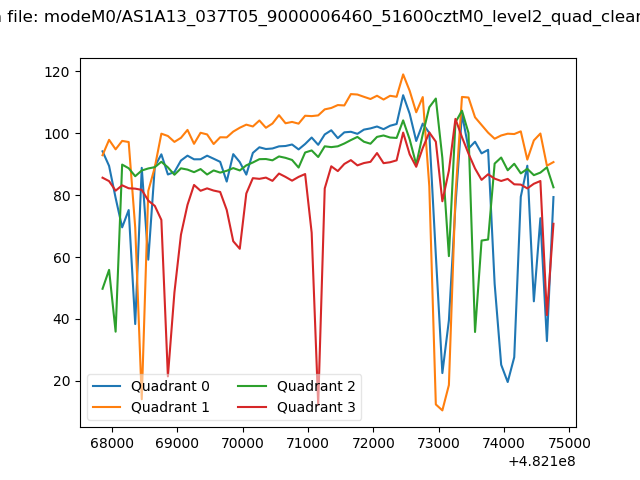 |
|
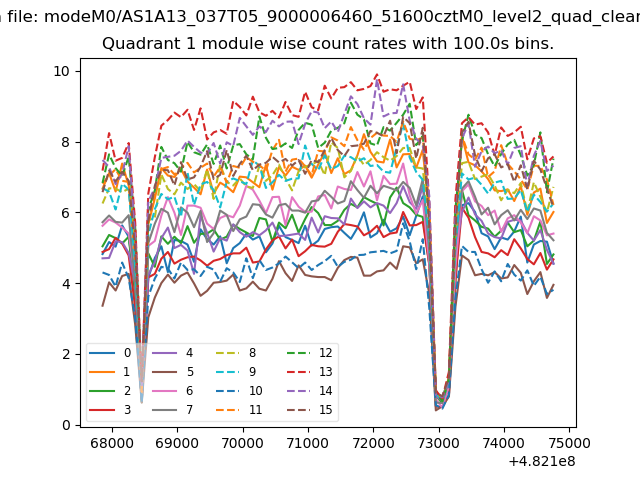
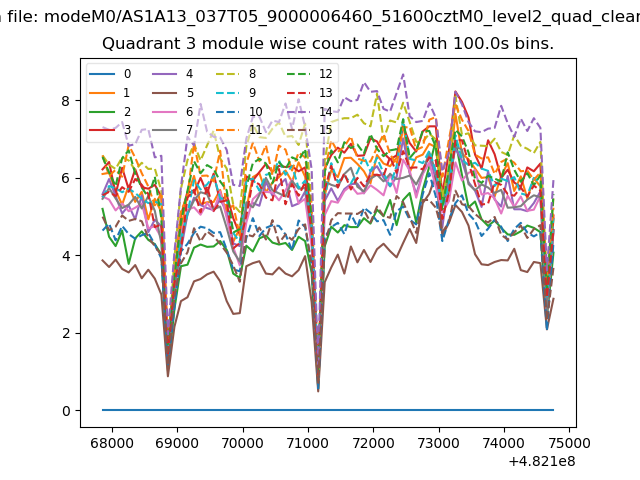
| Module-wise count rates for Quadrant A Data is divided into 100 sec bins |
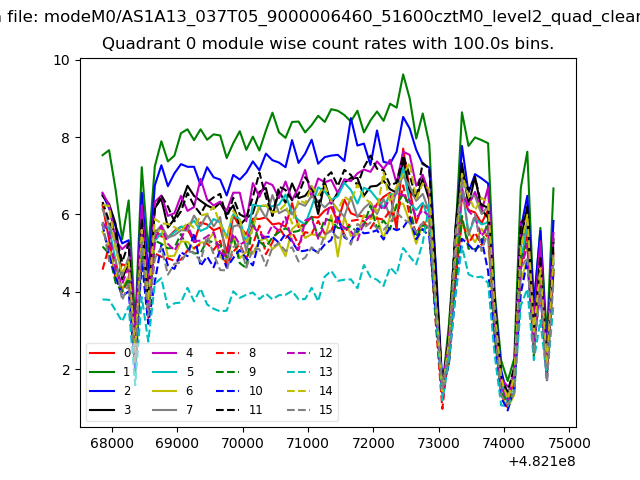 |
 |
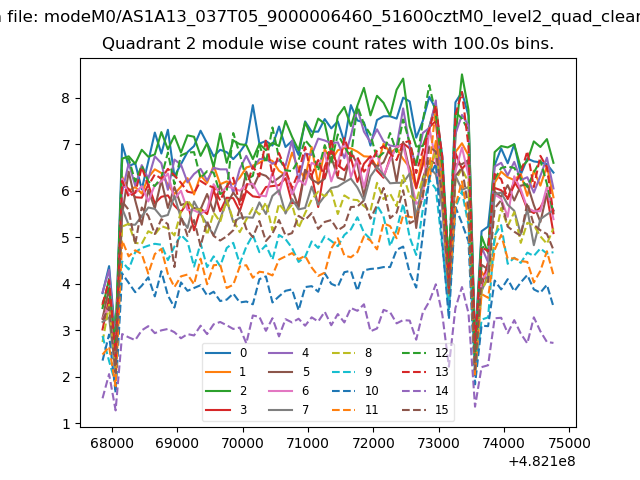
| Module-wise count rates for Quadrant B Data is divided into 100 sec bins |
 |
 |
| Module-wise count rates for Quadrant C Data is divided into 100 sec bins |
 |
 |
| Module-wise count rates for Quadrant D Data is divided into 100 sec bins |
 |
 |
| Parameter | Plot |
|---|---|
| CZT HV Monitor | 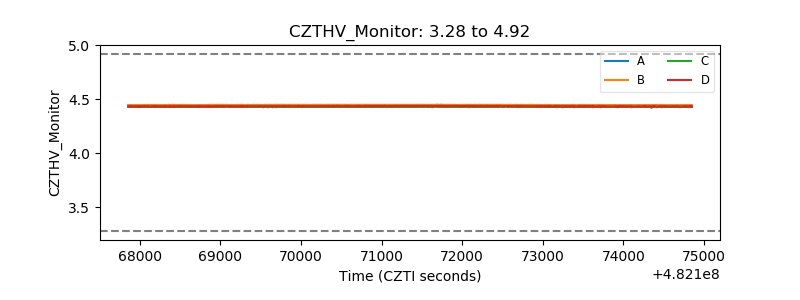 |
| D_VDD | 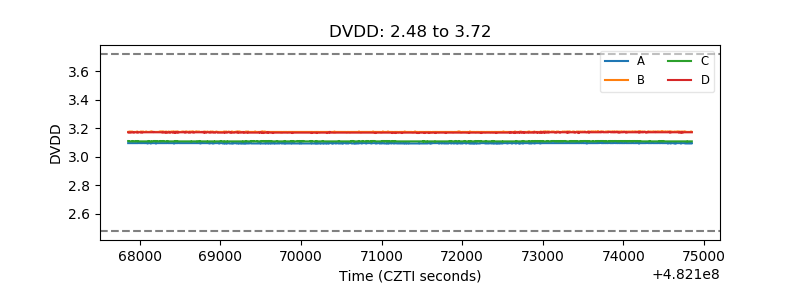 |
| Temperature 1 | 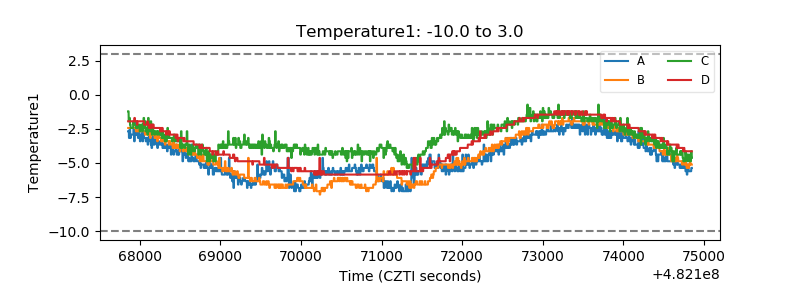 |
| Veto HV Monitor | 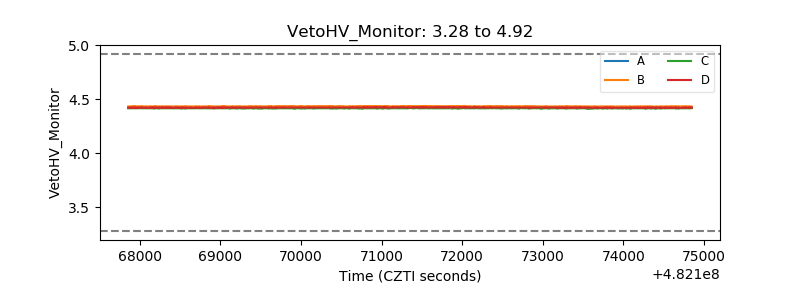 |
| Veto LLD | 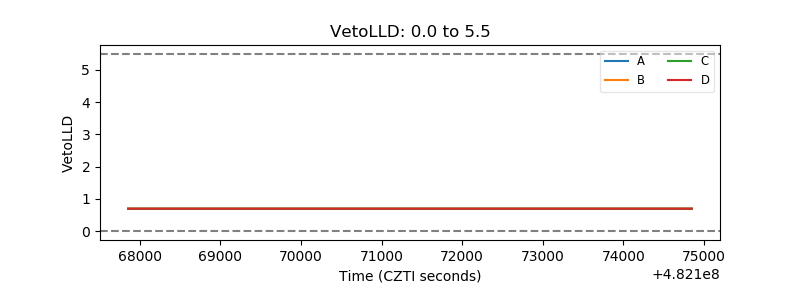 |
| Alpha Counter | 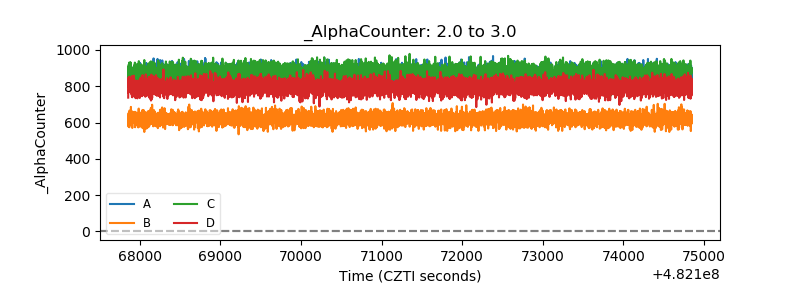 |
| _CPM_Rate | 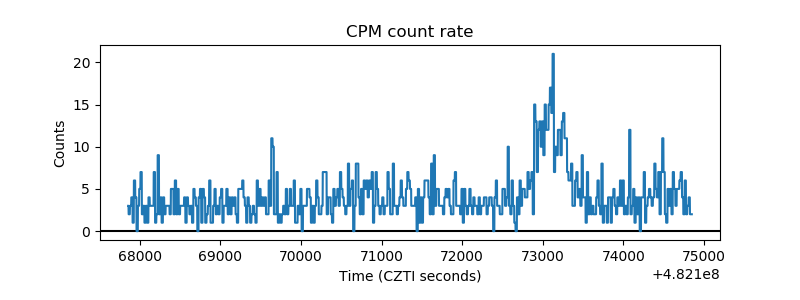 |
| CZT Counter | 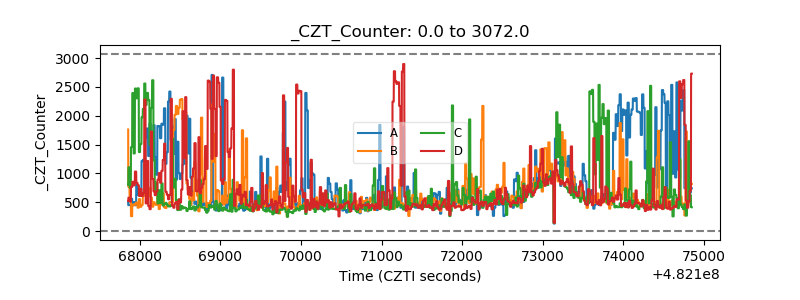 |
| +2.5 Volts monitor |  |
| +5 Volts monitor | 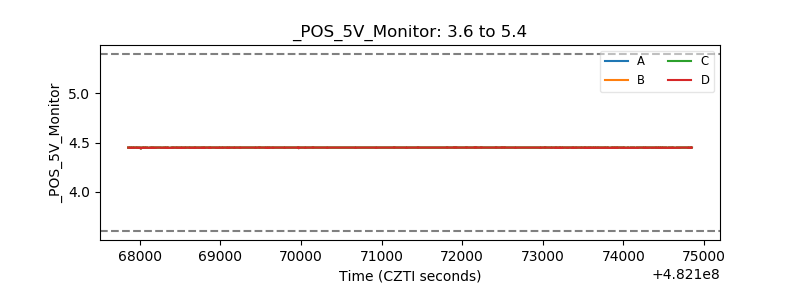 |
| _ROLL_ROT | 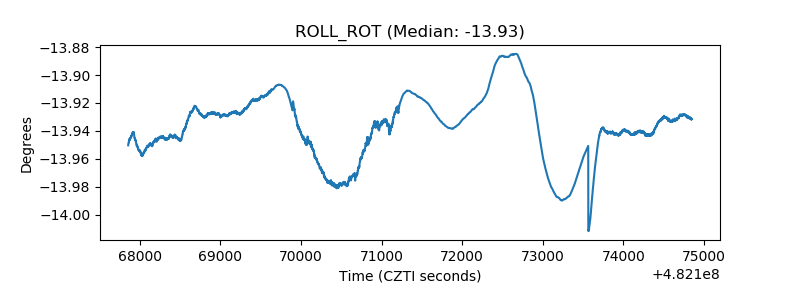 |
| _Roll_DEC | 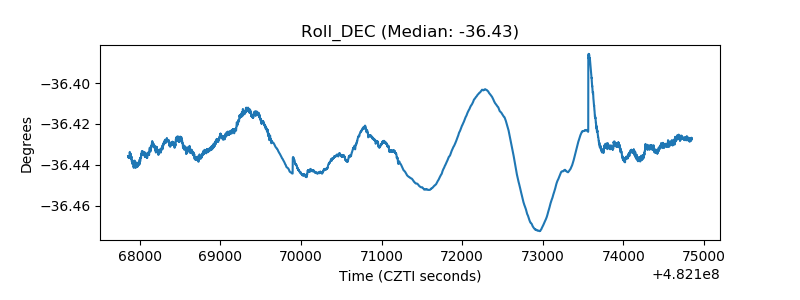 |
| _Roll_RA | 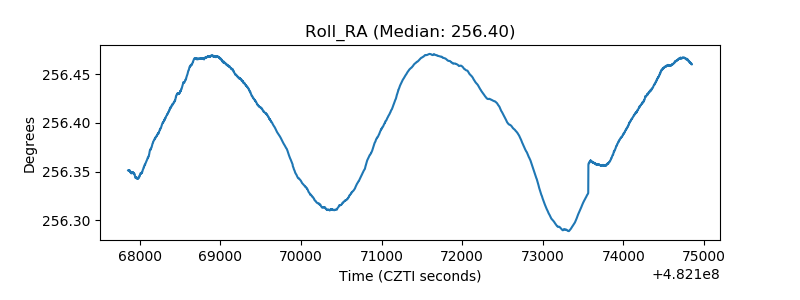 |
| Veto Counter | 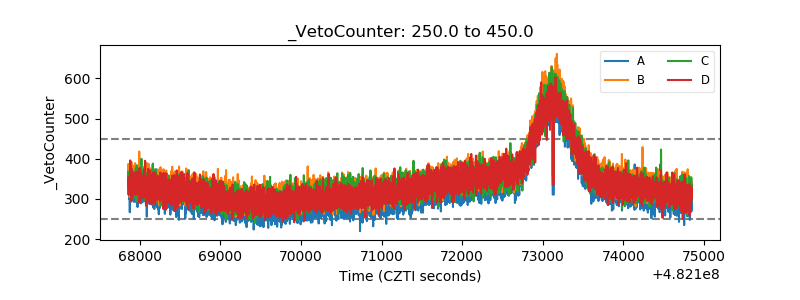 |