| Param | Original file | Final file |
|---|---|---|
| Filename | modeM0/AS1A13_037T05_9000006460_51609cztM0_level2.fits | modeM0/AS1A13_037T05_9000006460_51609cztM0_level2_quad_clean.evt |
| Size (bytes) | 1,857,651,840 | 299,995,200 |
| Size | 1.7 GB | 286.1 MB |
| Events in quadrant A | 19,060,379 | 1,961,447 |
| Events in quadrant B | 13,689,829 | 2,199,308 |
| Events in quadrant C | 17,262,991 | 1,667,798 |
| Events in quadrant D | 17,089,037 | 1,771,098 |
| Mode M9 | |||
|---|---|---|---|
| Quadrant | BADHDUFLAG | Total packets | Discarded packets |
| A | 0 | 33 | 0 |
| B | 0 | 33 | 0 |
| C | 0 | 33 | 0 |
| D | 0 | 33 | 0 |
| Mode M0 | |||
|---|---|---|---|
| Quadrant | BADHDUFLAG | Total packets | Discarded packets |
| A | 0 | 71848 | 4 |
| B | 0 | 55152 | 4 |
| C | 0 | 66718 | 4 |
| D | 0 | 66001 | 4 |
| Mode SS | |||
|---|---|---|---|
| Quadrant | BADHDUFLAG | Total packets | Discarded packets |
| A | 0 | 440 | 0 |
| B | 0 | 440 | 0 |
| C | 0 | 440 | 0 |
| D | 0 | 440 | 0 |
| Quadrant | Total seconds | Saturated seconds | Saturation percentage |
|---|---|---|---|
| A | 21540 | 1427 | 6.624884% |
| B | 21541 | 706 | 3.277471% |
| C | 21540 | 2937 | 13.635097% |
| D | 21540 | 1573 | 7.302693% |
Noise dominated data is calculated using 1-second bins in cleaned event files. If a bin has >2000 counts, and if more than 50% of those come from <1% of pixels, then it is considered to be noise-dominated and hence unusable.
| Quadrant | # 1 sec bins | Bins with >0 counts | Bins with >2000 counts | High rate bins dominated by noise | Noise dominated (total time) | Noise dominated (detector-on time) | Marked lightcurve |
|---|---|---|---|---|---|---|---|
| A | 24859 | 21540 | 1018 | 1018 | 4.10% | 4.73% | 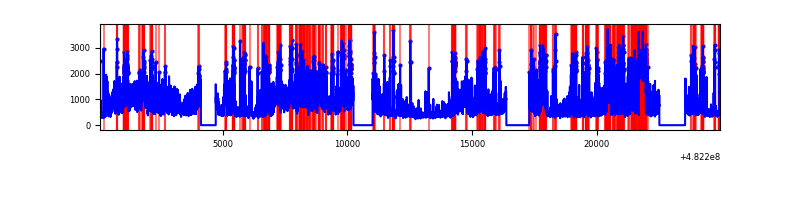 |
| B | 24861 | 21544 | 384 | 384 | 1.54% | 1.78% | 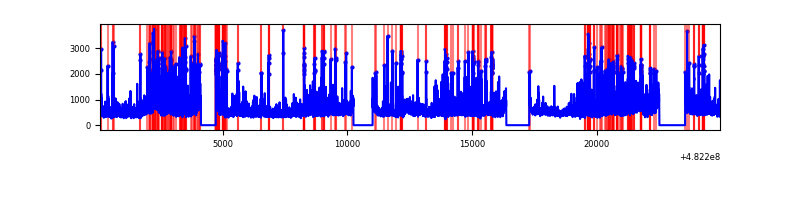 |
| C | 24860 | 21542 | 2416 | 2416 | 9.72% | 11.22% | 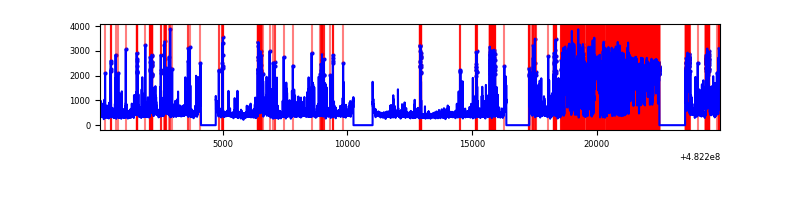 |
| D | 24860 | 21543 | 1372 | 1372 | 5.52% | 6.37% | 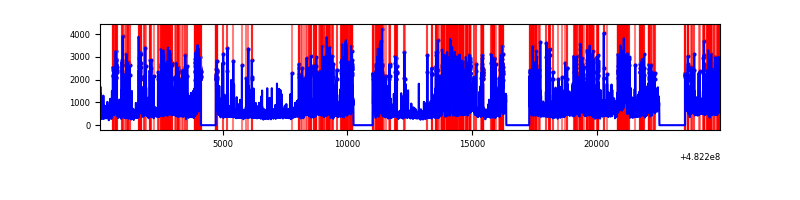 |
Top three noisy pixels from each quadrant. If the there are fewer than three noisy pixels in the level2.evt file, extra rows are filled as -1
| Pixel properties | Quadrant properties | ||||||
|---|---|---|---|---|---|---|---|
| Quadrant | DetID | PixID | Counts | Sigma | Mean | Median | Sigma |
| A | 12 | 3 | 4545879 | 8251.9 | 2280 | 2236 | 550.6 |
| A | 12 | 250 | 898540 | 1627.81 | 2280 | 2236 | 550.6 |
| A | 4 | 175 | 550752 | 996.18 | 2280 | 2236 | 550.6 |
| B | 10 | 44 | 938657 | 1923.09 | 2289 | 2211 | 486.9 |
| B | 5 | 172 | 667206 | 1365.64 | 2289 | 2211 | 486.9 |
| B | 4 | 174 | 656001 | 1342.63 | 2289 | 2211 | 486.9 |
| C | 13 | 3 | 7186893 | 12480.47 | 2088 | 2065 | 575.7 |
| C | 15 | 198 | 486083 | 840.77 | 2088 | 2065 | 575.7 |
| C | 0 | 209 | 397821 | 687.45 | 2088 | 2065 | 575.7 |
| D | 8 | 176 | 4375963 | 7159.8 | 2201 | 2125 | 610.9 |
| D | 12 | 6 | 637390 | 1039.9 | 2201 | 2125 | 610.9 |
| D | 0 | 18 | 610780 | 996.34 | 2201 | 2125 | 610.9 |
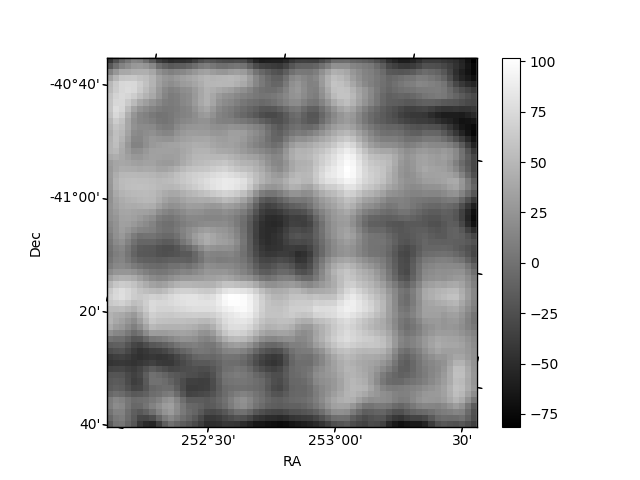
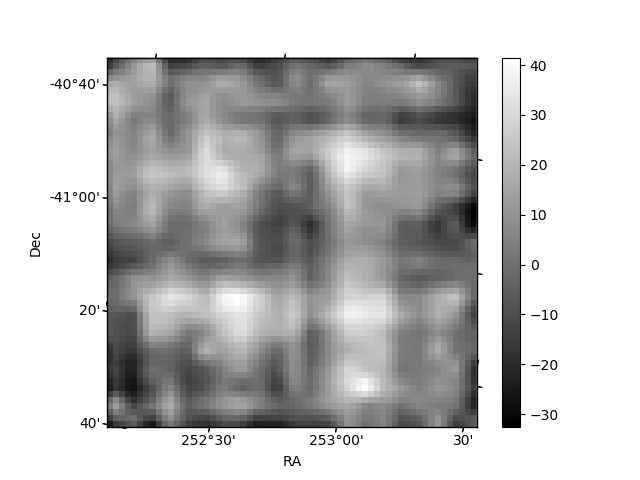
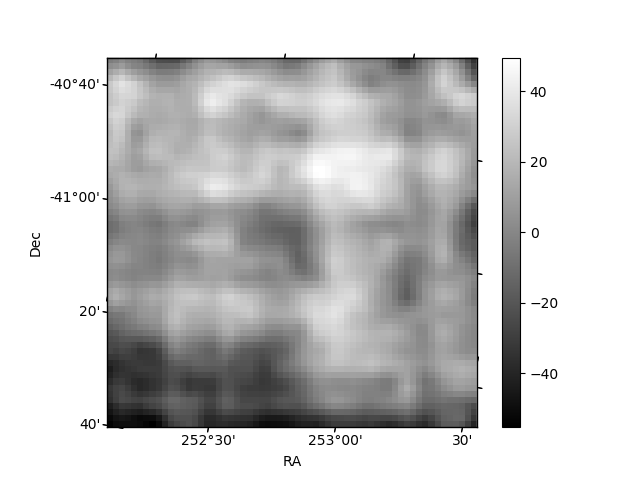
Histogram calculated using DETX and DETY for each event in the final _common_clean file
| Quadrant A | 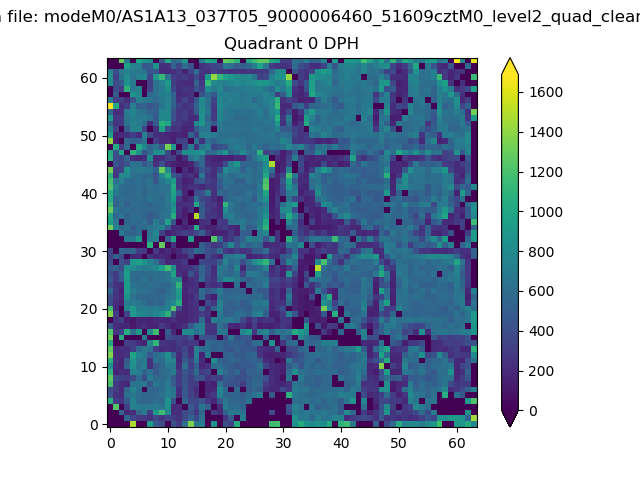 |
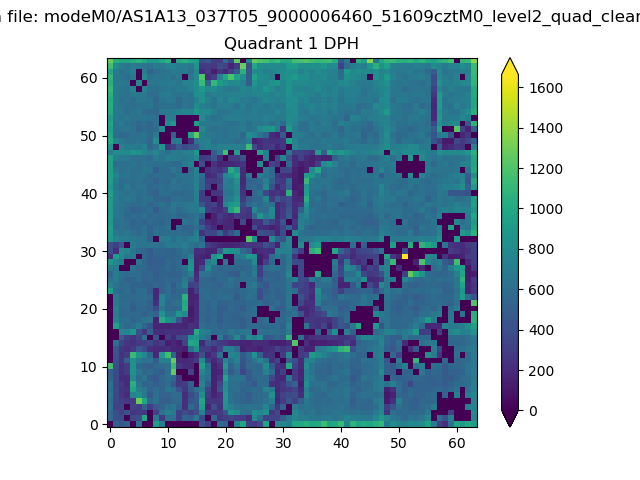 |
Quadrant B |
|---|---|---|---|
| Quadrant D |  |
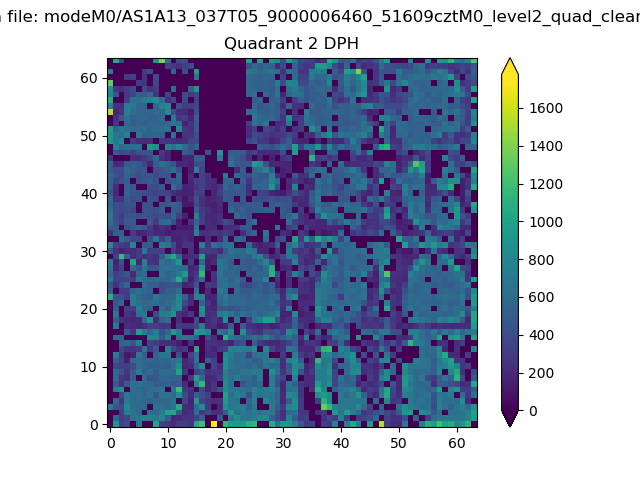 |
Quadrant C |
| Plot type | Count rate plots | Images |
|---|---|---|
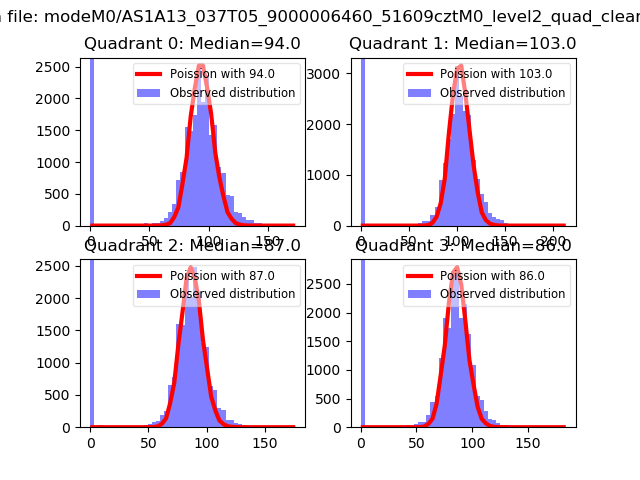
| Comparison with Poisson distribution Blue bars denote a histogram of data divided into 1 sec bins. Red curve is a Poisson curve with rate = median count rate of data. |
 |
 |
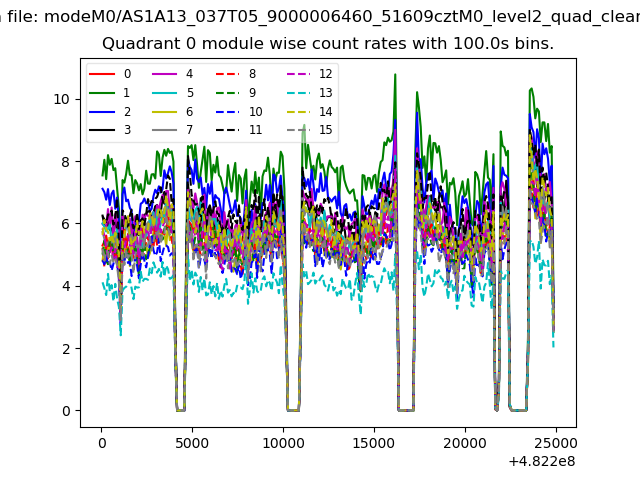
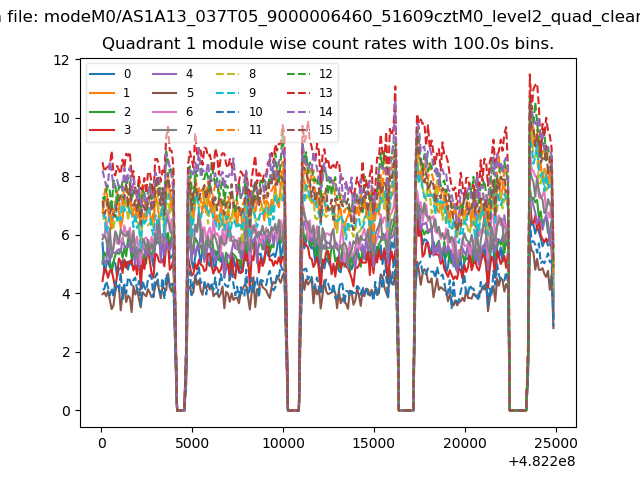
| Quadrant-wise count rates Data is divided into 100 sec bins |
 |
|
| Module-wise count rates for Quadrant A Data is divided into 100 sec bins |
 |
 |
| Module-wise count rates for Quadrant B Data is divided into 100 sec bins |
 |
 |
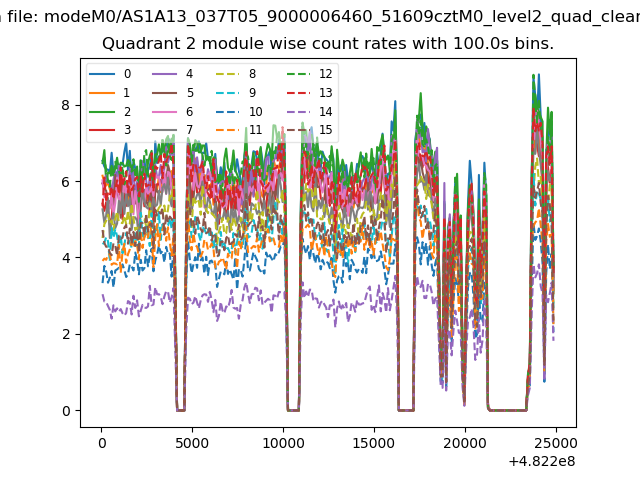
| Module-wise count rates for Quadrant C Data is divided into 100 sec bins |
 |
 |
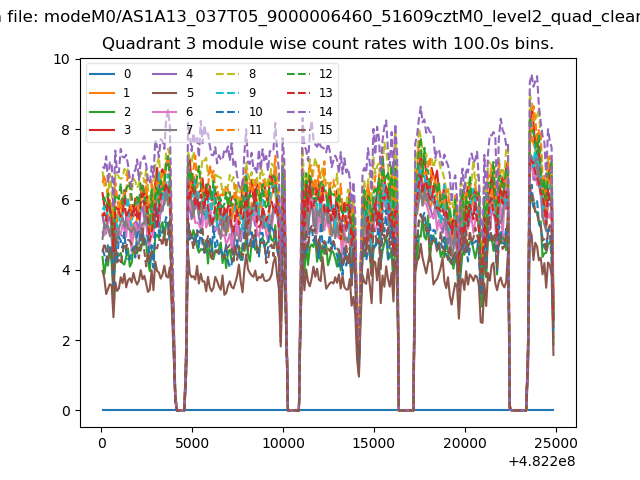
| Module-wise count rates for Quadrant D Data is divided into 100 sec bins |
 |
 |
| Parameter | Plot |
|---|---|
| CZT HV Monitor | 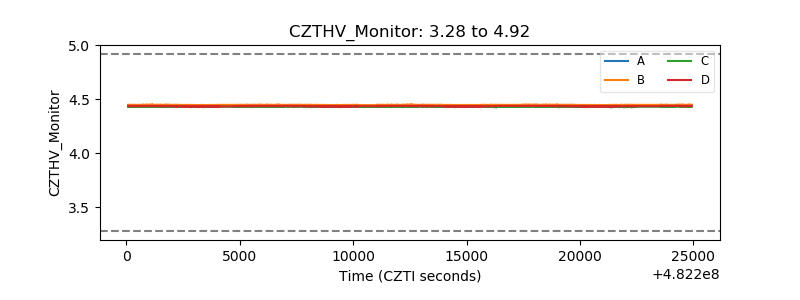 |
| D_VDD | 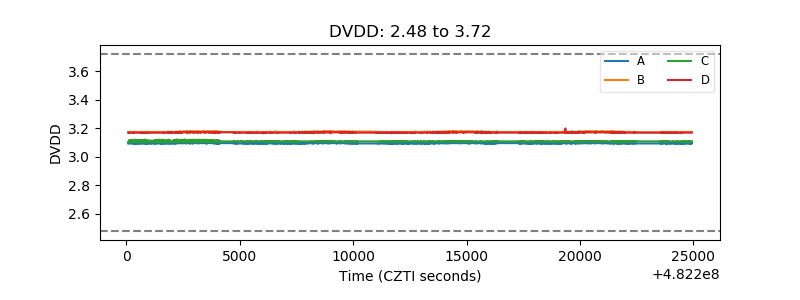 |
| Temperature 1 | 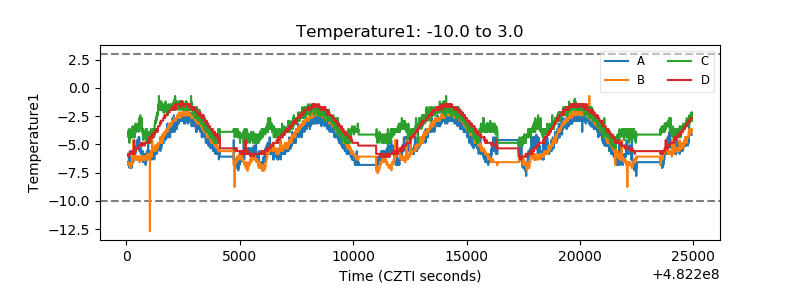 |
| Veto HV Monitor | 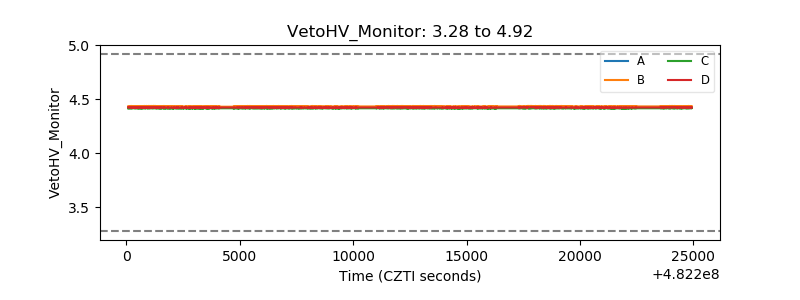 |
| Veto LLD | 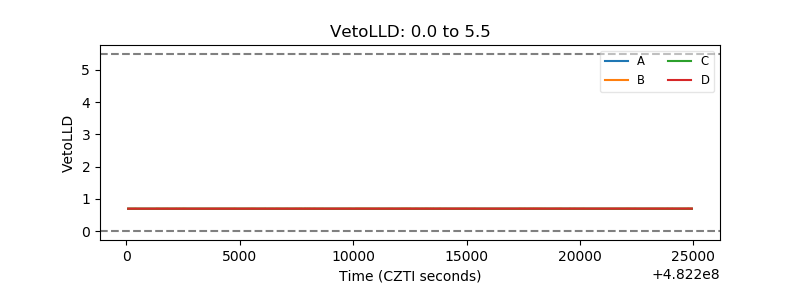 |
| Alpha Counter | 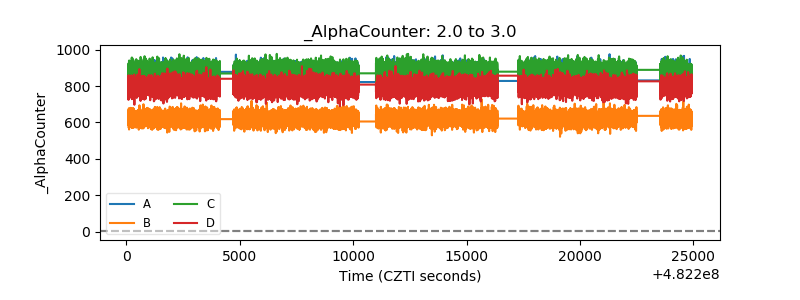 |
| _CPM_Rate | 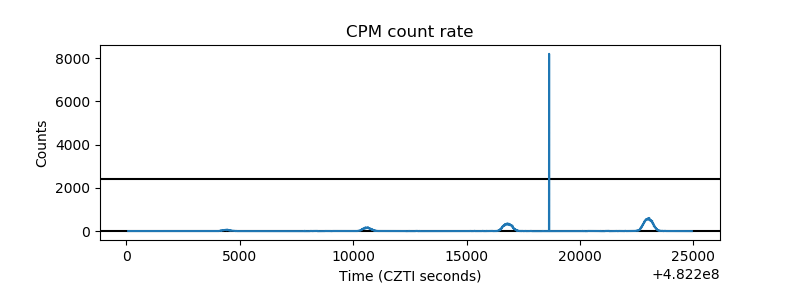 |
| CZT Counter | 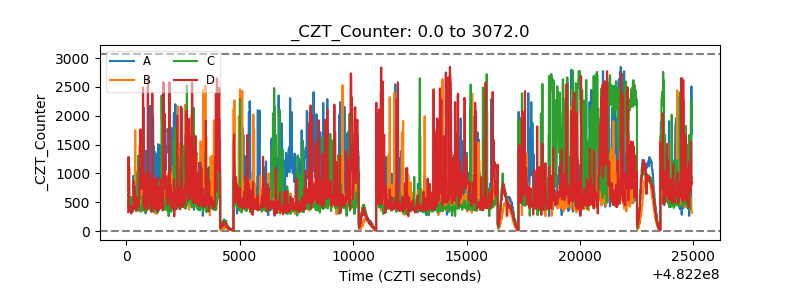 |
| +2.5 Volts monitor | 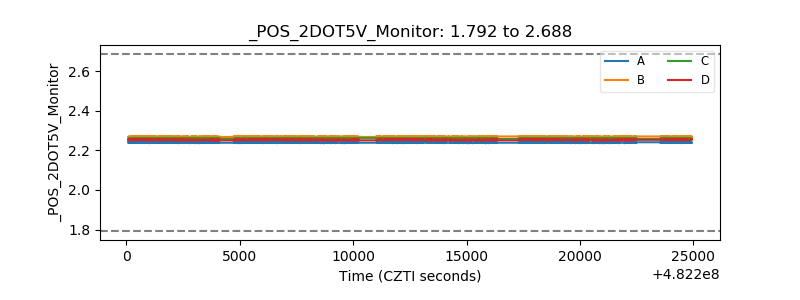 |
| +5 Volts monitor | 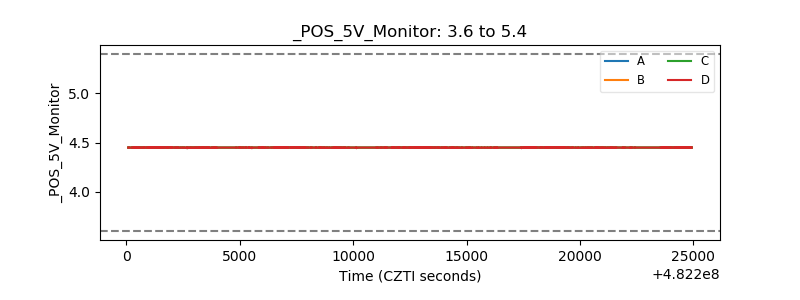 |
| _ROLL_ROT | 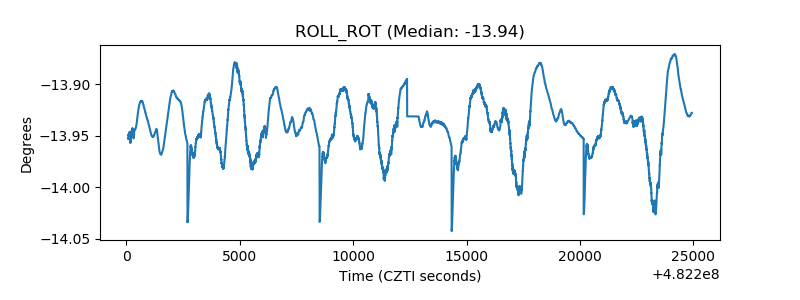 |
| _Roll_DEC | 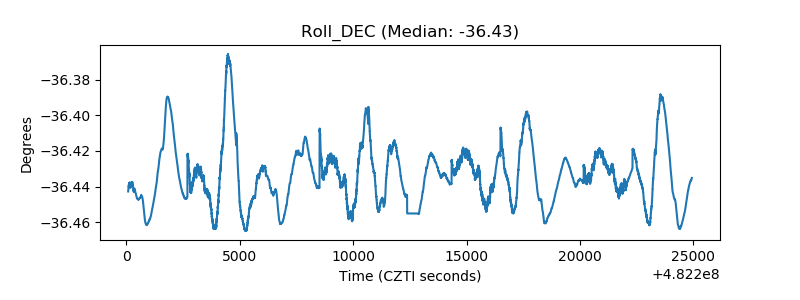 |
| _Roll_RA | 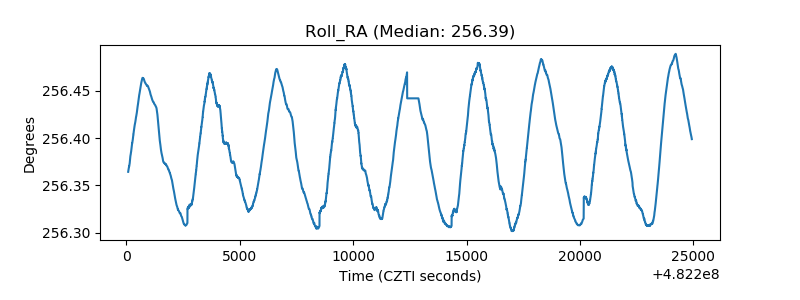 |
| Veto Counter | 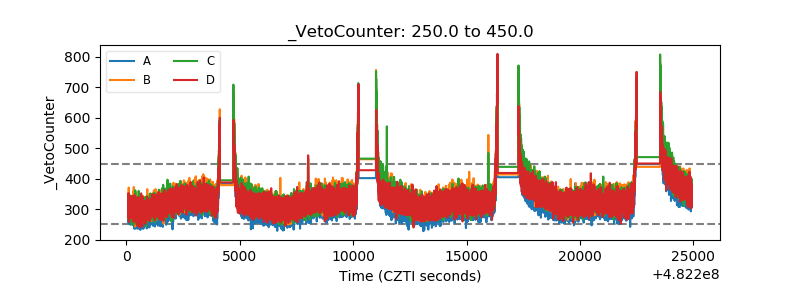 |