| Param | Original file | Final file |
|---|---|---|
| Filename | modeM0/AS1A13_037T05_9000006460_51610cztM0_level2.fits | modeM0/AS1A13_037T05_9000006460_51610cztM0_level2_quad_clean.evt |
| Size (bytes) | 703,857,600 | 79,920,000 |
| Size | 671.3 MB | 76.2 MB |
| Events in quadrant A | 4,763,736 | 560,962 |
| Events in quadrant B | 7,330,927 | 501,527 |
| Events in quadrant C | 5,728,538 | 492,972 |
| Events in quadrant D | 7,768,571 | 447,316 |
| Mode M9 | |||
|---|---|---|---|
| Quadrant | BADHDUFLAG | Total packets | Discarded packets |
| A | 0 | 11 | 0 |
| B | 0 | 11 | 0 |
| C | 0 | 11 | 0 |
| D | 0 | 11 | 0 |
| Mode M0 | |||
|---|---|---|---|
| Quadrant | BADHDUFLAG | Total packets | Discarded packets |
| A | 0 | 18193 | 2 |
| B | 0 | 25805 | 1 |
| C | 0 | 21195 | 1 |
| D | 0 | 27264 | 1 |
| Mode SS | |||
|---|---|---|---|
| Quadrant | BADHDUFLAG | Total packets | Discarded packets |
| A | 0 | 120 | 0 |
| B | 0 | 120 | 0 |
| C | 0 | 120 | 0 |
| D | 0 | 120 | 0 |
| Quadrant | Total seconds | Saturated seconds | Saturation percentage |
|---|---|---|---|
| A | 5974 | 525 | 8.788082% |
| B | 5974 | 1690 | 28.289253% |
| C | 5974 | 1088 | 18.212253% |
| D | 5974 | 1300 | 21.760964% |
Noise dominated data is calculated using 1-second bins in cleaned event files. If a bin has >2000 counts, and if more than 50% of those come from <1% of pixels, then it is considered to be noise-dominated and hence unusable.
| Quadrant | # 1 sec bins | Bins with >0 counts | Bins with >2000 counts | High rate bins dominated by noise | Noise dominated (total time) | Noise dominated (detector-on time) | Marked lightcurve |
|---|---|---|---|---|---|---|---|
| A | 7069 | 5974 | 368 | 368 | 5.21% | 6.16% | 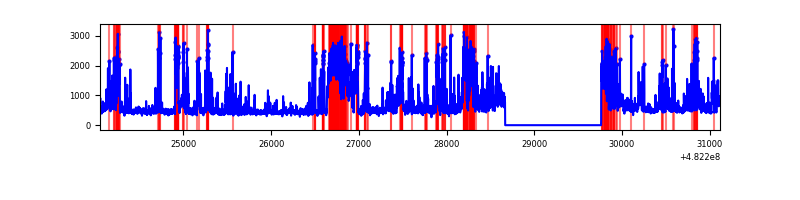 |
| B | 7069 | 5974 | 1404 | 1404 | 19.86% | 23.50% | 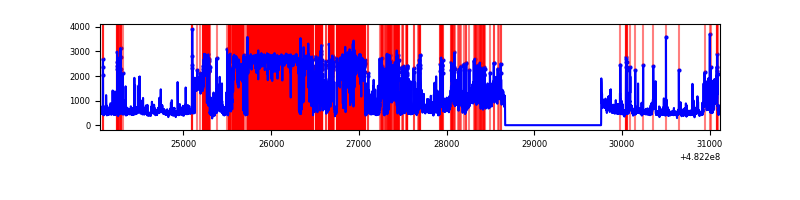 |
| C | 7068 | 5973 | 913 | 913 | 12.92% | 15.29% | 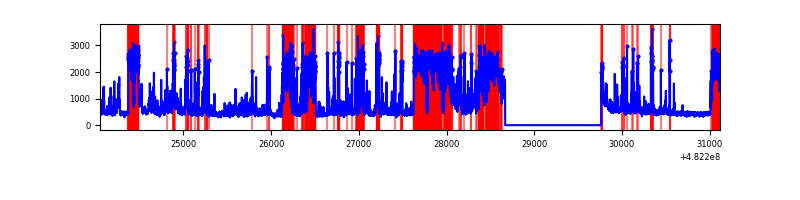 |
| D | 7069 | 5974 | 1206 | 1206 | 17.06% | 20.19% | 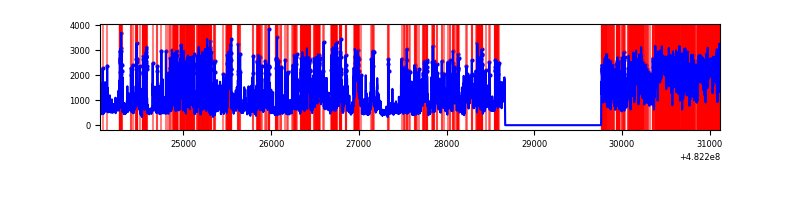 |
Top three noisy pixels from each quadrant. If the there are fewer than three noisy pixels in the level2.evt file, extra rows are filled as -1
| Pixel properties | Quadrant properties | ||||||
|---|---|---|---|---|---|---|---|
| Quadrant | DetID | PixID | Counts | Sigma | Mean | Median | Sigma |
| A | 4 | 175 | 582975 | 3638.08 | 653 | 639 | 160.1 |
| A | 8 | 249 | 491136 | 3064.33 | 653 | 639 | 160.1 |
| A | 15 | 174 | 305286 | 1903.25 | 653 | 639 | 160.1 |
| B | 5 | 172 | 3769208 | 30871.16 | 568 | 547 | 122.1 |
| B | 1 | 223 | 291060 | 2379.75 | 568 | 547 | 122.1 |
| B | 10 | 44 | 257179 | 2102.21 | 568 | 547 | 122.1 |
| C | 13 | 3 | 3020536 | 18511.6 | 593 | 589 | 163.1 |
| C | 12 | 254 | 149818 | 914.74 | 593 | 589 | 163.1 |
| C | 12 | 112 | 58459 | 354.73 | 593 | 589 | 163.1 |
| D | 8 | 176 | 2165028 | 12948.86 | 599 | 578 | 167.2 |
| D | 2 | 62 | 995464 | 5951.92 | 599 | 578 | 167.2 |
| D | 1 | 3 | 817254 | 4885.78 | 599 | 578 | 167.2 |
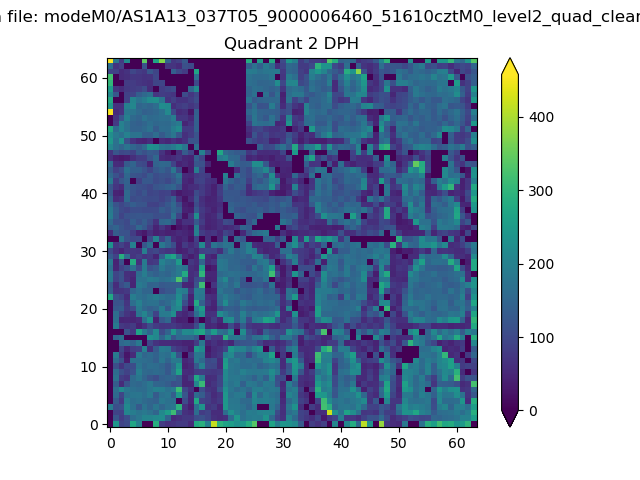
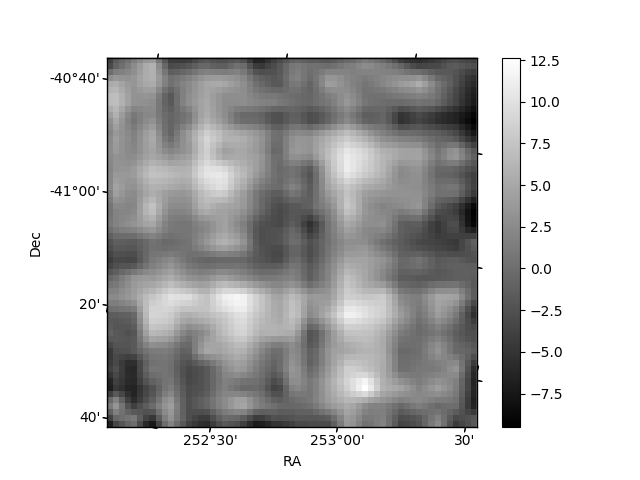
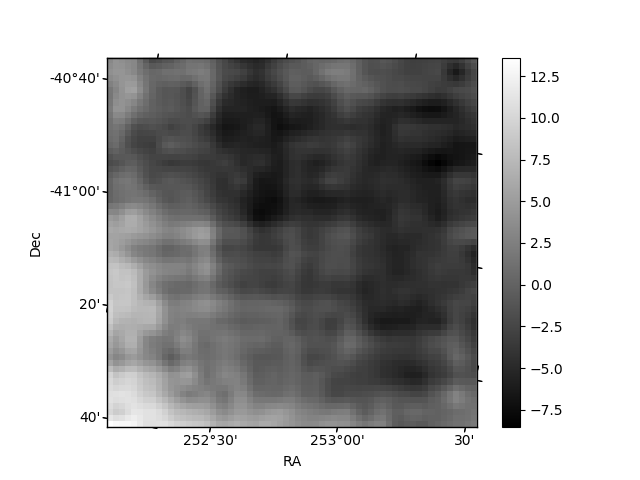
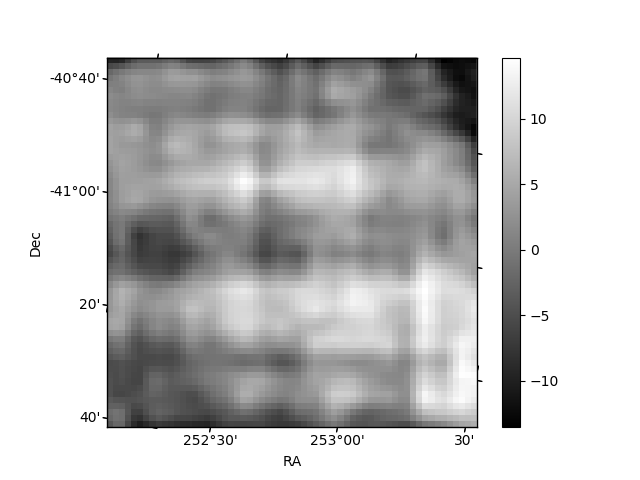
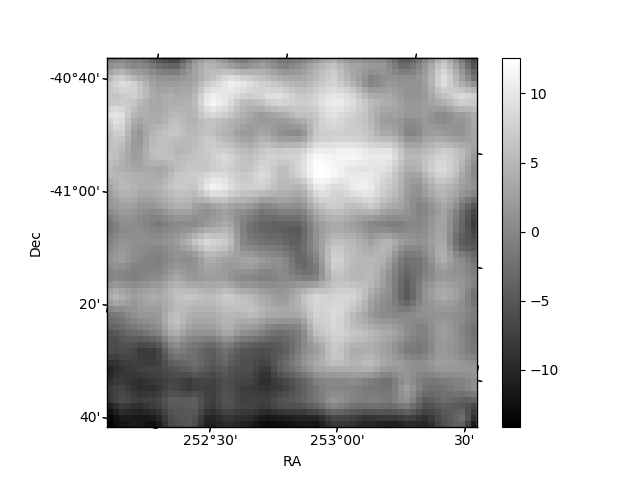
Histogram calculated using DETX and DETY for each event in the final _common_clean file
| Quadrant A | 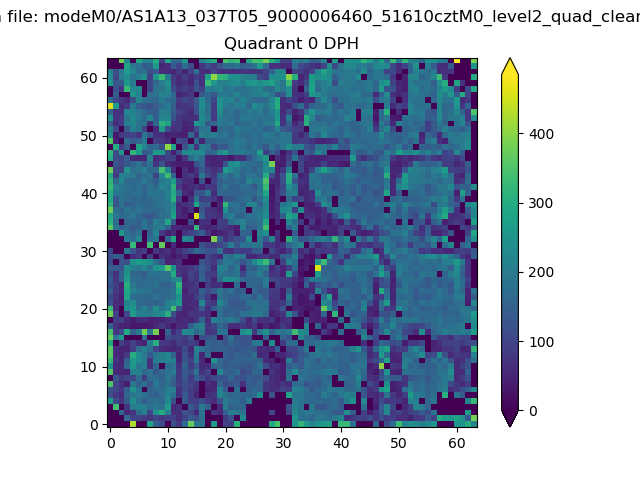 |
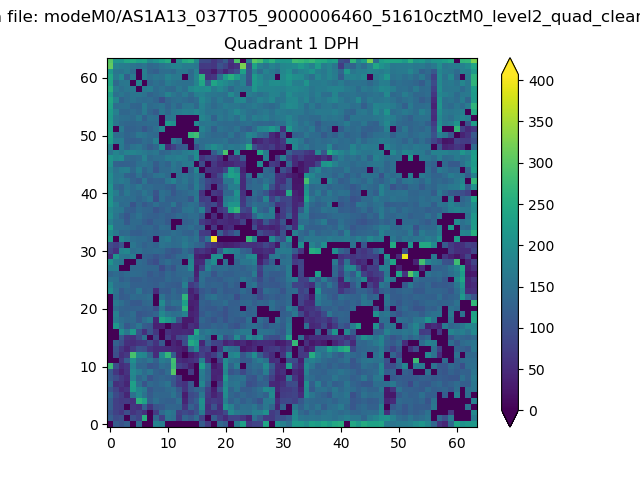 |
Quadrant B |
|---|---|---|---|
| Quadrant D | 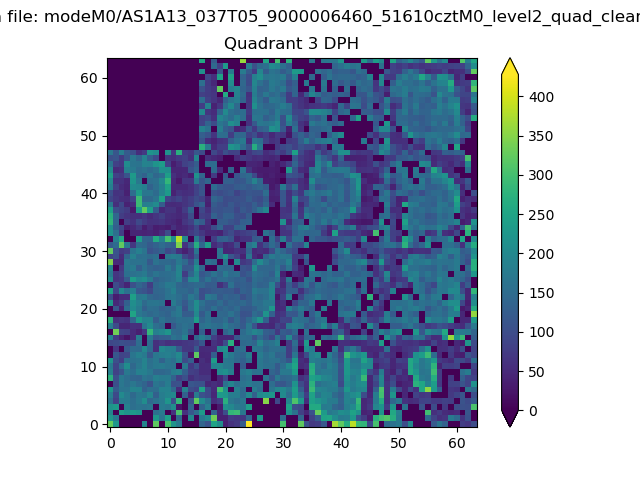 |
 |
Quadrant C |
| Plot type | Count rate plots | Images |
|---|---|---|
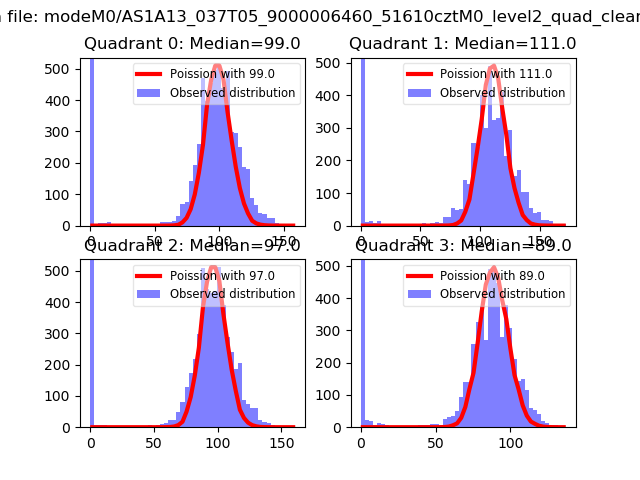
| Comparison with Poisson distribution Blue bars denote a histogram of data divided into 1 sec bins. Red curve is a Poisson curve with rate = median count rate of data. |
 |
 |
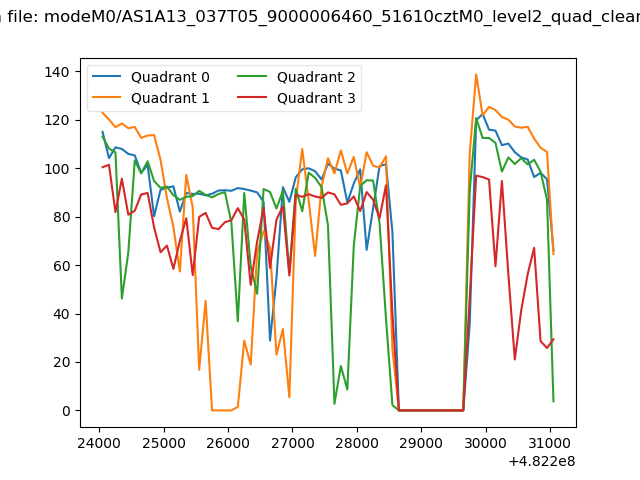
| Quadrant-wise count rates Data is divided into 100 sec bins |
 |
|
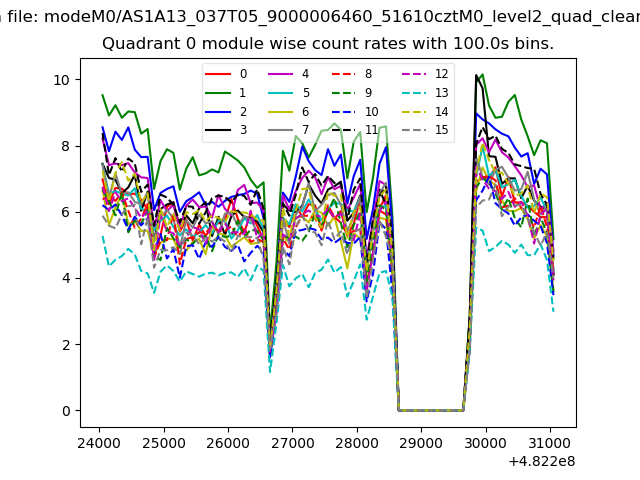
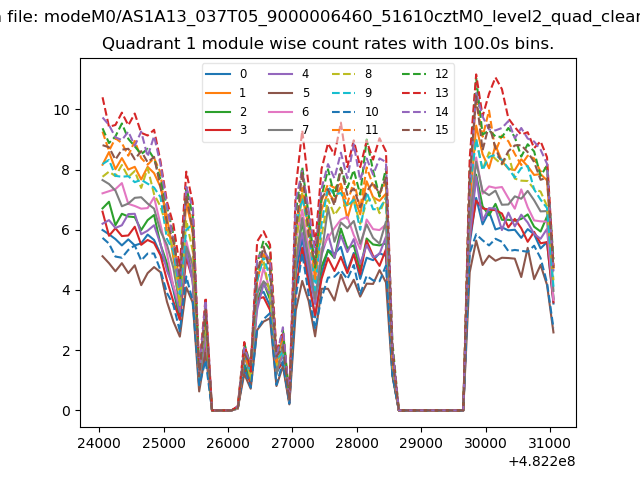
| Module-wise count rates for Quadrant A Data is divided into 100 sec bins |
 |
 |
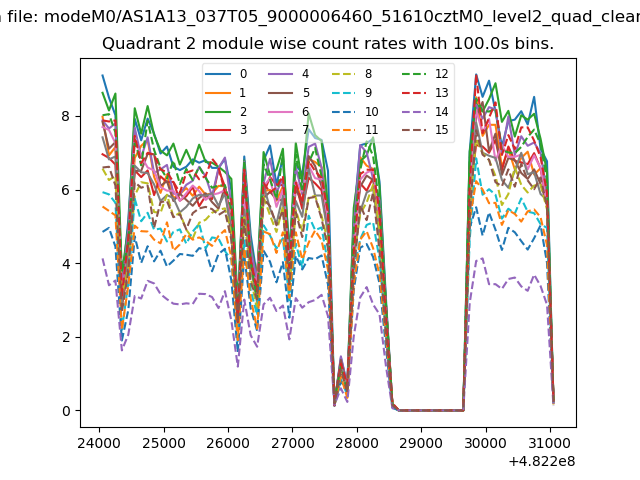
| Module-wise count rates for Quadrant B Data is divided into 100 sec bins |
 |
 |
| Module-wise count rates for Quadrant C Data is divided into 100 sec bins |
 |
 |
| Module-wise count rates for Quadrant D Data is divided into 100 sec bins |
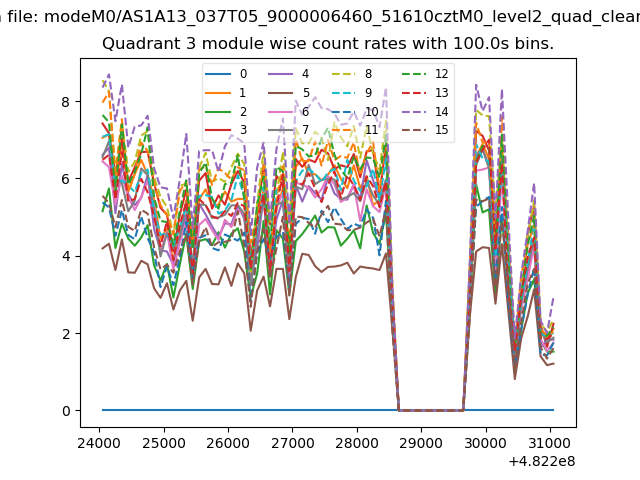 |
 |
| Parameter | Plot |
|---|---|
| CZT HV Monitor | 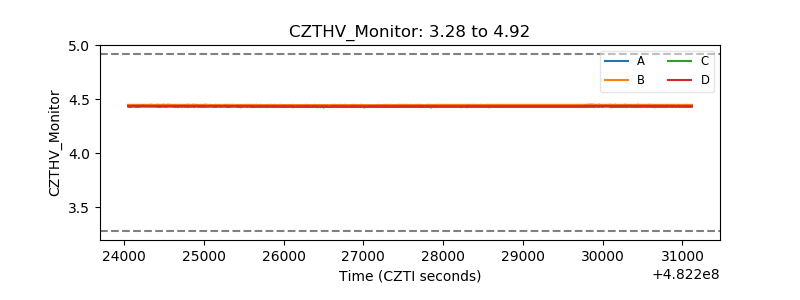 |
| D_VDD | 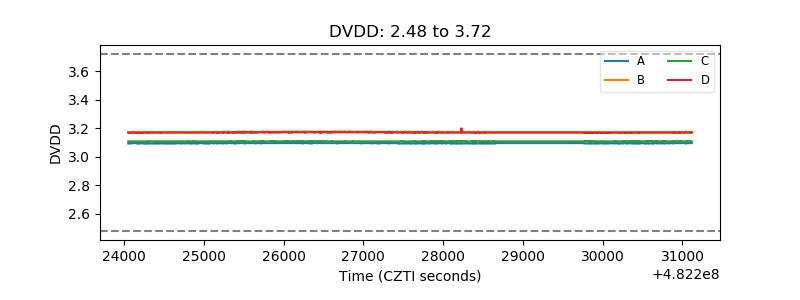 |
| Temperature 1 | 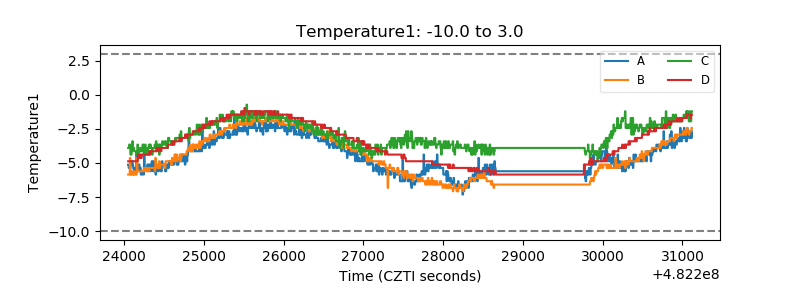 |
| Veto HV Monitor | 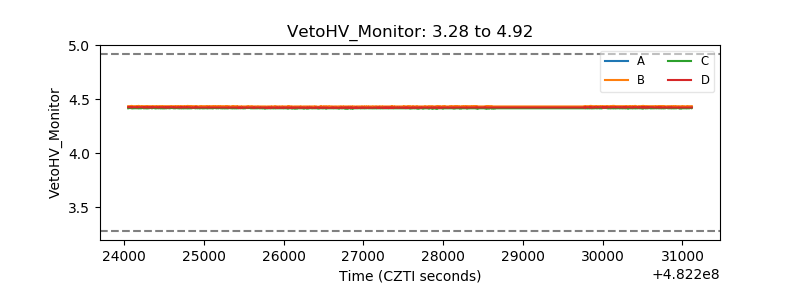 |
| Veto LLD | 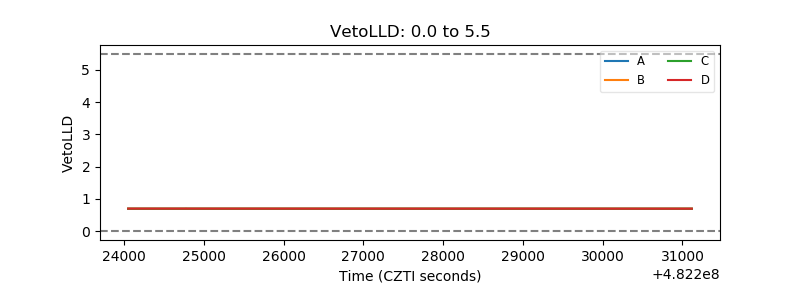 |
| Alpha Counter | 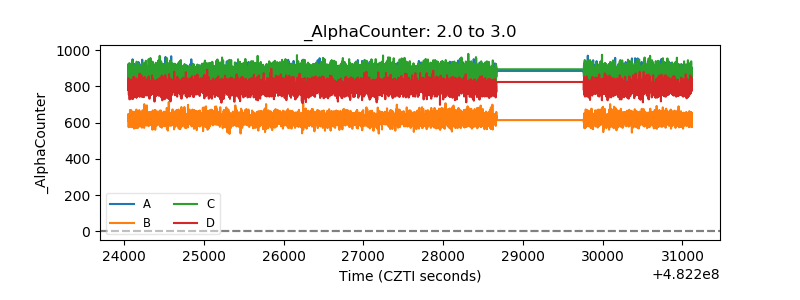 |
| _CPM_Rate | 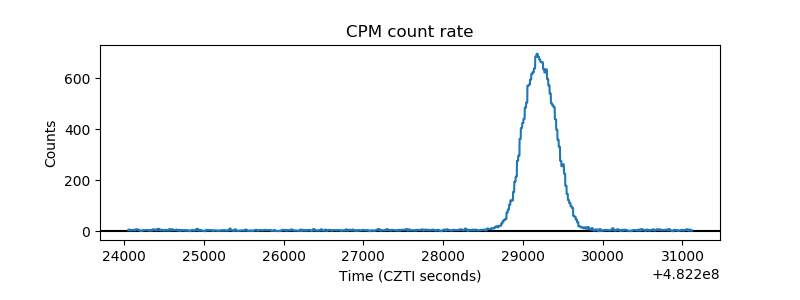 |
| CZT Counter | 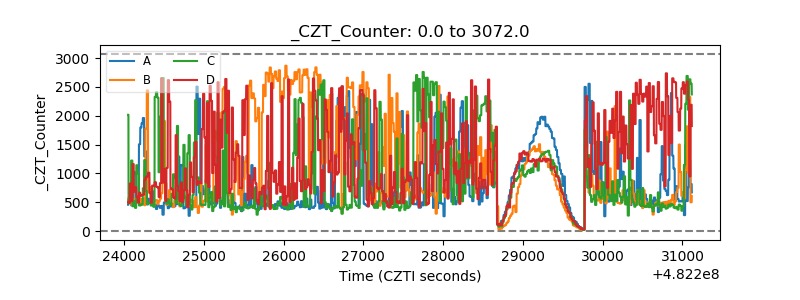 |
| +2.5 Volts monitor |  |
| +5 Volts monitor | 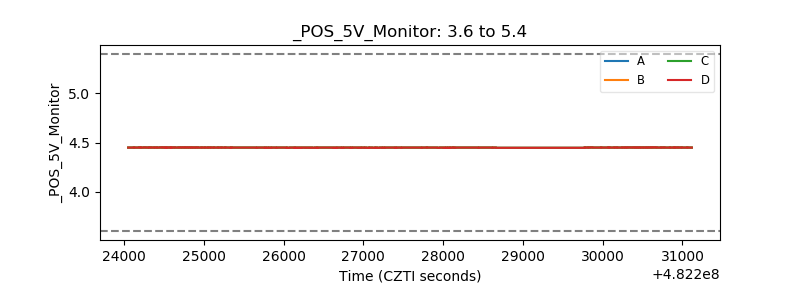 |
| _ROLL_ROT | 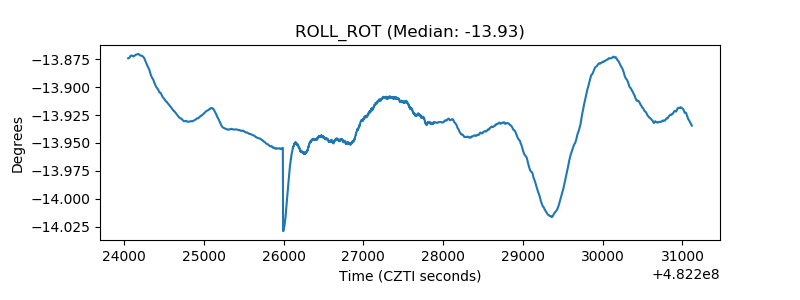 |
| _Roll_DEC | 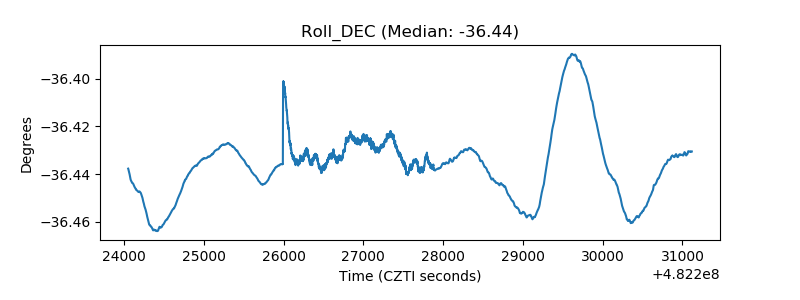 |
| _Roll_RA | 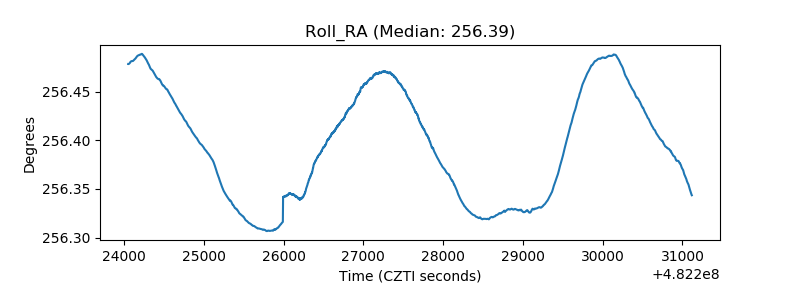 |
| Veto Counter | 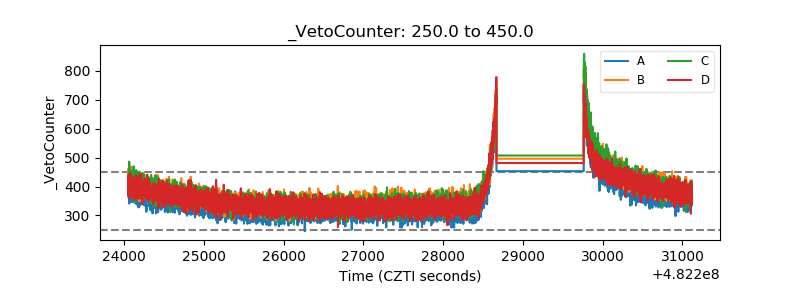 |