| Param | Original file | Final file |
|---|---|---|
| Filename | modeM0/AS1A13_037T05_9000006460_51611cztM0_level2.fits | modeM0/AS1A13_037T05_9000006460_51611cztM0_level2_quad_clean.evt |
| Size (bytes) | 788,872,320 | 86,474,880 |
| Size | 752.3 MB | 82.5 MB |
| Events in quadrant A | 5,433,881 | 616,075 |
| Events in quadrant B | 4,550,855 | 697,023 |
| Events in quadrant C | 6,858,676 | 480,733 |
| Events in quadrant D | 11,846,189 | 362,976 |
| Mode M9 | |||
|---|---|---|---|
| Quadrant | BADHDUFLAG | Total packets | Discarded packets |
| A | 0 | 11 | 0 |
| B | 0 | 11 | 0 |
| C | 0 | 11 | 0 |
| D | 0 | 11 | 0 |
| Mode M0 | |||
|---|---|---|---|
| Quadrant | BADHDUFLAG | Total packets | Discarded packets |
| A | 0 | 20551 | 1 |
| B | 0 | 17930 | 1 |
| C | 0 | 24916 | 8 |
| D | 0 | 39792 | 1 |
| Mode SS | |||
|---|---|---|---|
| Quadrant | BADHDUFLAG | Total packets | Discarded packets |
| A | 0 | 136 | 0 |
| B | 0 | 136 | 0 |
| C | 0 | 136 | 0 |
| D | 0 | 136 | 0 |
| Quadrant | Total seconds | Saturated seconds | Saturation percentage |
|---|---|---|---|
| A | 6609 | 702 | 10.621879% |
| B | 6610 | 348 | 5.264750% |
| C | 6609 | 1842 | 27.871085% |
| D | 6609 | 2995 | 45.316992% |
Noise dominated data is calculated using 1-second bins in cleaned event files. If a bin has >2000 counts, and if more than 50% of those come from <1% of pixels, then it is considered to be noise-dominated and hence unusable.
| Quadrant | # 1 sec bins | Bins with >0 counts | Bins with >2000 counts | High rate bins dominated by noise | Noise dominated (total time) | Noise dominated (detector-on time) | Marked lightcurve |
|---|---|---|---|---|---|---|---|
| A | 7714 | 6609 | 529 | 529 | 6.86% | 8.00% | 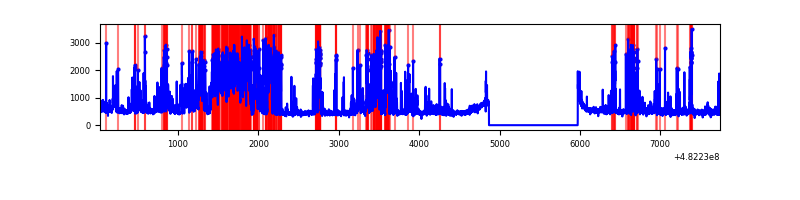 |
| B | 7715 | 6610 | 159 | 159 | 2.06% | 2.41% | 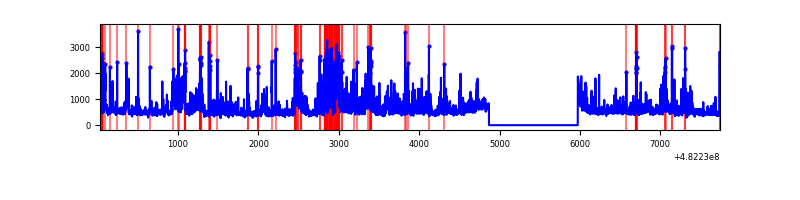 |
| C | 7714 | 6609 | 1082 | 1082 | 14.03% | 16.37% | 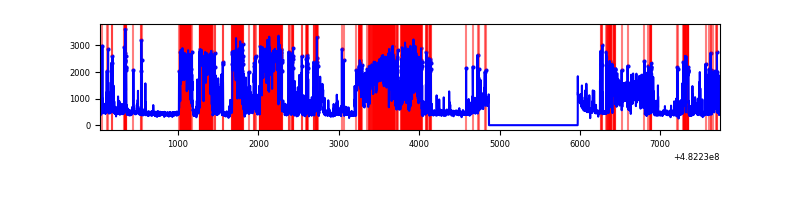 |
| D | 7714 | 6609 | 2995 | 2995 | 38.83% | 45.32% | 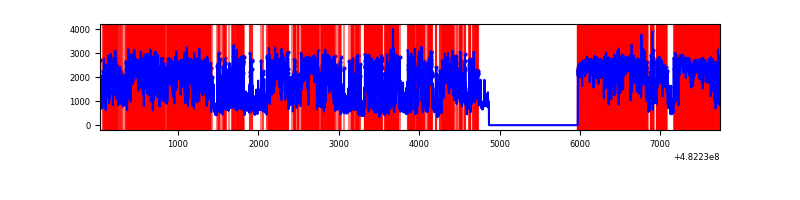 |
Top three noisy pixels from each quadrant. If the there are fewer than three noisy pixels in the level2.evt file, extra rows are filled as -1
| Pixel properties | Quadrant properties | ||||||
|---|---|---|---|---|---|---|---|
| Quadrant | DetID | PixID | Counts | Sigma | Mean | Median | Sigma |
| A | 8 | 249 | 897907 | 5056.11 | 727 | 711 | 177.4 |
| A | 4 | 175 | 378708 | 2130.18 | 727 | 711 | 177.4 |
| A | 12 | 3 | 293681 | 1651.02 | 727 | 711 | 177.4 |
| B | 10 | 44 | 403145 | 2574.65 | 731 | 704 | 156.3 |
| B | 1 | 207 | 227057 | 1448.11 | 731 | 704 | 156.3 |
| B | 10 | 41 | 168026 | 1070.46 | 731 | 704 | 156.3 |
| C | 15 | 198 | 2098242 | 12212.55 | 621 | 616 | 171.8 |
| C | 13 | 3 | 2040181 | 11874.51 | 621 | 616 | 171.8 |
| C | 0 | 209 | 59833 | 344.77 | 621 | 616 | 171.8 |
| D | 15 | 174 | 4070790 | 24610.95 | 604 | 583 | 165.4 |
| D | 8 | 176 | 1992158 | 12042.27 | 604 | 583 | 165.4 |
| D | 11 | 176 | 1296654 | 7836.83 | 604 | 583 | 165.4 |
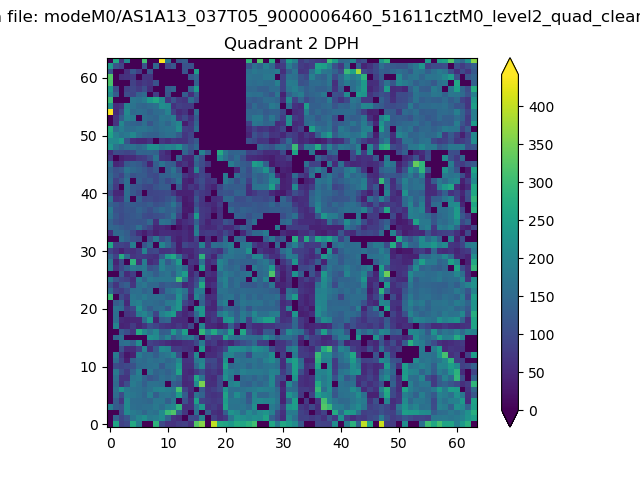
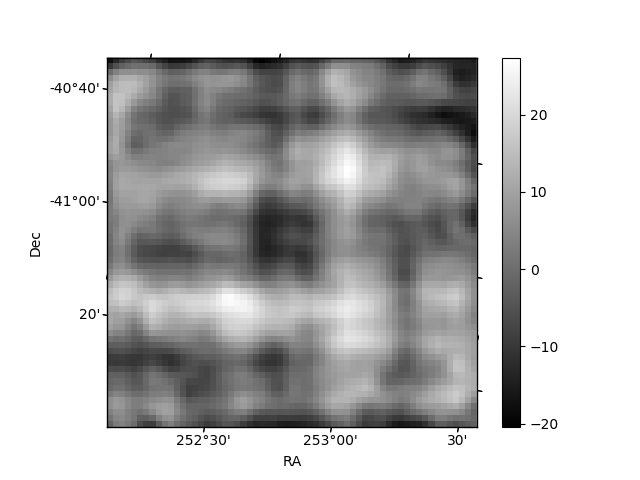
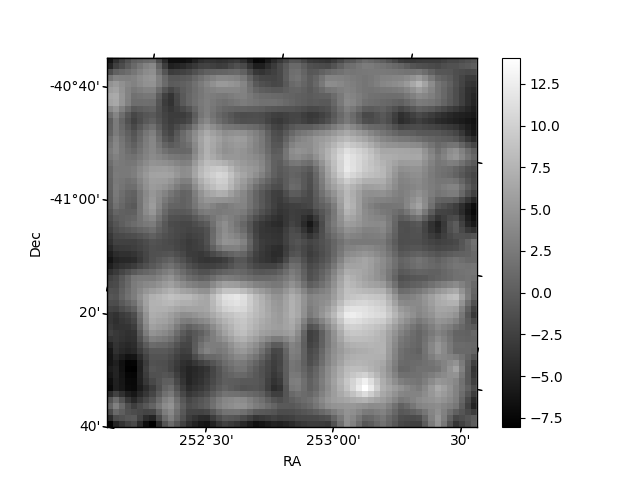
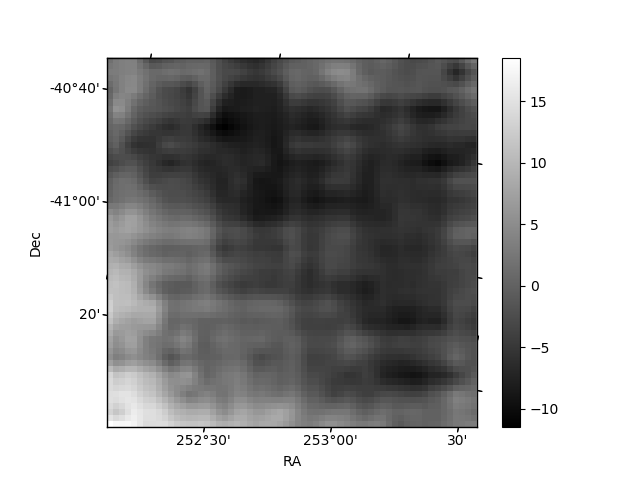
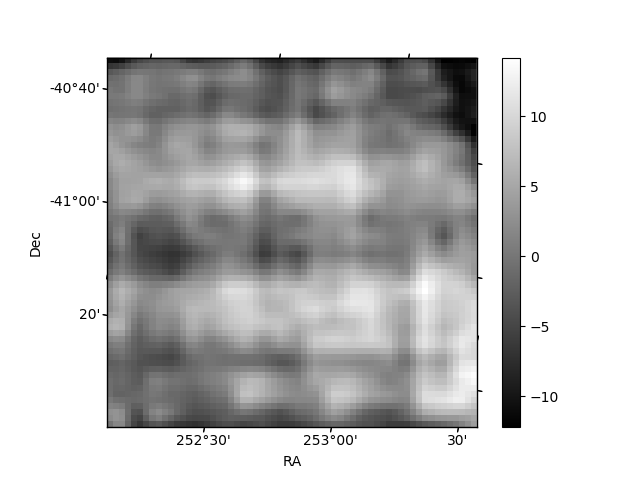
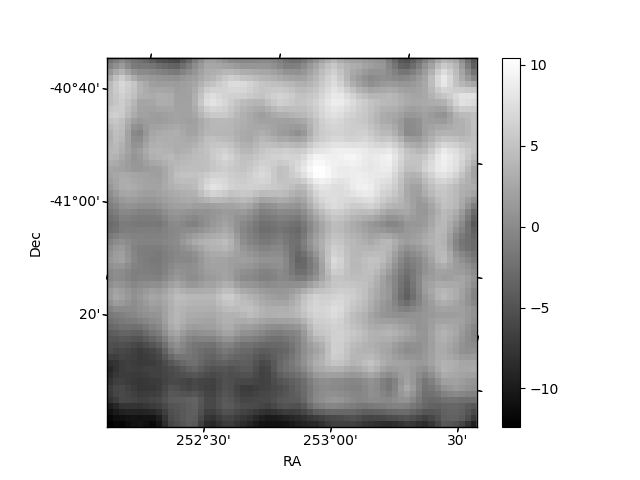
Histogram calculated using DETX and DETY for each event in the final _common_clean file
| Quadrant A | 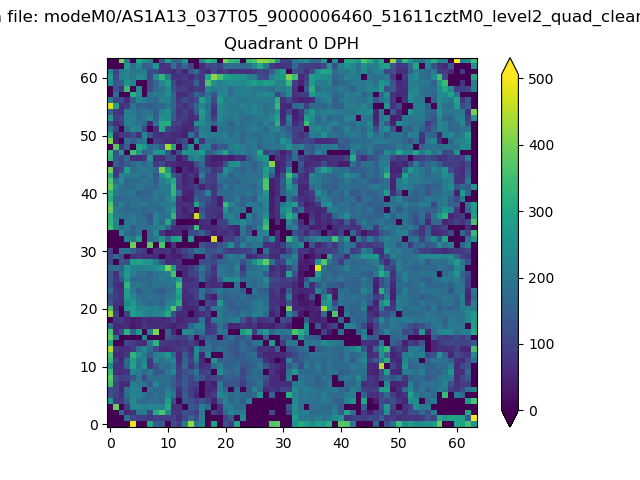 |
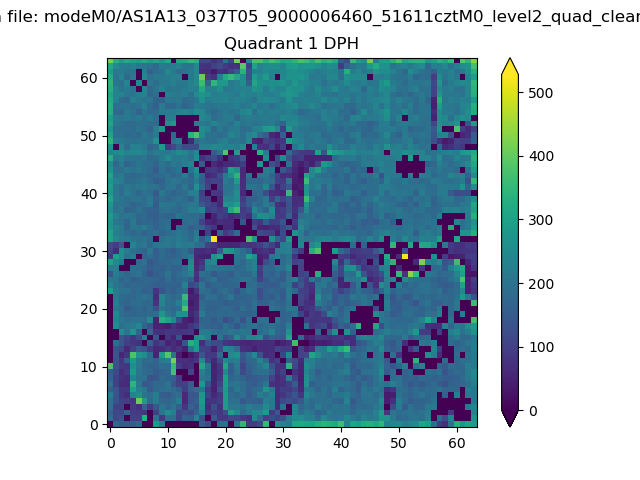 |
Quadrant B |
|---|---|---|---|
| Quadrant D | 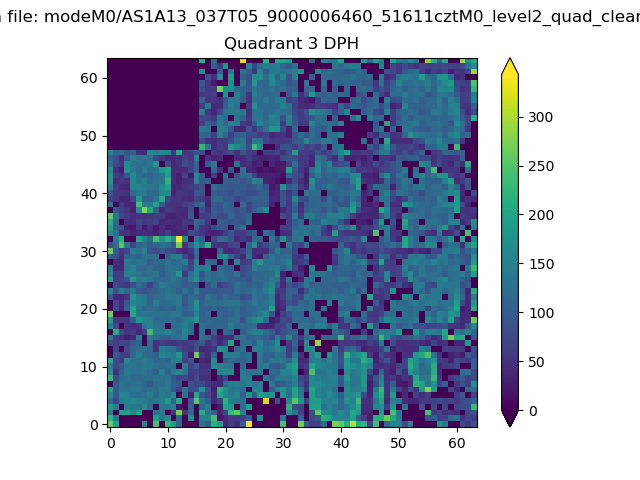 |
 |
Quadrant C |
| Plot type | Count rate plots | Images |
|---|---|---|
| Comparison with Poisson distribution Blue bars denote a histogram of data divided into 1 sec bins. Red curve is a Poisson curve with rate = median count rate of data. |
 |
 |
| Quadrant-wise count rates Data is divided into 100 sec bins |
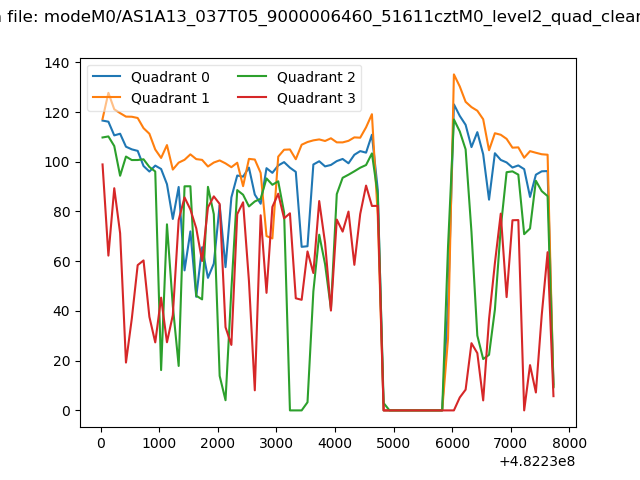 |
|
| Module-wise count rates for Quadrant A Data is divided into 100 sec bins |
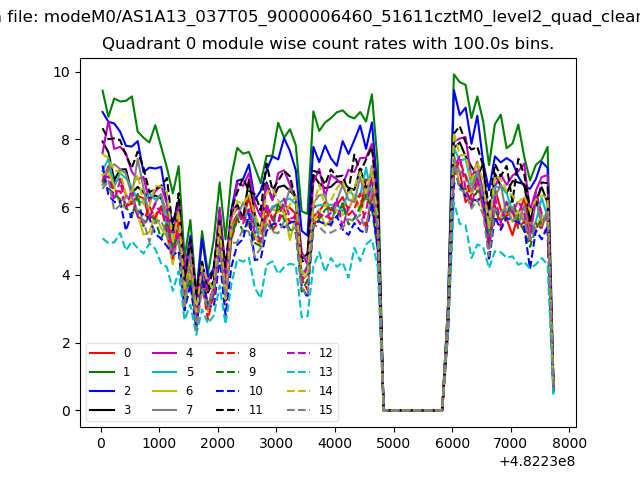 |
 |
| Module-wise count rates for Quadrant B Data is divided into 100 sec bins |
 |
 |
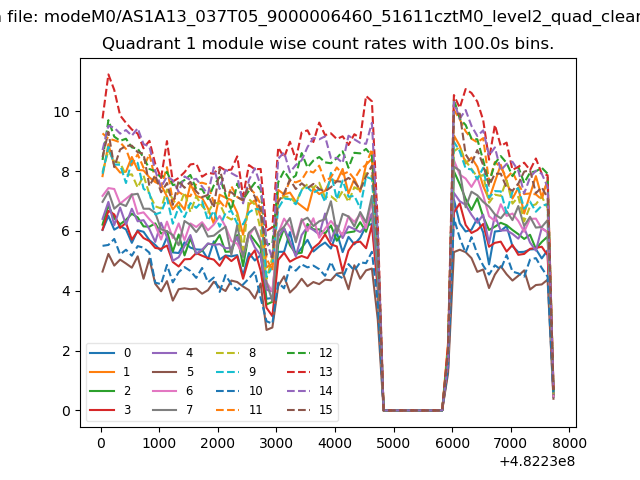
| Module-wise count rates for Quadrant C Data is divided into 100 sec bins |
 |
 |
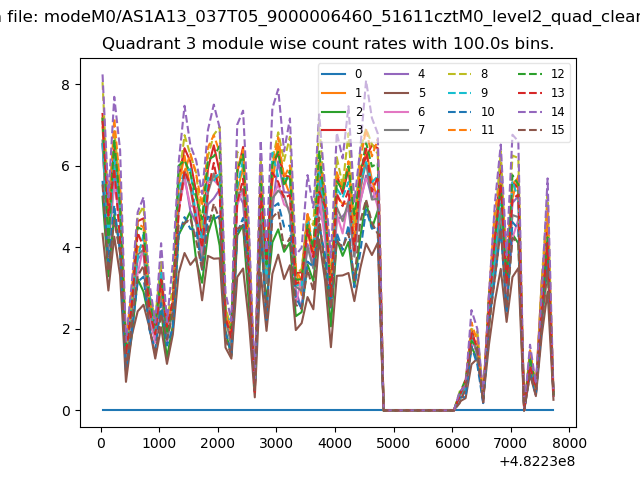
| Module-wise count rates for Quadrant D Data is divided into 100 sec bins |
 |
 |
| Parameter | Plot |
|---|---|
| CZT HV Monitor |  |
| D_VDD | 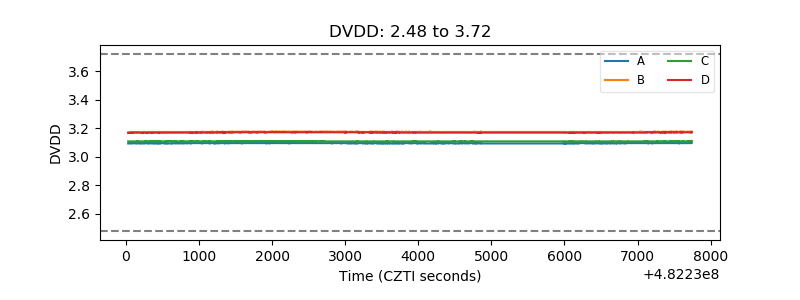 |
| Temperature 1 | 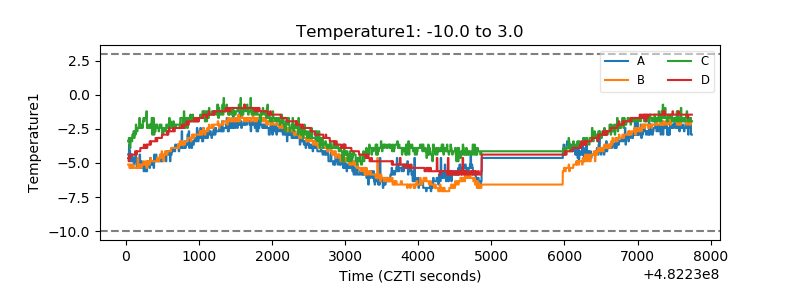 |
| Veto HV Monitor | 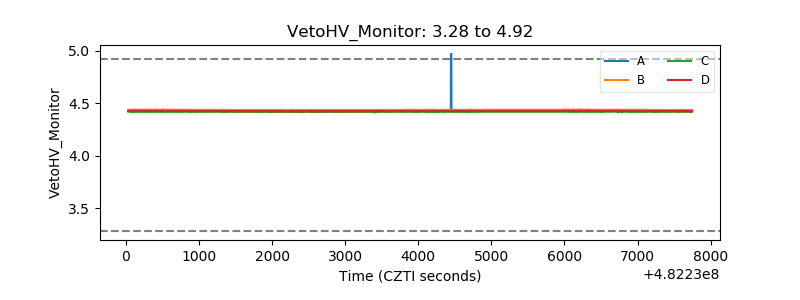 |
| Veto LLD | 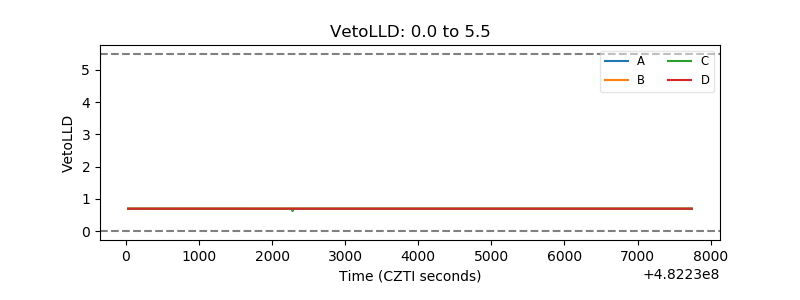 |
| Alpha Counter | 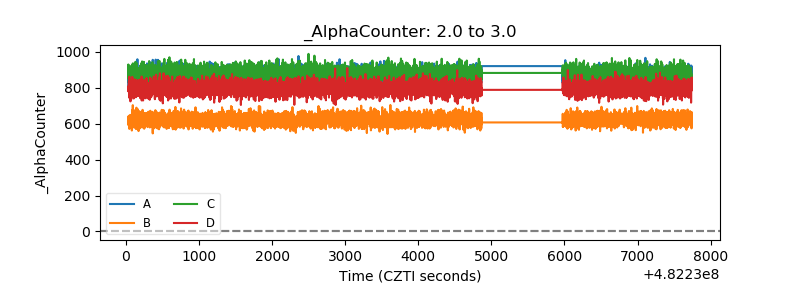 |
| _CPM_Rate | 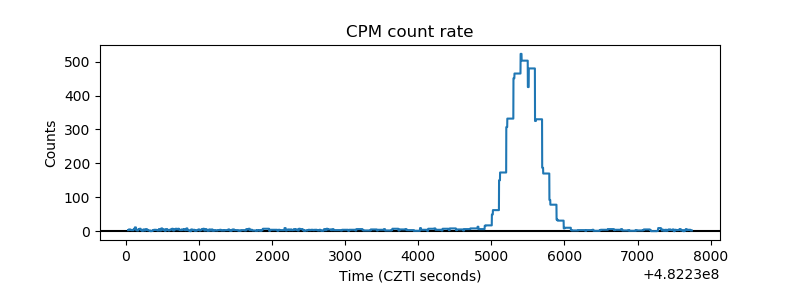 |
| CZT Counter | 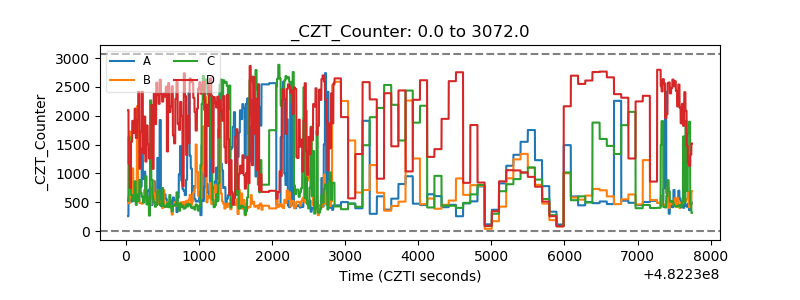 |
| +2.5 Volts monitor | 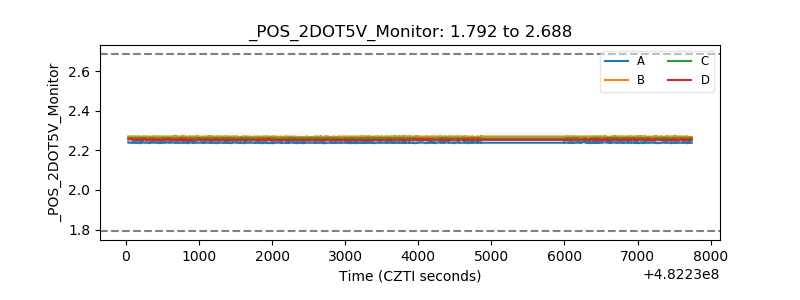 |
| +5 Volts monitor | 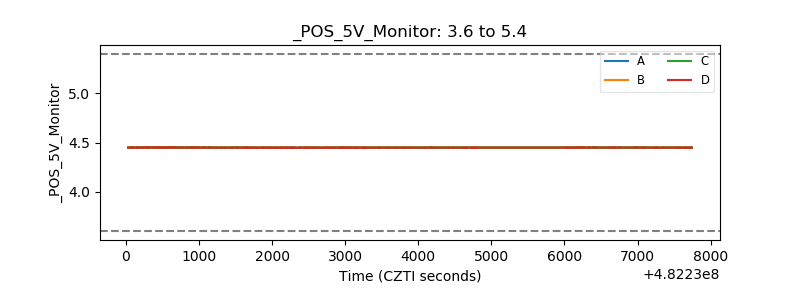 |
| _ROLL_ROT | 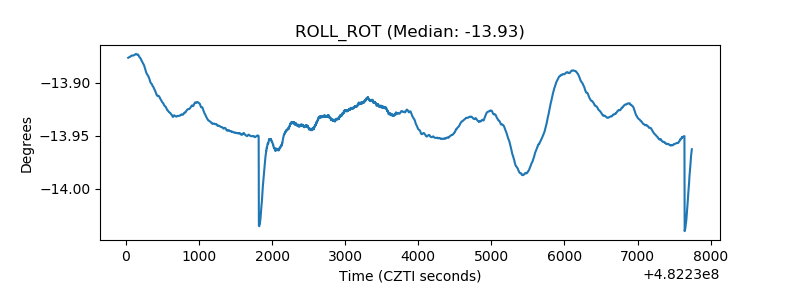 |
| _Roll_DEC | 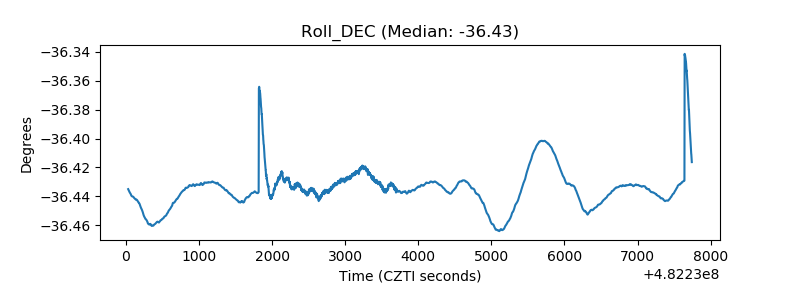 |
| _Roll_RA | 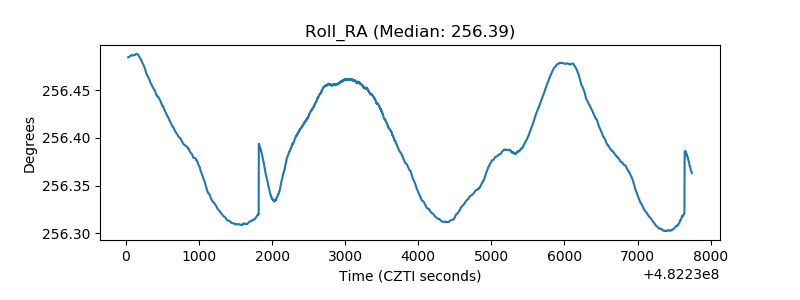 |
| Veto Counter | 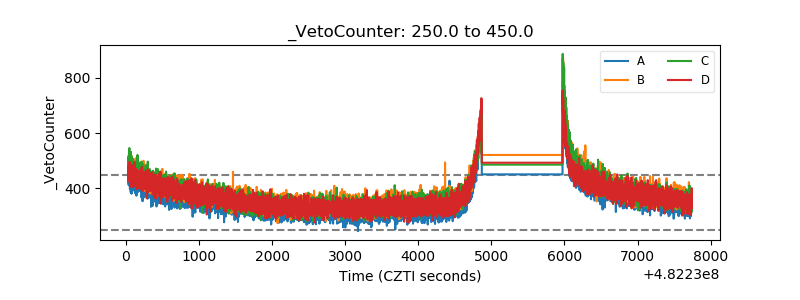 |