| Param | Original file | Final file |
|---|---|---|
| Filename | modeM0/AS1A13_037T05_9000006460_51612cztM0_level2.fits | modeM0/AS1A13_037T05_9000006460_51612cztM0_level2_quad_clean.evt |
| Size (bytes) | 715,446,720 | 86,042,880 |
| Size | 682.3 MB | 82.1 MB |
| Events in quadrant A | 4,326,364 | 632,466 |
| Events in quadrant B | 4,167,813 | 686,849 |
| Events in quadrant C | 4,345,133 | 571,857 |
| Events in quadrant D | 13,132,117 | 253,926 |
| Mode M9 | |||
|---|---|---|---|
| Quadrant | BADHDUFLAG | Total packets | Discarded packets |
| A | 0 | 10 | 0 |
| B | 0 | 10 | 0 |
| C | 0 | 10 | 0 |
| D | 0 | 10 | 0 |
| Mode M0 | |||
|---|---|---|---|
| Quadrant | BADHDUFLAG | Total packets | Discarded packets |
| A | 0 | 17260 | 1 |
| B | 0 | 16744 | 1 |
| C | 0 | 17566 | 1 |
| D | 0 | 43537 | 1 |
| Mode SS | |||
|---|---|---|---|
| Quadrant | BADHDUFLAG | Total packets | Discarded packets |
| A | 0 | 134 | 0 |
| B | 0 | 134 | 0 |
| C | 0 | 134 | 0 |
| D | 0 | 134 | 0 |
| Quadrant | Total seconds | Saturated seconds | Saturation percentage |
|---|---|---|---|
| A | 6595 | 318 | 4.821835% |
| B | 6595 | 311 | 4.715694% |
| C | 6595 | 701 | 10.629265% |
| D | 6595 | 4085 | 61.940864% |
Noise dominated data is calculated using 1-second bins in cleaned event files. If a bin has >2000 counts, and if more than 50% of those come from <1% of pixels, then it is considered to be noise-dominated and hence unusable.
| Quadrant | # 1 sec bins | Bins with >0 counts | Bins with >2000 counts | High rate bins dominated by noise | Noise dominated (total time) | Noise dominated (detector-on time) | Marked lightcurve |
|---|---|---|---|---|---|---|---|
| A | 7640 | 6595 | 175 | 175 | 2.29% | 2.65% | 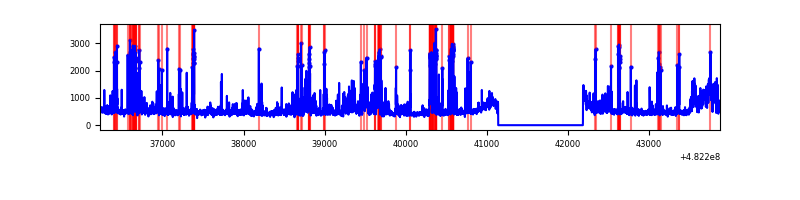 |
| B | 7640 | 6595 | 116 | 116 | 1.52% | 1.76% | 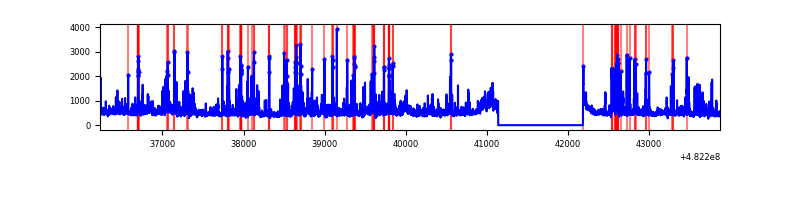 |
| C | 7640 | 6595 | 166 | 166 | 2.17% | 2.52% | 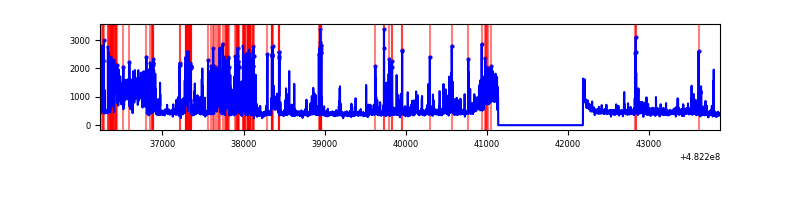 |
| D | 7640 | 6595 | 4037 | 4037 | 52.84% | 61.21% | 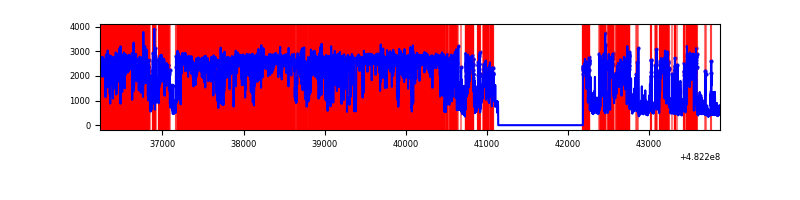 |
Top three noisy pixels from each quadrant. If the there are fewer than three noisy pixels in the level2.evt file, extra rows are filled as -1
| Pixel properties | Quadrant properties | ||||||
|---|---|---|---|---|---|---|---|
| Quadrant | DetID | PixID | Counts | Sigma | Mean | Median | Sigma |
| A | 12 | 3 | 283425 | 1577.93 | 738 | 720 | 179.2 |
| A | 12 | 250 | 249704 | 1389.72 | 738 | 720 | 179.2 |
| A | 5 | 241 | 240176 | 1336.54 | 738 | 720 | 179.2 |
| B | 4 | 174 | 214954 | 1374.63 | 728 | 704 | 155.9 |
| B | 5 | 185 | 178786 | 1142.58 | 728 | 704 | 155.9 |
| B | 8 | 128 | 139108 | 888.0 | 728 | 704 | 155.9 |
| C | 15 | 198 | 1003688 | 5235.43 | 692 | 685 | 191.6 |
| C | 13 | 3 | 209869 | 1091.89 | 692 | 685 | 191.6 |
| C | 0 | 209 | 103576 | 537.06 | 692 | 685 | 191.6 |
| D | 15 | 174 | 6125927 | 40835.14 | 544 | 523 | 150.0 |
| D | 8 | 176 | 2160234 | 14397.76 | 544 | 523 | 150.0 |
| D | 11 | 176 | 1594026 | 10623.12 | 544 | 523 | 150.0 |
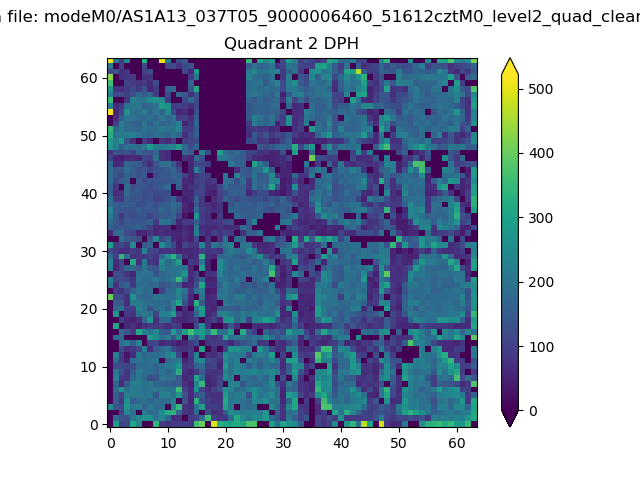
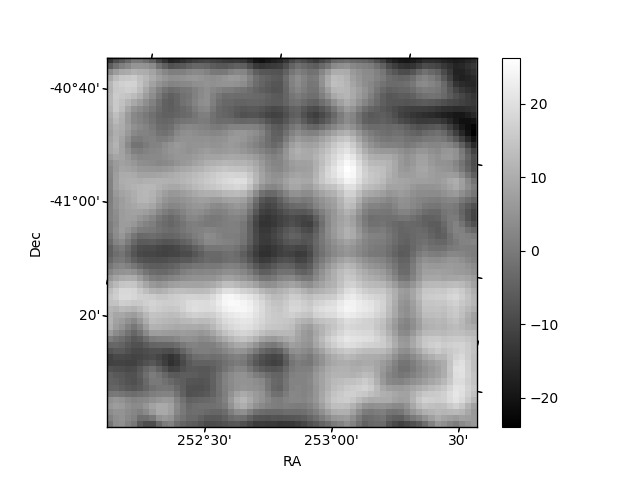
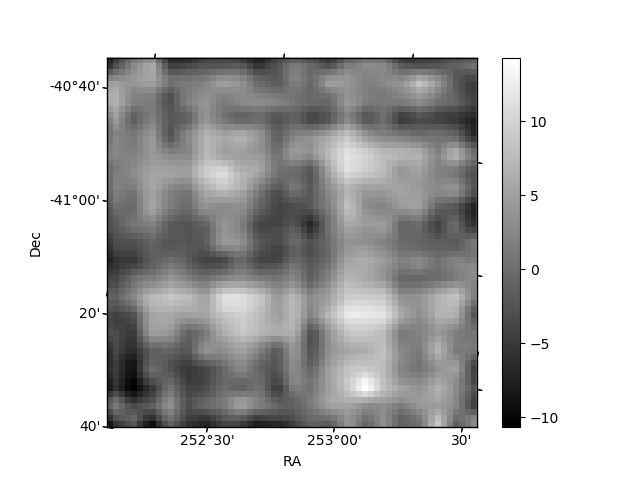
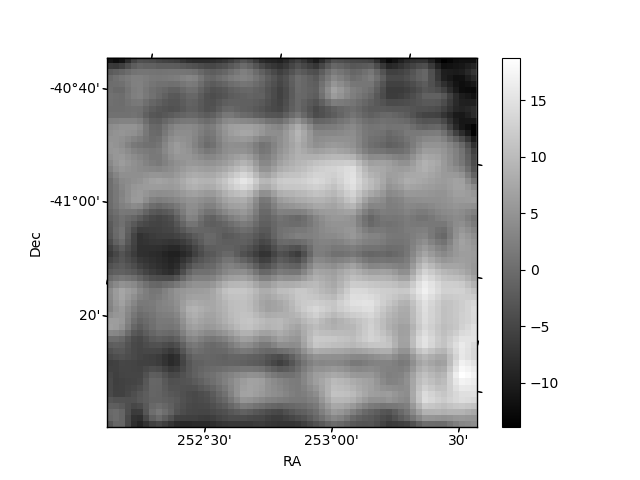
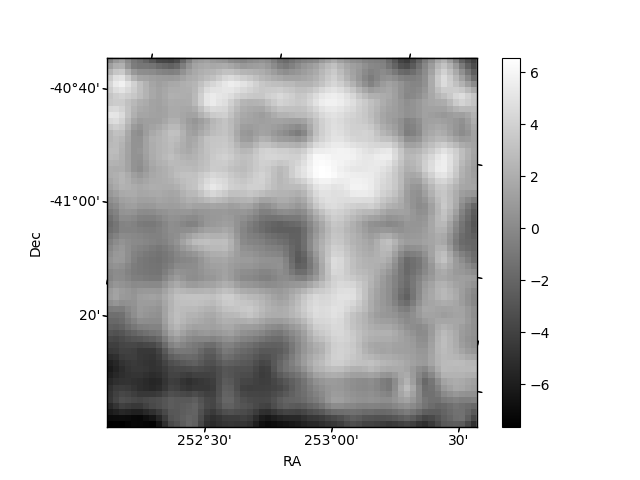
Histogram calculated using DETX and DETY for each event in the final _common_clean file
| Quadrant A | 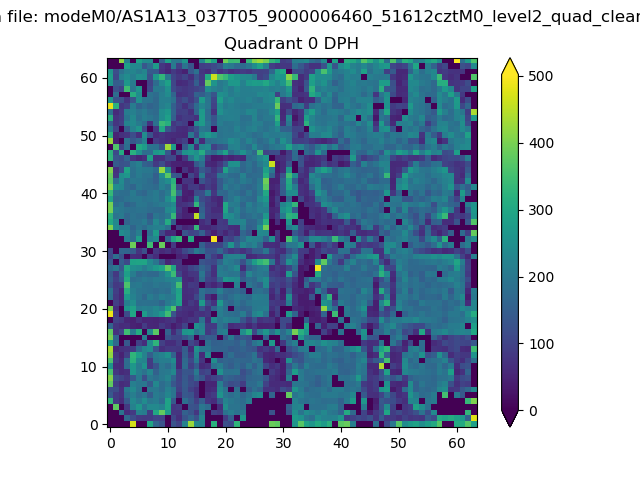 |
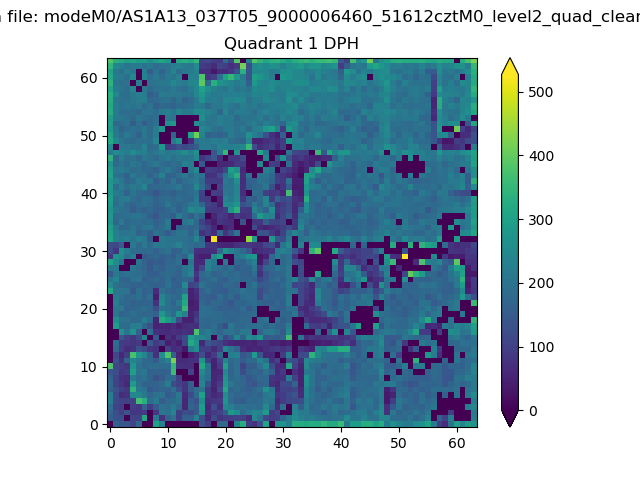 |
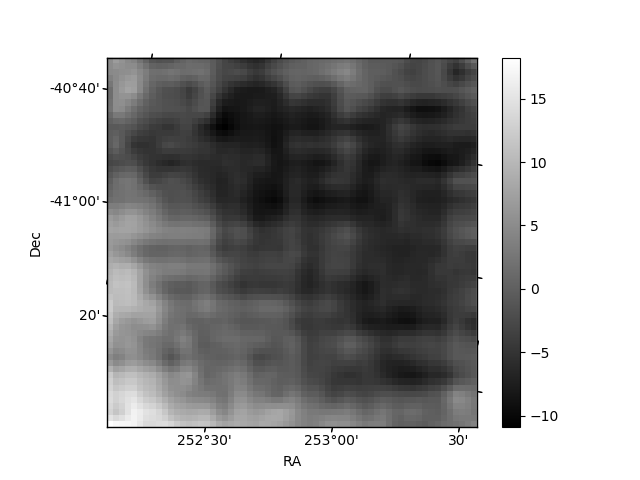
Quadrant B |
|---|---|---|---|
| Quadrant D | 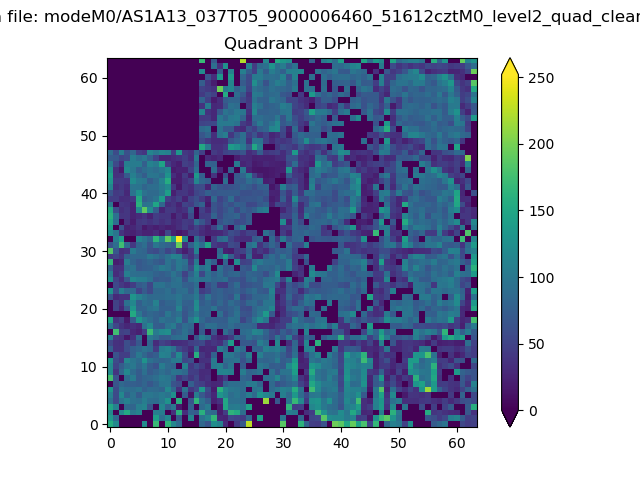 |
 |
Quadrant C |
| Plot type | Count rate plots | Images |
|---|---|---|
| Comparison with Poisson distribution Blue bars denote a histogram of data divided into 1 sec bins. Red curve is a Poisson curve with rate = median count rate of data. |
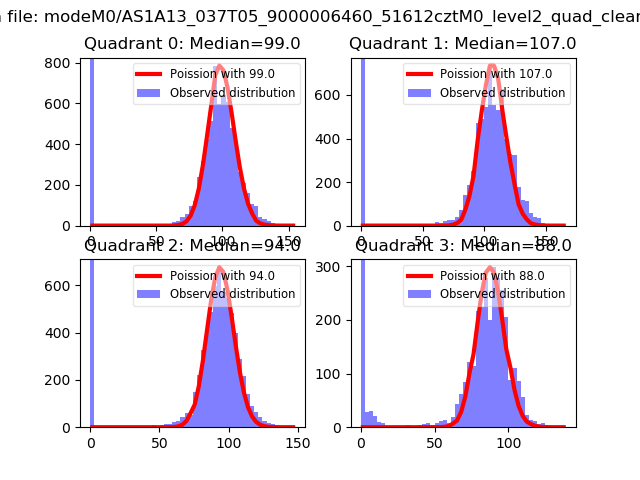 |
 |
| Quadrant-wise count rates Data is divided into 100 sec bins |
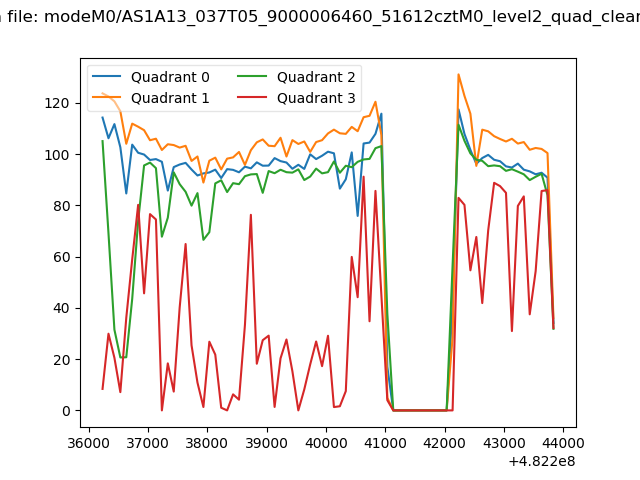 |
|
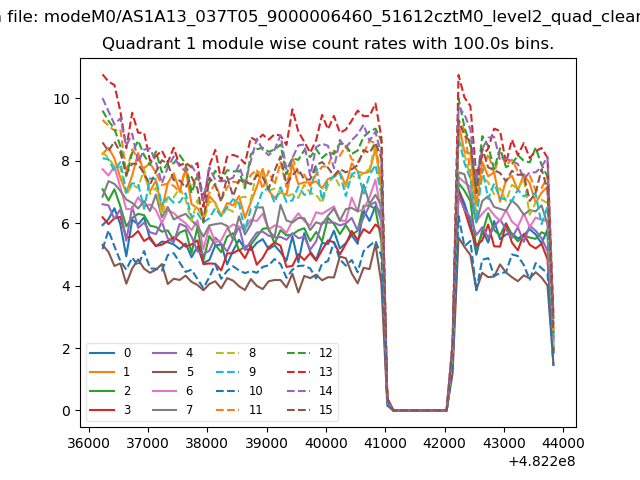
| Module-wise count rates for Quadrant A Data is divided into 100 sec bins |
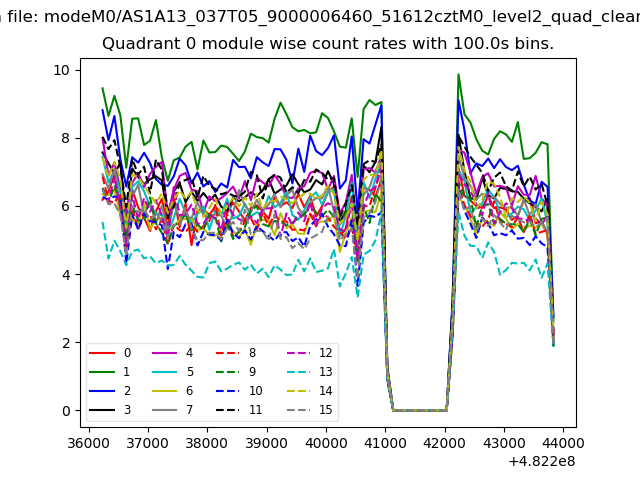 |
 |
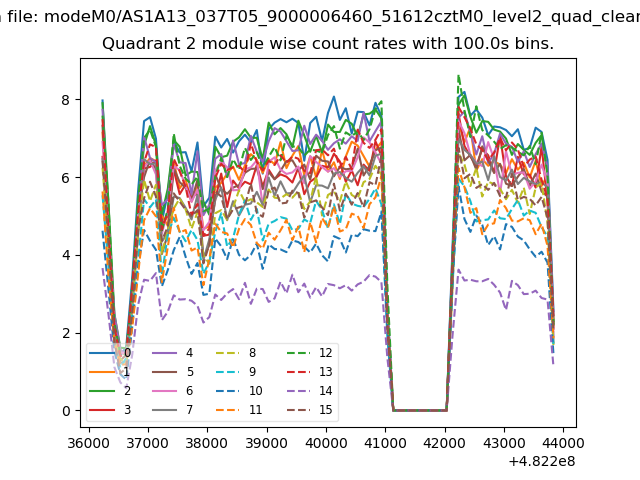
| Module-wise count rates for Quadrant B Data is divided into 100 sec bins |
 |
 |
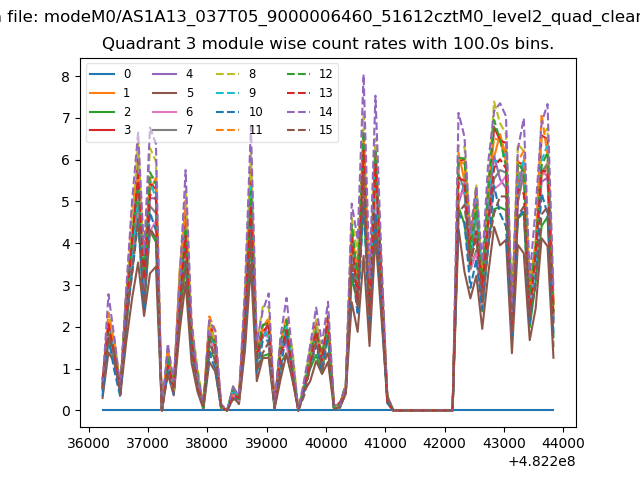
| Module-wise count rates for Quadrant C Data is divided into 100 sec bins |
 |
 |
| Module-wise count rates for Quadrant D Data is divided into 100 sec bins |
 |
 |
| Parameter | Plot |
|---|---|
| CZT HV Monitor | 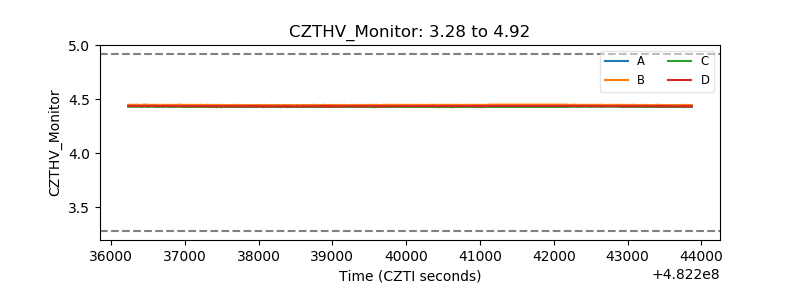 |
| D_VDD | 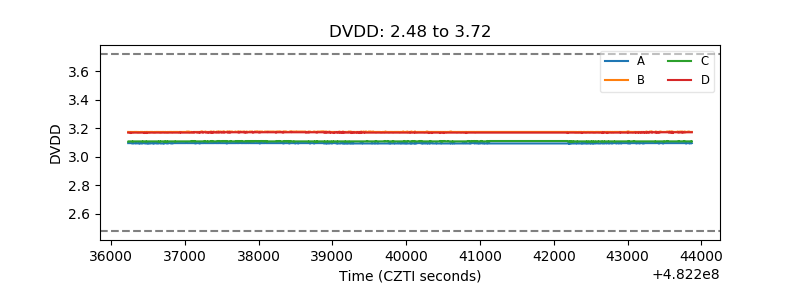 |
| Temperature 1 | 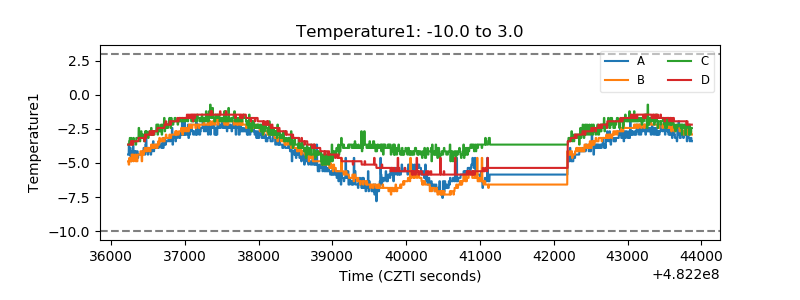 |
| Veto HV Monitor | 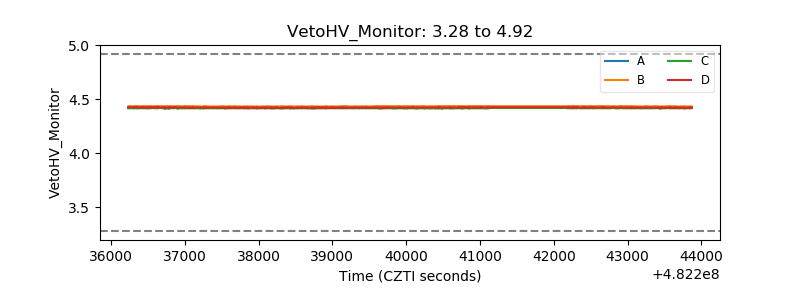 |
| Veto LLD | 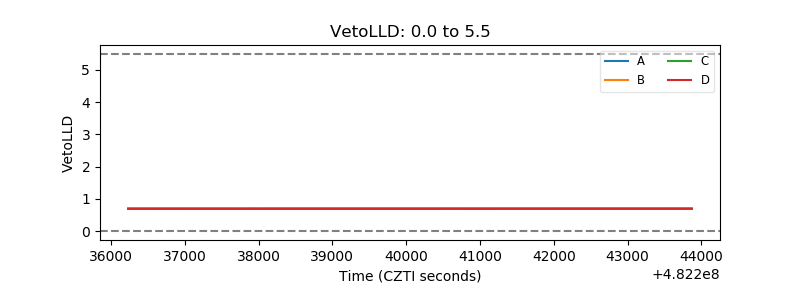 |
| Alpha Counter | 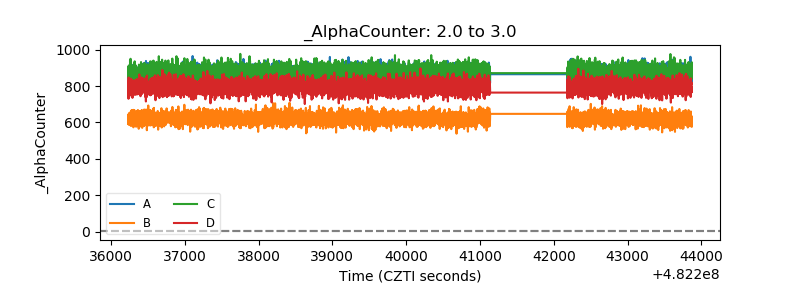 |
| _CPM_Rate | 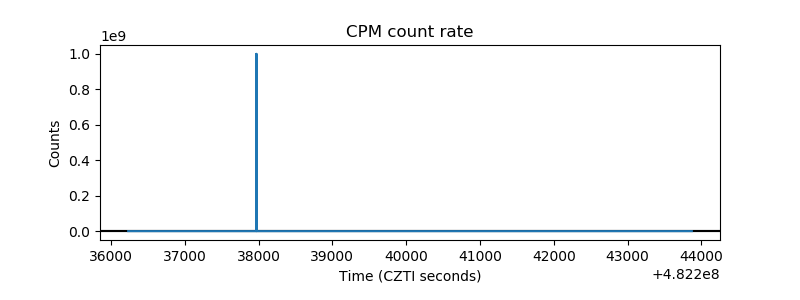 |
| CZT Counter | 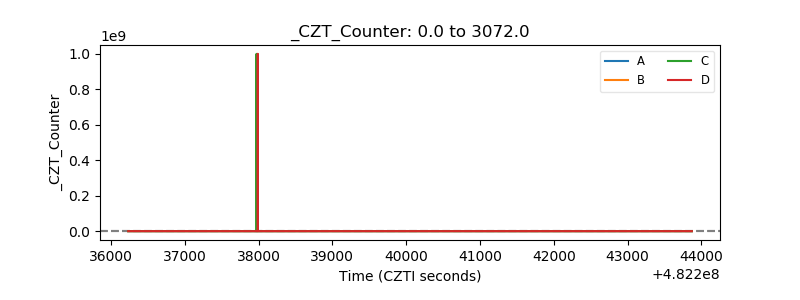 |
| +2.5 Volts monitor | 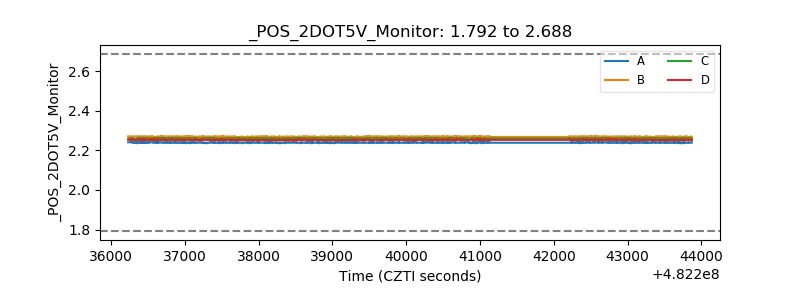 |
| +5 Volts monitor | 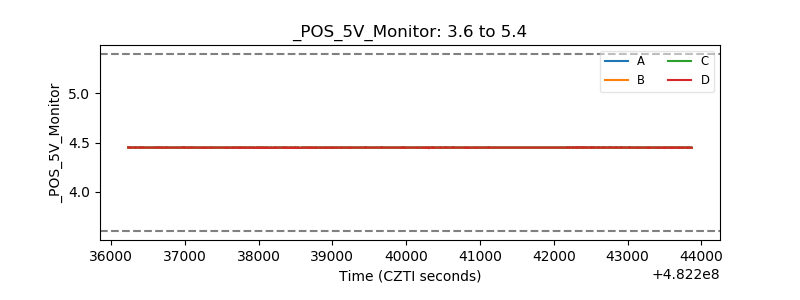 |
| _ROLL_ROT | 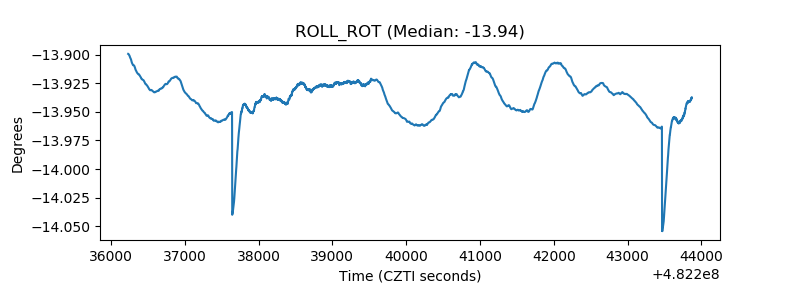 |
| _Roll_DEC | 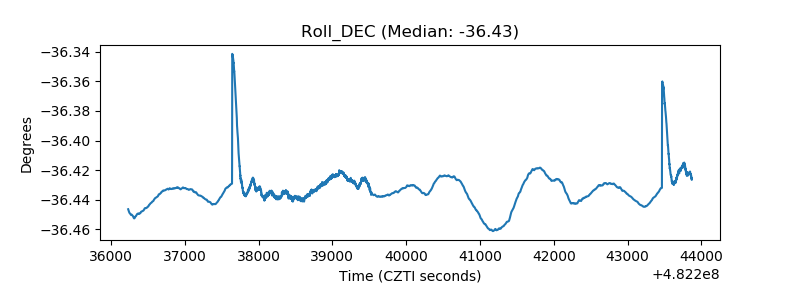 |
| _Roll_RA | 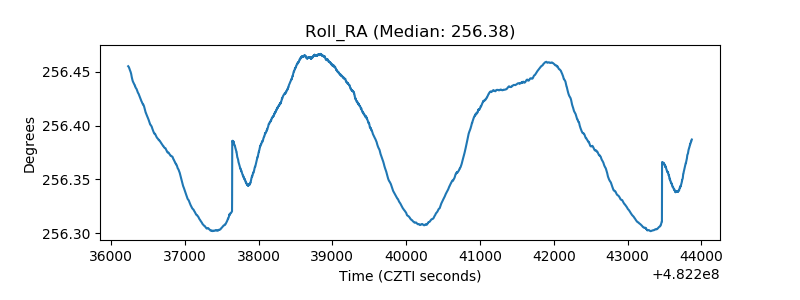 |
| Veto Counter | 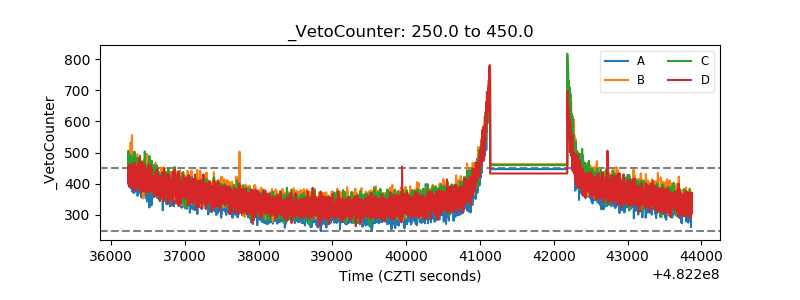 |