| Param | Original file | Final file |
|---|---|---|
| Filename | modeM0/AS1A13_037T05_9000006460_51613cztM0_level2.fits | modeM0/AS1A13_037T05_9000006460_51613cztM0_level2_quad_clean.evt |
| Size (bytes) | 624,297,600 | 98,326,080 |
| Size | 595.4 MB | 93.8 MB |
| Events in quadrant A | 5,858,017 | 630,377 |
| Events in quadrant B | 5,868,993 | 680,133 |
| Events in quadrant C | 4,422,199 | 625,234 |
| Events in quadrant D | 6,416,783 | 553,276 |
| Mode M9 | |||
|---|---|---|---|
| Quadrant | BADHDUFLAG | Total packets | Discarded packets |
| A | 0 | 14 | 0 |
| B | 0 | 15 | 0 |
| C | 0 | 15 | 0 |
| D | 0 | 15 | 0 |
| Mode M0 | |||
|---|---|---|---|
| Quadrant | BADHDUFLAG | Total packets | Discarded packets |
| A | 0 | 22159 | 2 |
| B | 0 | 22183 | 2 |
| C | 0 | 18126 | 2 |
| D | 0 | 23839 | 2 |
| Mode SS | |||
|---|---|---|---|
| Quadrant | BADHDUFLAG | Total packets | Discarded packets |
| A | 0 | 142 | 0 |
| B | 0 | 142 | 0 |
| C | 0 | 142 | 0 |
| D | 0 | 142 | 0 |
| Quadrant | Total seconds | Saturated seconds | Saturation percentage |
|---|---|---|---|
| A | 7008 | 677 | 9.660388% |
| B | 7008 | 737 | 10.516553% |
| C | 7008 | 499 | 7.120434% |
| D | 7008 | 906 | 12.928082% |
Noise dominated data is calculated using 1-second bins in cleaned event files. If a bin has >2000 counts, and if more than 50% of those come from <1% of pixels, then it is considered to be noise-dominated and hence unusable.
| Quadrant | # 1 sec bins | Bins with >0 counts | Bins with >2000 counts | High rate bins dominated by noise | Noise dominated (total time) | Noise dominated (detector-on time) | Marked lightcurve |
|---|---|---|---|---|---|---|---|
| A | 7903 | 7008 | 486 | 486 | 6.15% | 6.93% | 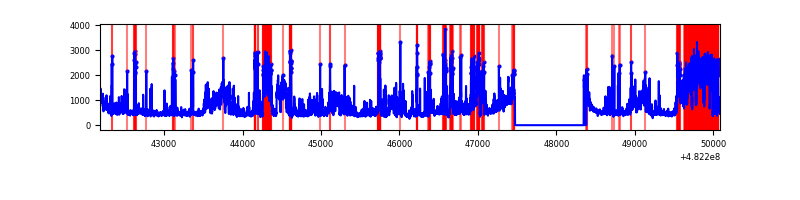 |
| B | 7903 | 7008 | 456 | 456 | 5.77% | 6.51% | 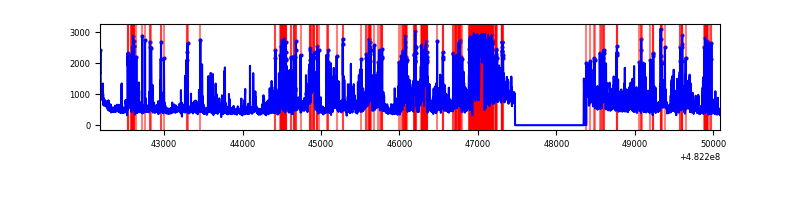 |
| C | 7903 | 7009 | 292 | 292 | 3.69% | 4.17% |  |
| D | 7903 | 7008 | 858 | 858 | 10.86% | 12.24% | 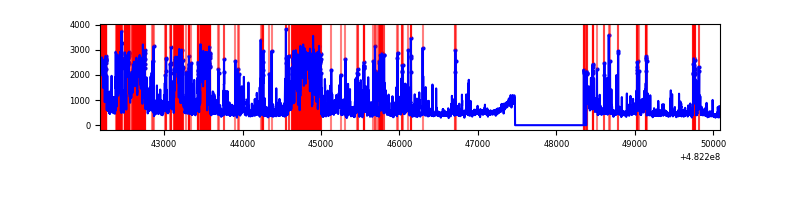 |
Top three noisy pixels from each quadrant. If the there are fewer than three noisy pixels in the level2.evt file, extra rows are filled as -1
| Pixel properties | Quadrant properties | ||||||
|---|---|---|---|---|---|---|---|
| Quadrant | DetID | PixID | Counts | Sigma | Mean | Median | Sigma |
| A | 4 | 175 | 823968 | 4377.2 | 771 | 753 | 188.1 |
| A | 12 | 3 | 734968 | 3903.96 | 771 | 753 | 188.1 |
| A | 15 | 174 | 443456 | 2353.94 | 771 | 753 | 188.1 |
| B | 5 | 185 | 1127954 | 6884.22 | 760 | 736 | 163.7 |
| B | 10 | 44 | 656547 | 4005.21 | 760 | 736 | 163.7 |
| B | 5 | 172 | 189480 | 1152.71 | 760 | 736 | 163.7 |
| C | 0 | 209 | 1023132 | 4946.34 | 754 | 751 | 206.7 |
| C | 1 | 243 | 110627 | 531.58 | 754 | 751 | 206.7 |
| C | 10 | 19 | 79297 | 380.01 | 754 | 751 | 206.7 |
| D | 15 | 174 | 1087533 | 5412.68 | 730 | 705 | 200.8 |
| D | 11 | 176 | 809406 | 4027.54 | 730 | 705 | 200.8 |
| D | 8 | 176 | 619408 | 3081.3 | 730 | 705 | 200.8 |
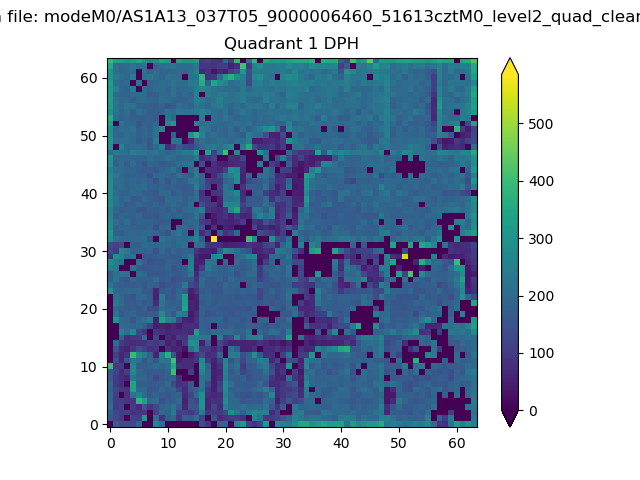
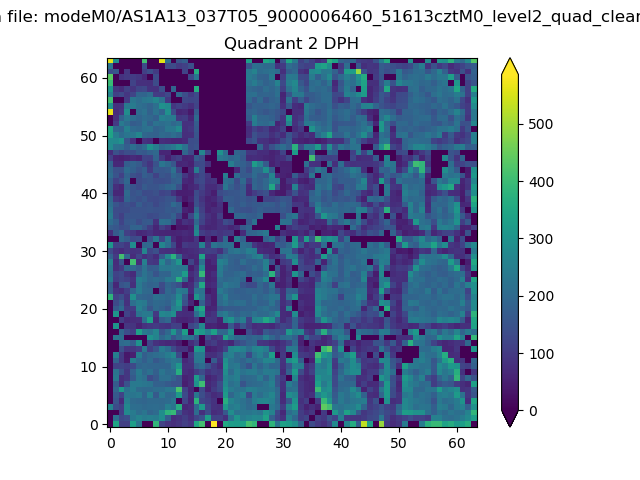
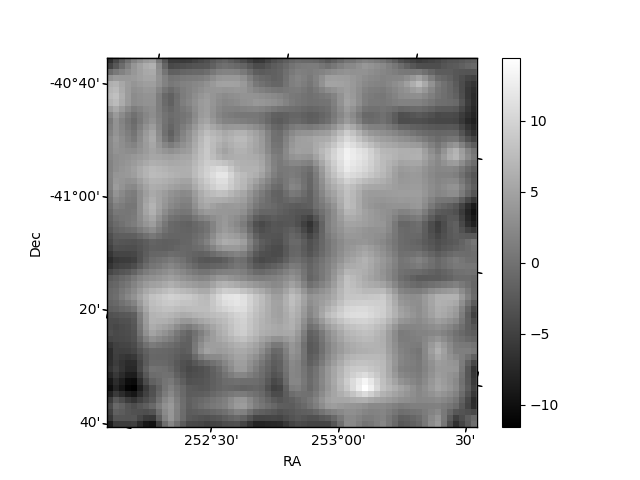
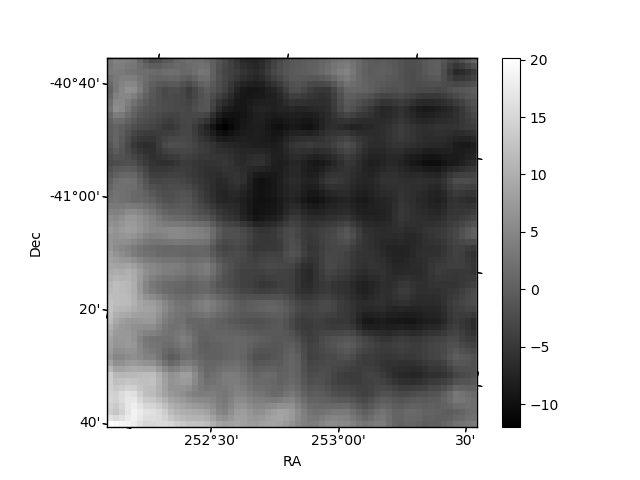
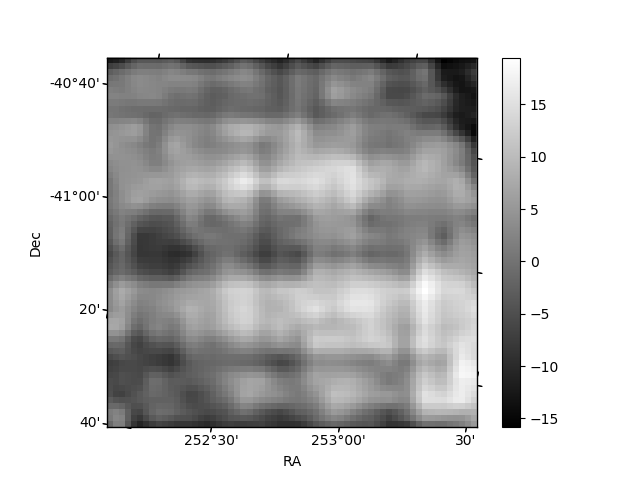
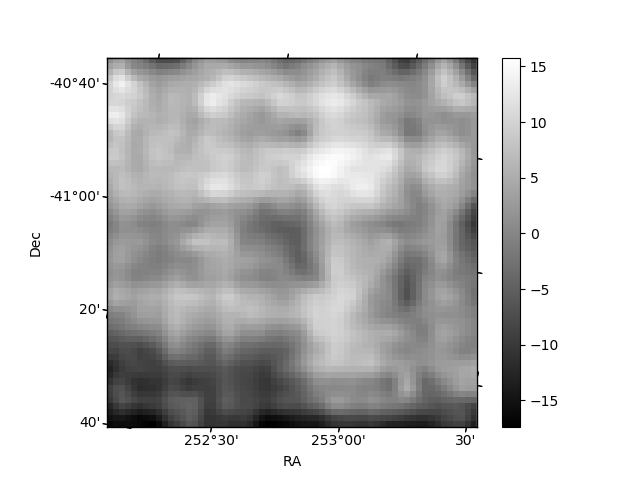
Histogram calculated using DETX and DETY for each event in the final _common_clean file
| Quadrant A | 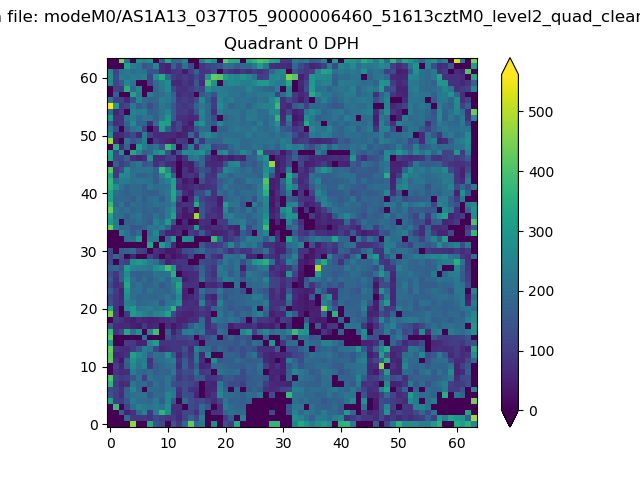 |
 |
Quadrant B |
|---|---|---|---|
| Quadrant D | 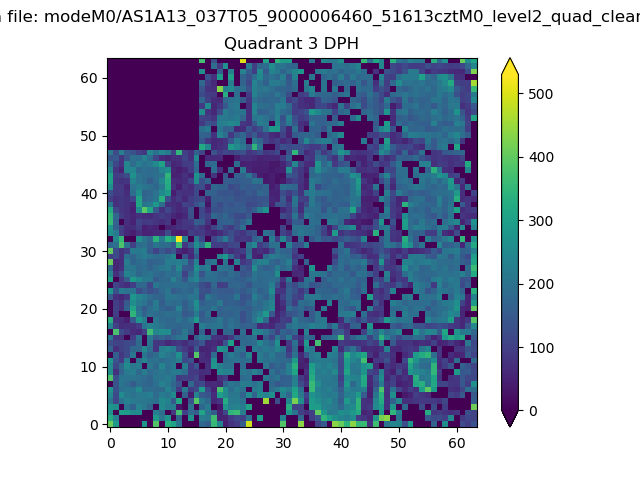 |
 |
Quadrant C |
| Plot type | Count rate plots | Images |
|---|---|---|
| Comparison with Poisson distribution Blue bars denote a histogram of data divided into 1 sec bins. Red curve is a Poisson curve with rate = median count rate of data. |
 |
 |
| Quadrant-wise count rates Data is divided into 100 sec bins |
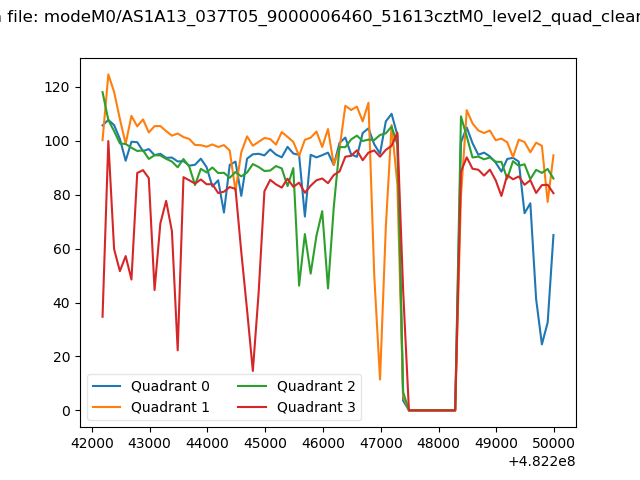 |
|
| Module-wise count rates for Quadrant A Data is divided into 100 sec bins |
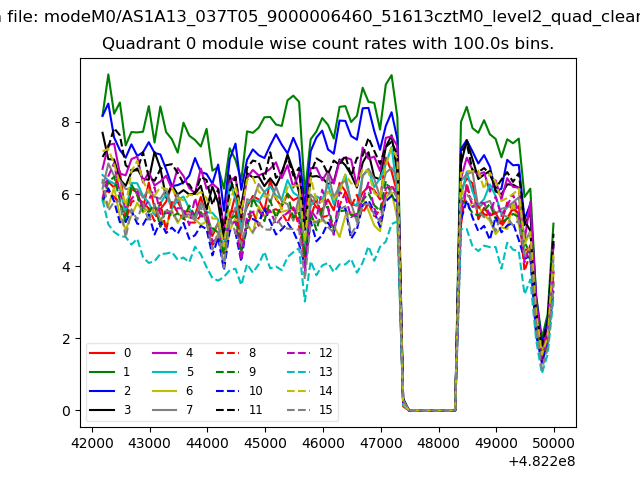 |
 |
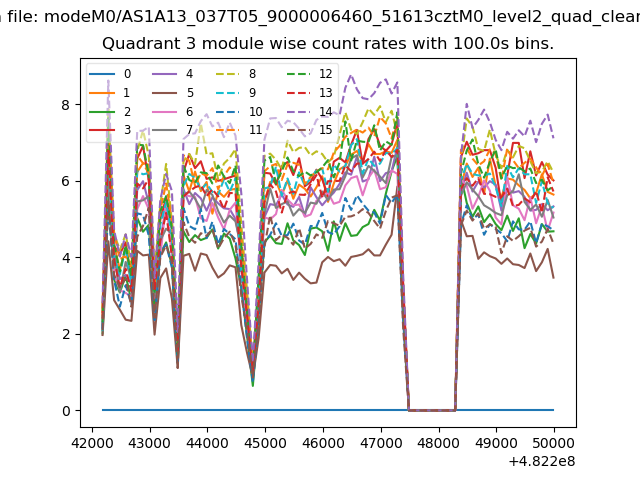
| Module-wise count rates for Quadrant B Data is divided into 100 sec bins |
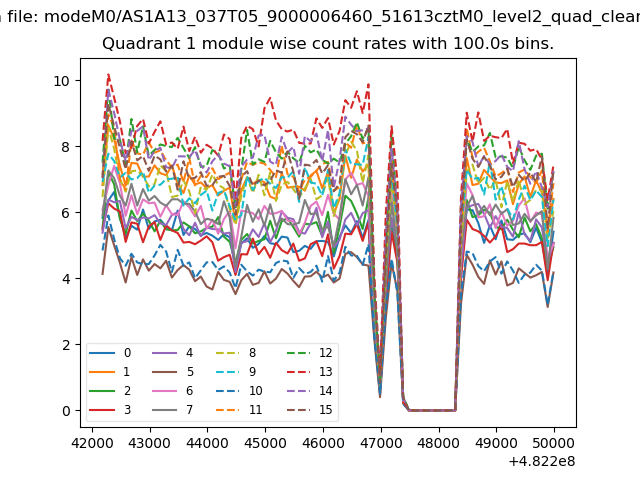 |
 |
| Module-wise count rates for Quadrant C Data is divided into 100 sec bins |
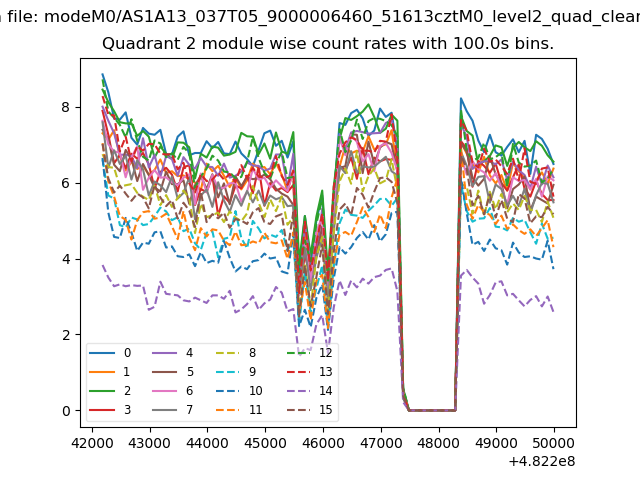 |
 |
| Module-wise count rates for Quadrant D Data is divided into 100 sec bins |
 |
 |
| Parameter | Plot |
|---|---|
| CZT HV Monitor | 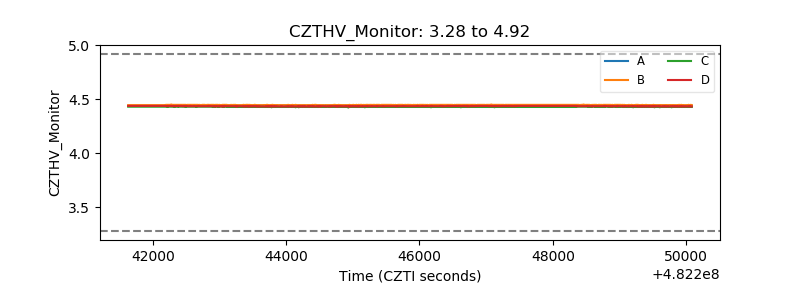 |
| D_VDD | 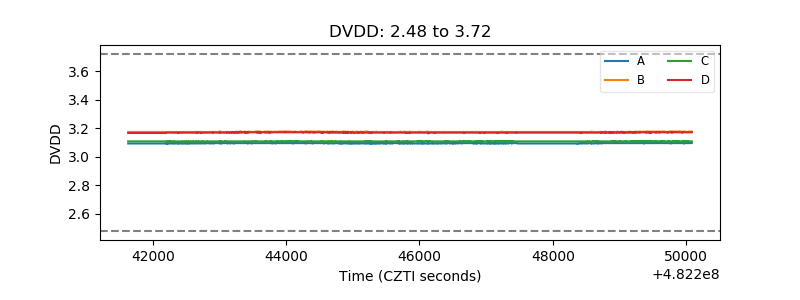 |
| Temperature 1 | 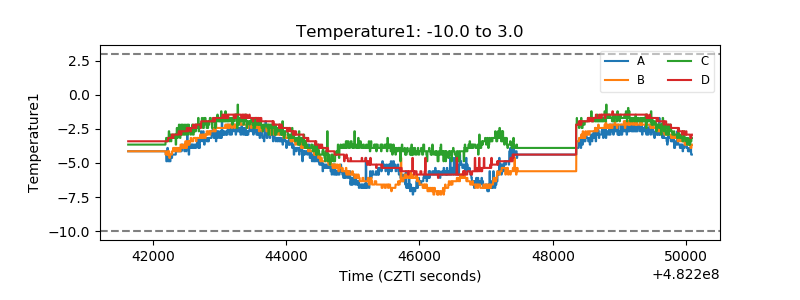 |
| Veto HV Monitor | 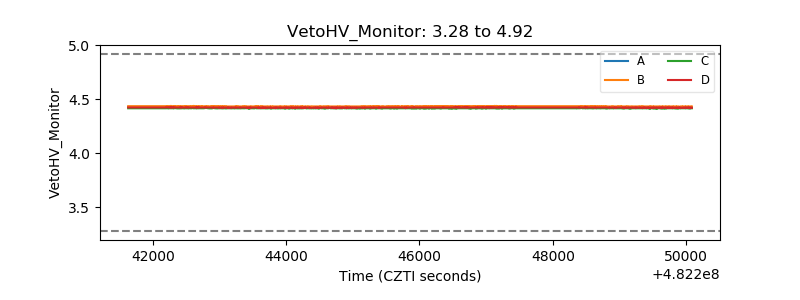 |
| Veto LLD | 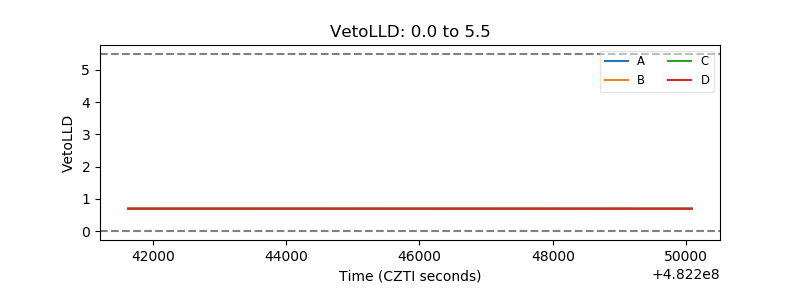 |
| Alpha Counter | 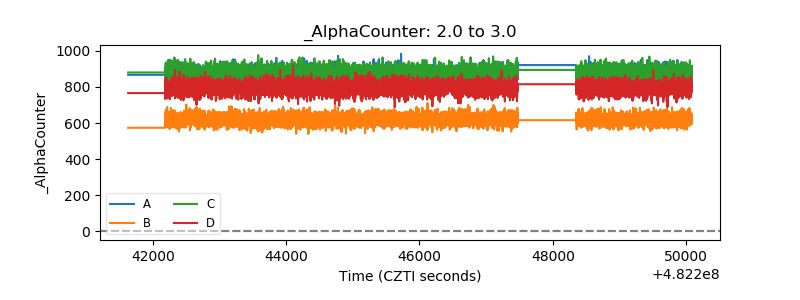 |
| _CPM_Rate | 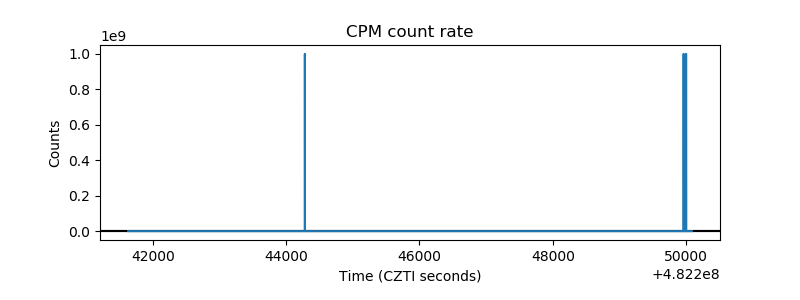 |
| CZT Counter | 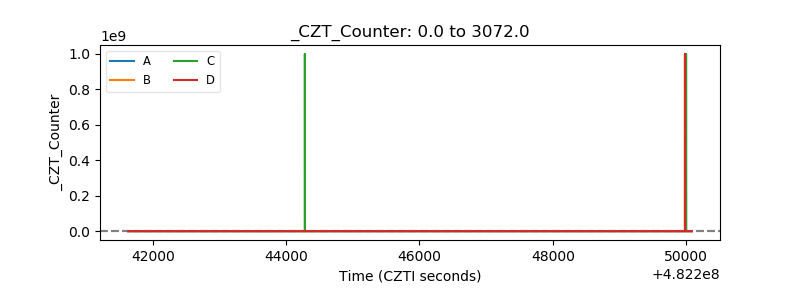 |
| +2.5 Volts monitor | 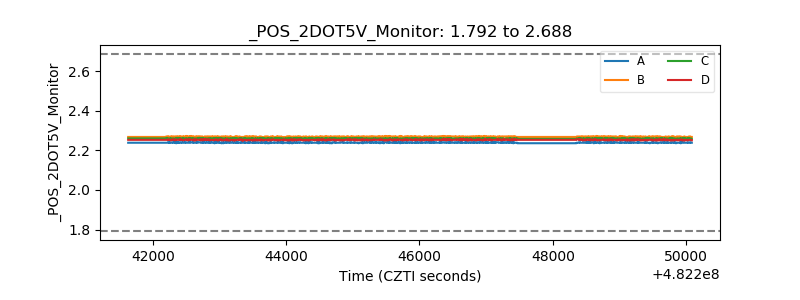 |
| +5 Volts monitor | 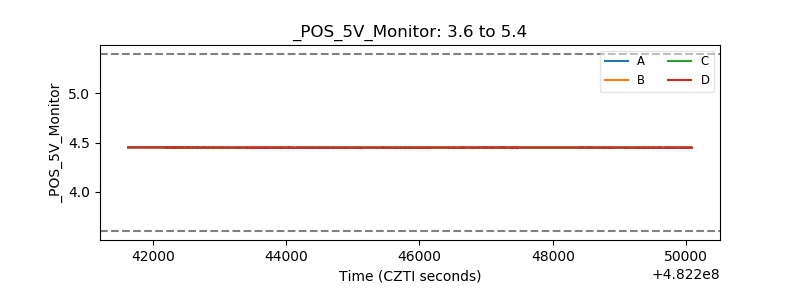 |
| _ROLL_ROT | 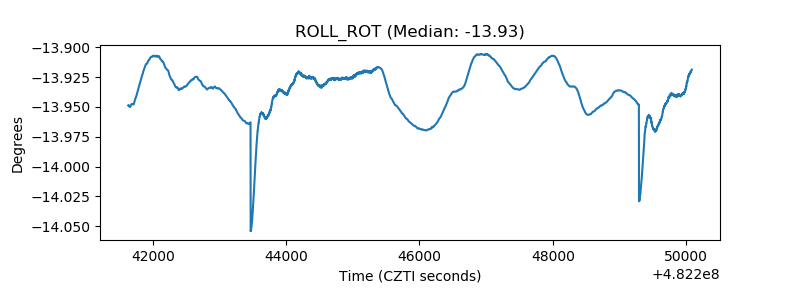 |
| _Roll_DEC | 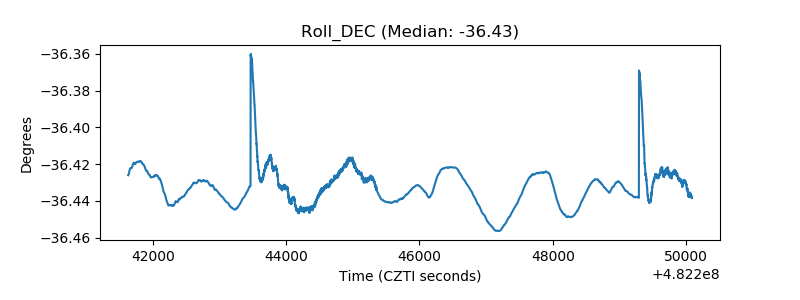 |
| _Roll_RA | 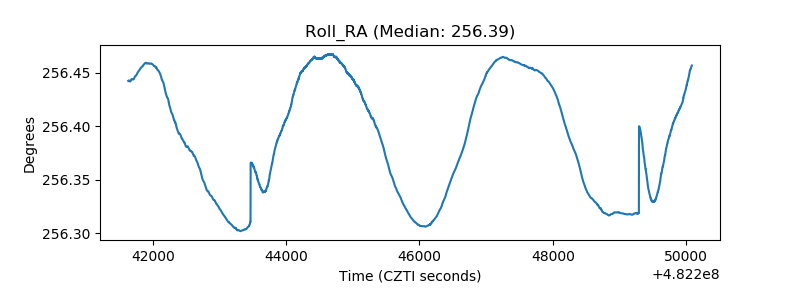 |
| Veto Counter | 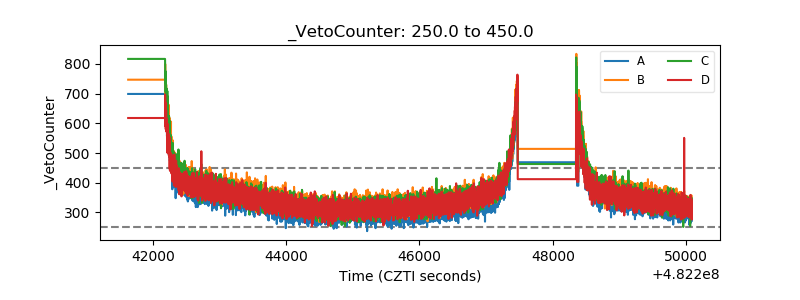 |