| Param | Original file | Final file |
|---|---|---|
| Filename | modeM0/AS1A13_037T05_9000006460_51614cztM0_level2.fits | modeM0/AS1A13_037T05_9000006460_51614cztM0_level2_quad_clean.evt |
| Size (bytes) | 558,345,600 | 102,496,320 |
| Size | 532.5 MB | 97.7 MB |
| Events in quadrant A | 5,533,035 | 647,810 |
| Events in quadrant B | 5,045,197 | 710,422 |
| Events in quadrant C | 4,325,852 | 650,495 |
| Events in quadrant D | 5,205,627 | 593,694 |
| Mode M9 | |||
|---|---|---|---|
| Quadrant | BADHDUFLAG | Total packets | Discarded packets |
| A | 0 | 7 | 0 |
| B | 0 | 8 | 0 |
| C | 0 | 8 | 0 |
| D | 0 | 8 | 0 |
| Mode M0 | |||
|---|---|---|---|
| Quadrant | BADHDUFLAG | Total packets | Discarded packets |
| A | 0 | 21333 | 2 |
| B | 0 | 19856 | 2 |
| C | 0 | 18015 | 2 |
| D | 0 | 20696 | 2 |
| Mode SS | |||
|---|---|---|---|
| Quadrant | BADHDUFLAG | Total packets | Discarded packets |
| A | 0 | 146 | 0 |
| B | 0 | 146 | 0 |
| C | 0 | 146 | 0 |
| D | 0 | 146 | 0 |
| Quadrant | Total seconds | Saturated seconds | Saturation percentage |
|---|---|---|---|
| A | 7198 | 547 | 7.599333% |
| B | 7198 | 488 | 6.779661% |
| C | 7198 | 254 | 3.528758% |
| D | 7198 | 462 | 6.418450% |
Noise dominated data is calculated using 1-second bins in cleaned event files. If a bin has >2000 counts, and if more than 50% of those come from <1% of pixels, then it is considered to be noise-dominated and hence unusable.
| Quadrant | # 1 sec bins | Bins with >0 counts | Bins with >2000 counts | High rate bins dominated by noise | Noise dominated (total time) | Noise dominated (detector-on time) | Marked lightcurve |
|---|---|---|---|---|---|---|---|
| A | 7818 | 7198 | 412 | 412 | 5.27% | 5.72% | 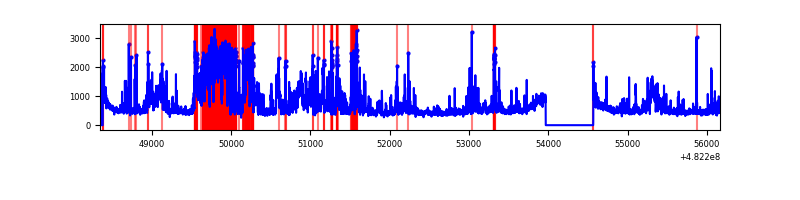 |
| B | 7818 | 7198 | 258 | 258 | 3.30% | 3.58% | 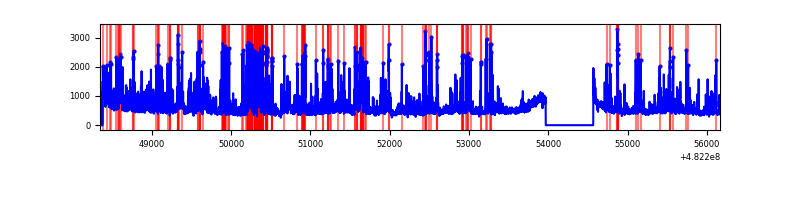 |
| C | 7818 | 7198 | 173 | 173 | 2.21% | 2.40% | 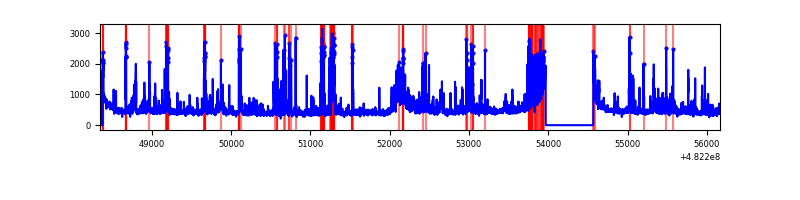 |
| D | 7818 | 7199 | 433 | 433 | 5.54% | 6.01% | 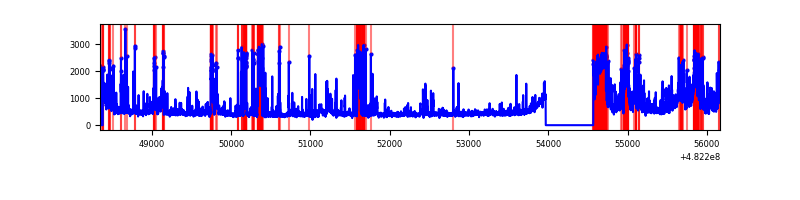 |
Top three noisy pixels from each quadrant. If the there are fewer than three noisy pixels in the level2.evt file, extra rows are filled as -1
| Pixel properties | Quadrant properties | ||||||
|---|---|---|---|---|---|---|---|
| Quadrant | DetID | PixID | Counts | Sigma | Mean | Median | Sigma |
| A | 4 | 175 | 1242211 | 6472.9 | 790 | 772 | 191.8 |
| A | 12 | 3 | 406013 | 2112.94 | 790 | 772 | 191.8 |
| A | 12 | 250 | 197085 | 1023.58 | 790 | 772 | 191.8 |
| B | 1 | 223 | 479046 | 2842.5 | 783 | 756 | 168.3 |
| B | 5 | 185 | 324820 | 1925.93 | 783 | 756 | 168.3 |
| B | 5 | 172 | 287644 | 1704.99 | 783 | 756 | 168.3 |
| C | 0 | 209 | 703586 | 3349.93 | 769 | 763 | 209.8 |
| C | 13 | 3 | 239085 | 1135.94 | 769 | 763 | 209.8 |
| C | 12 | 112 | 152594 | 723.68 | 769 | 763 | 209.8 |
| D | 15 | 174 | 535217 | 2571.83 | 756 | 730 | 207.8 |
| D | 1 | 3 | 443069 | 2128.43 | 756 | 730 | 207.8 |
| D | 8 | 176 | 335971 | 1613.1 | 756 | 730 | 207.8 |
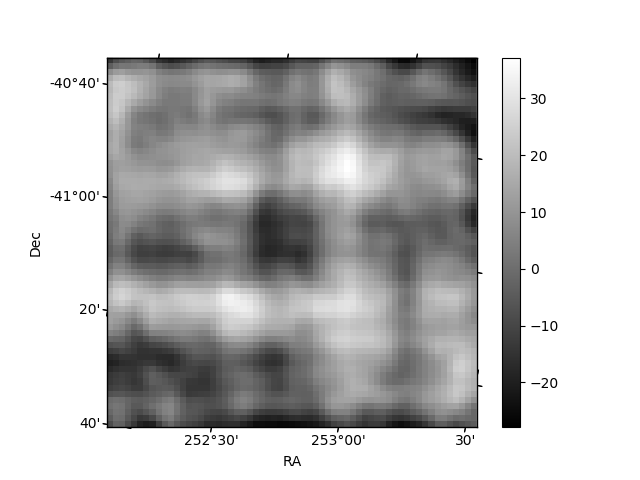
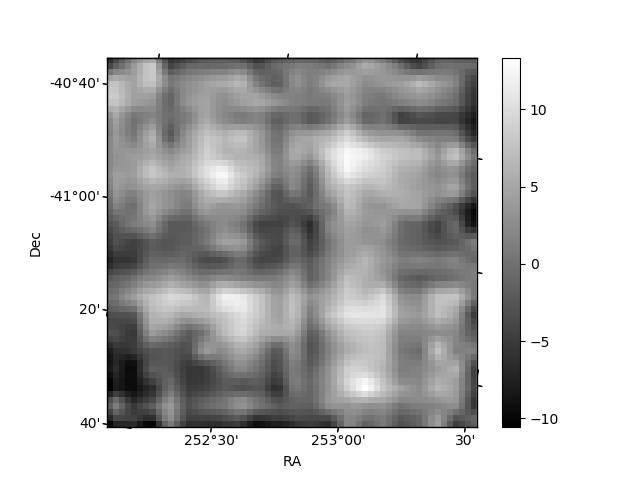
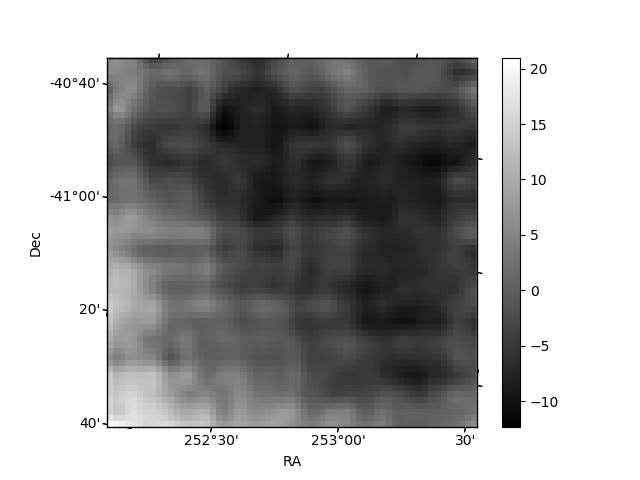
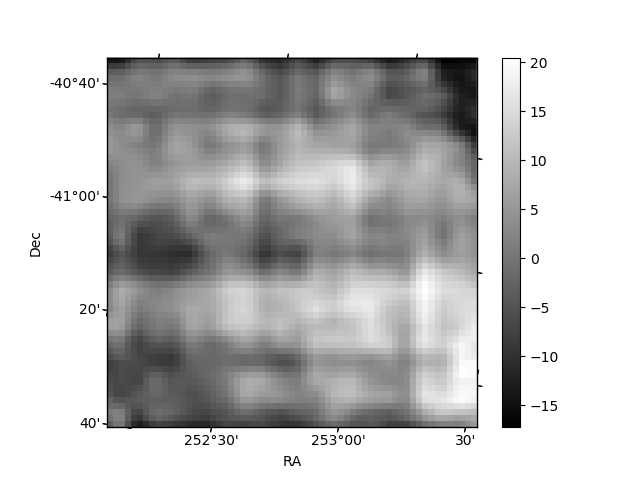
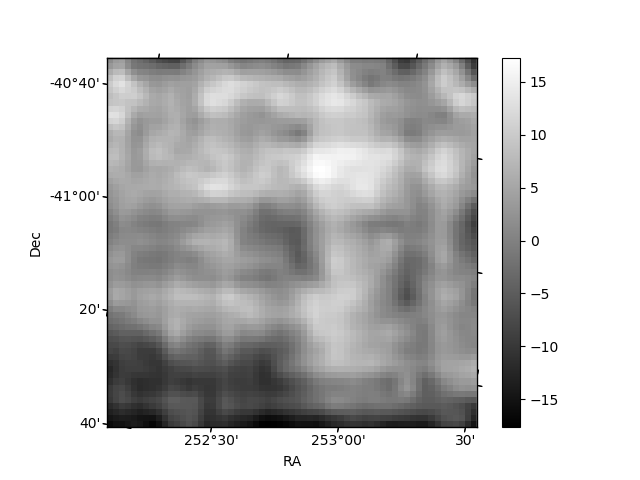
Histogram calculated using DETX and DETY for each event in the final _common_clean file
| Quadrant A | 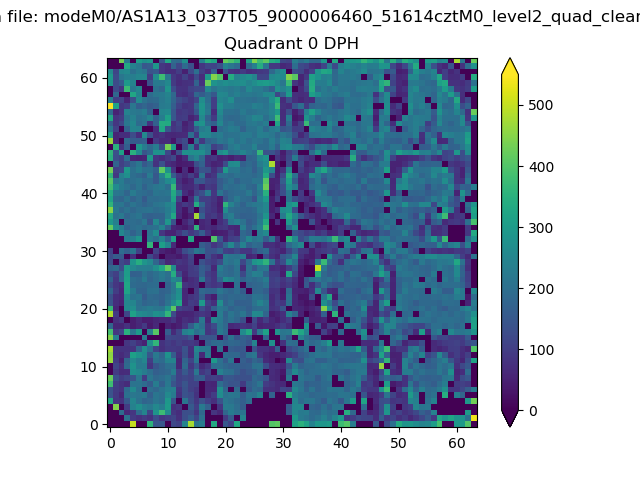 |
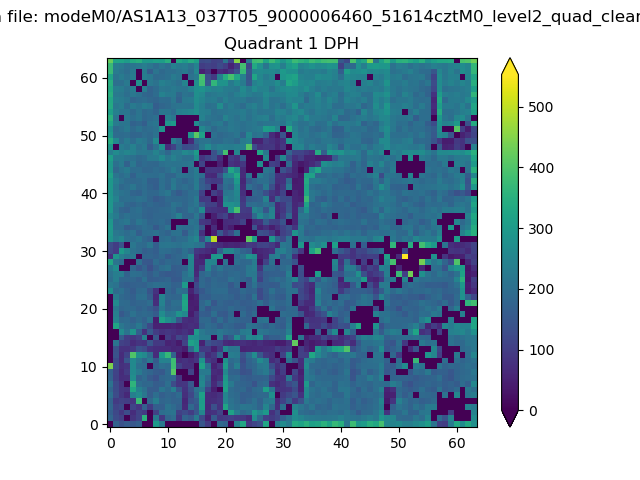 |
Quadrant B |
|---|---|---|---|
| Quadrant D | 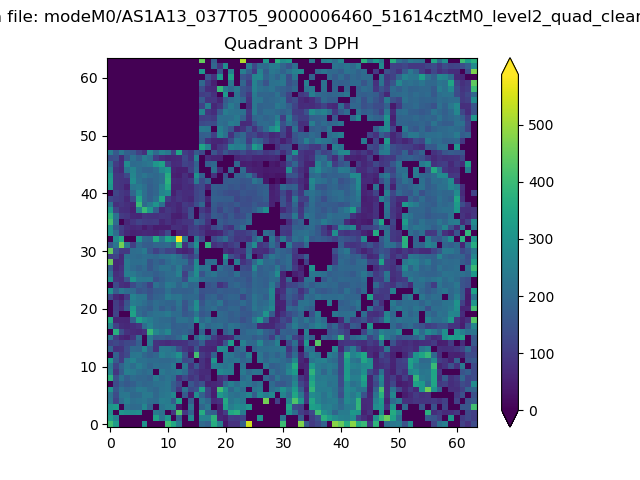 |
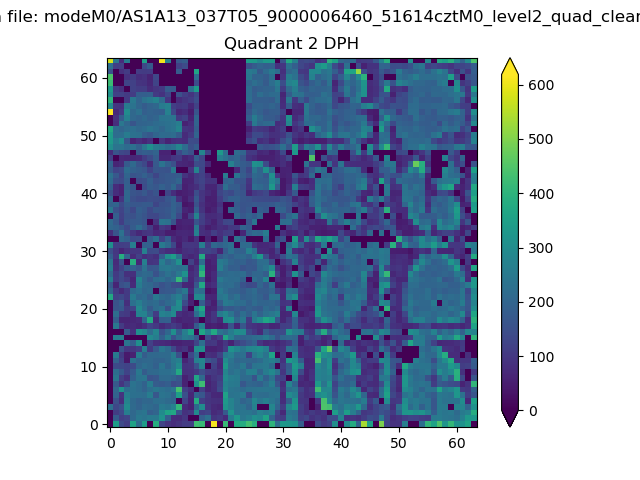 |
Quadrant C |
| Plot type | Count rate plots | Images |
|---|---|---|
| Comparison with Poisson distribution Blue bars denote a histogram of data divided into 1 sec bins. Red curve is a Poisson curve with rate = median count rate of data. |
 |
 |
| Quadrant-wise count rates Data is divided into 100 sec bins |
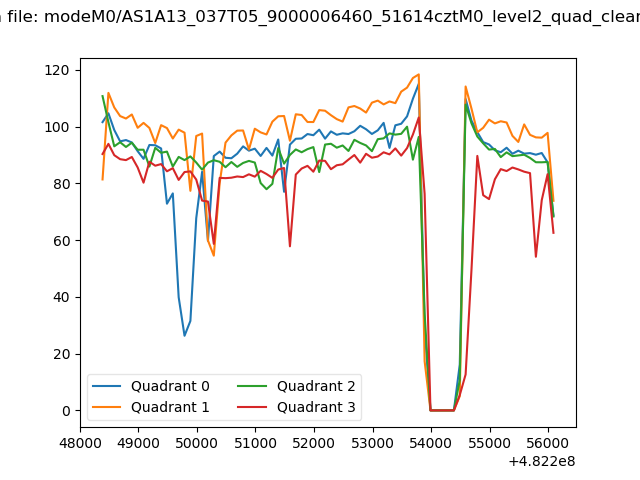 |
|
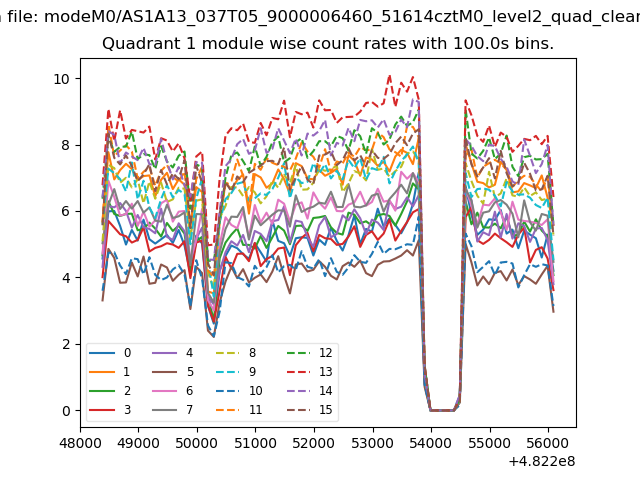
| Module-wise count rates for Quadrant A Data is divided into 100 sec bins |
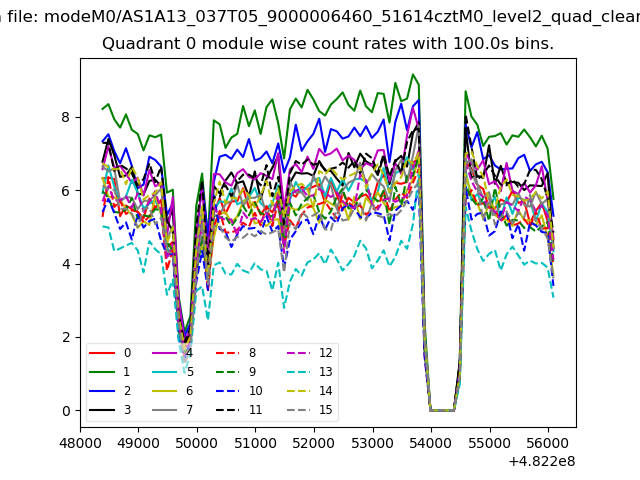 |
 |
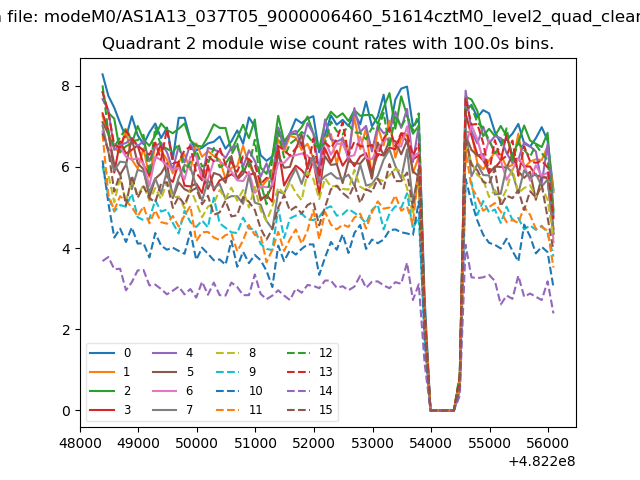
| Module-wise count rates for Quadrant B Data is divided into 100 sec bins |
 |
 |
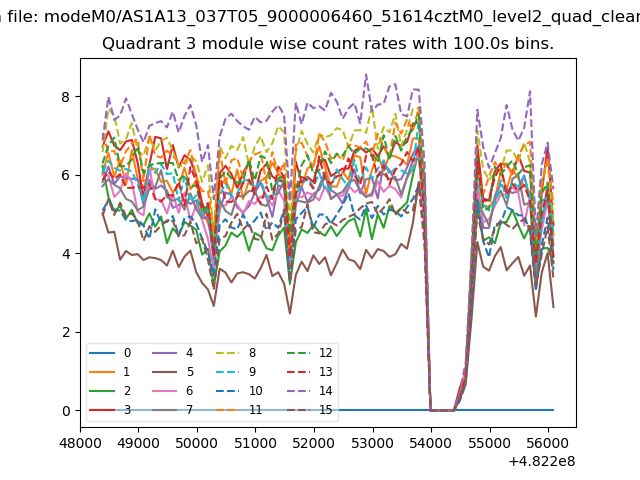
| Module-wise count rates for Quadrant C Data is divided into 100 sec bins |
 |
 |
| Module-wise count rates for Quadrant D Data is divided into 100 sec bins |
 |
 |
| Parameter | Plot |
|---|---|
| CZT HV Monitor | 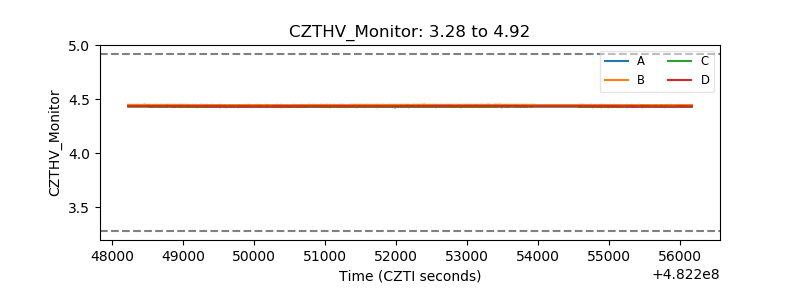 |
| D_VDD | 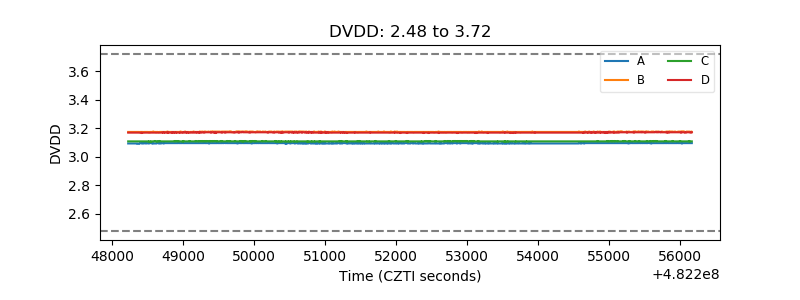 |
| Temperature 1 | 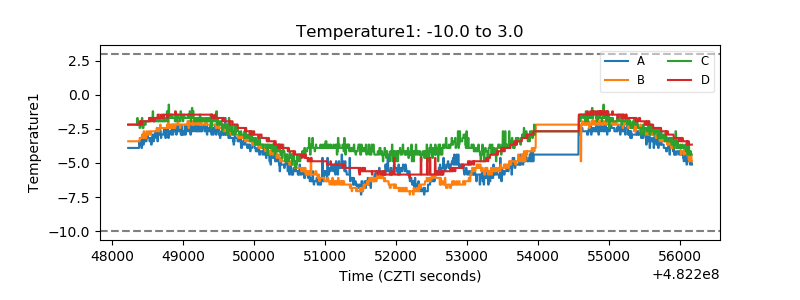 |
| Veto HV Monitor | 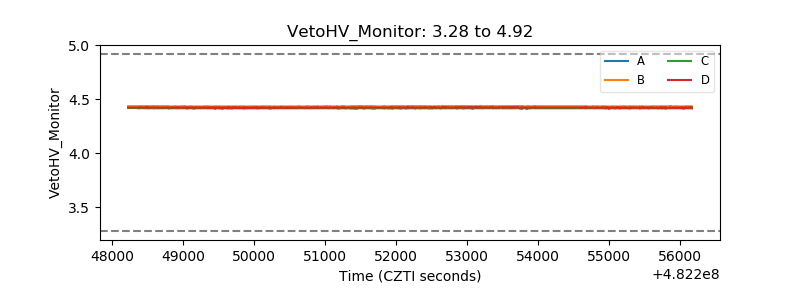 |
| Veto LLD | 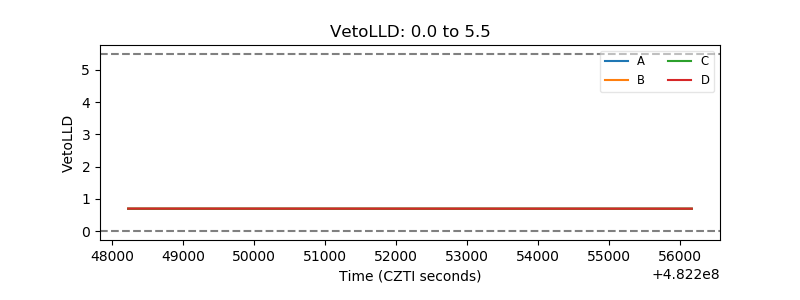 |
| Alpha Counter | 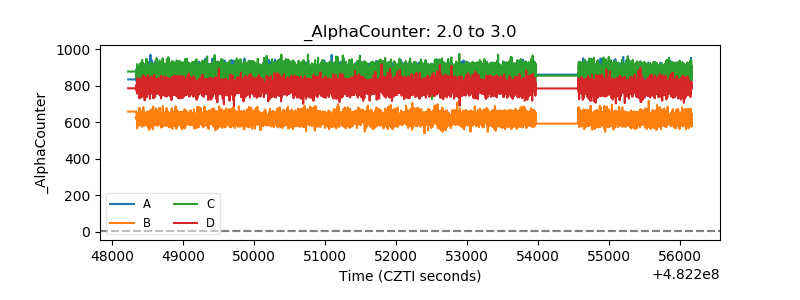 |
| _CPM_Rate | 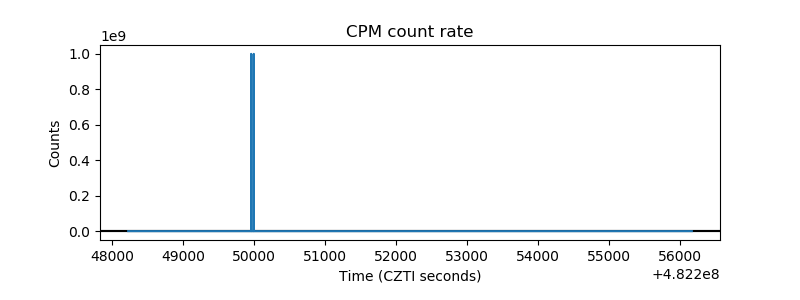 |
| CZT Counter | 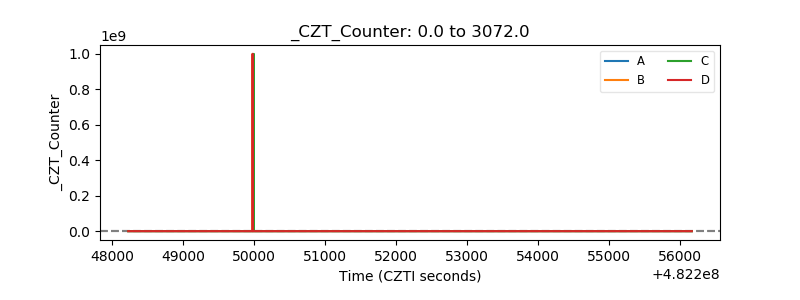 |
| +2.5 Volts monitor | 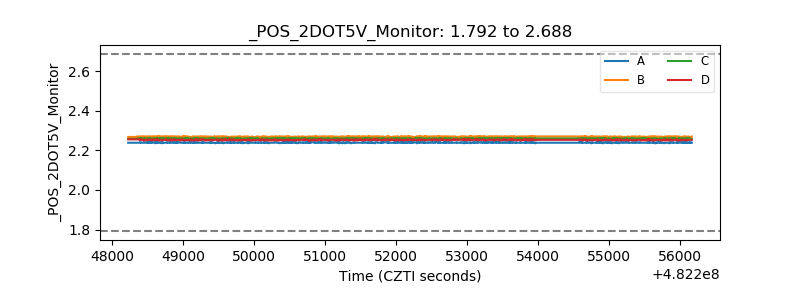 |
| +5 Volts monitor | 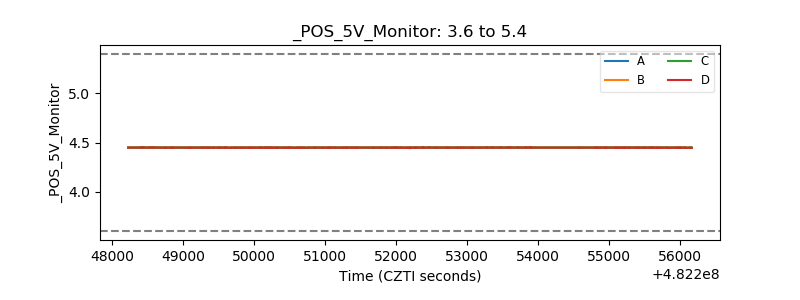 |
| _ROLL_ROT | 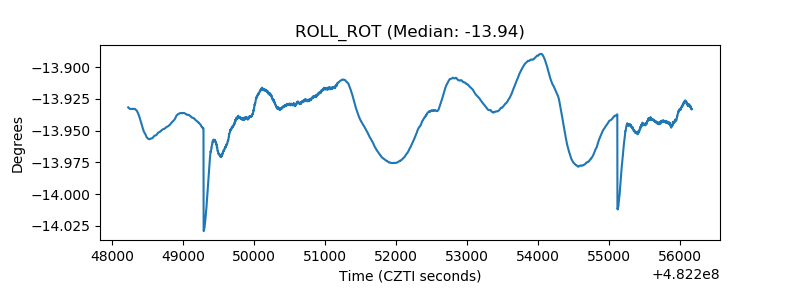 |
| _Roll_DEC | 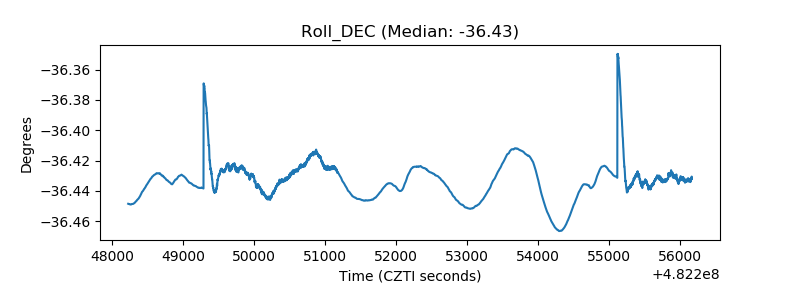 |
| _Roll_RA | 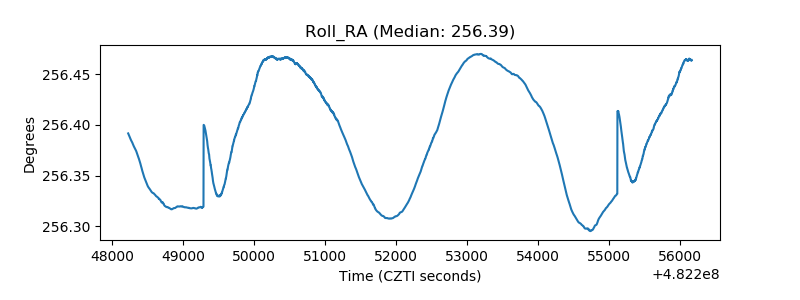 |
| Veto Counter | 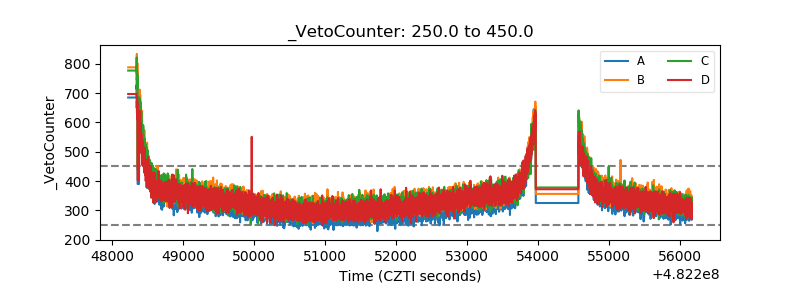 |