| Param | Original file | Final file |
|---|---|---|
| Filename | modeM0/AS1A13_037T05_9000006460_51615cztM0_level2.fits | modeM0/AS1A13_037T05_9000006460_51615cztM0_level2_quad_clean.evt |
| Size (bytes) | 600,621,120 | 114,624,000 |
| Size | 572.8 MB | 109.3 MB |
| Events in quadrant A | 4,730,976 | 752,497 |
| Events in quadrant B | 4,850,203 | 805,185 |
| Events in quadrant C | 4,859,277 | 721,913 |
| Events in quadrant D | 7,170,924 | 633,868 |
| Mode M9 | |||
|---|---|---|---|
| Quadrant | BADHDUFLAG | Total packets | Discarded packets |
| A | 0 | 6 | 0 |
| B | 0 | 6 | 0 |
| C | 0 | 6 | 0 |
| D | 0 | 6 | 0 |
| Mode M0 | |||
|---|---|---|---|
| Quadrant | BADHDUFLAG | Total packets | Discarded packets |
| A | 0 | 19727 | 2 |
| B | 0 | 19908 | 1 |
| C | 0 | 20301 | 1 |
| D | 0 | 26934 | 1 |
| Mode SS | |||
|---|---|---|---|
| Quadrant | BADHDUFLAG | Total packets | Discarded packets |
| A | 0 | 162 | 0 |
| B | 0 | 162 | 0 |
| C | 0 | 162 | 0 |
| D | 0 | 162 | 0 |
| Quadrant | Total seconds | Saturated seconds | Saturation percentage |
|---|---|---|---|
| A | 8015 | 210 | 2.620087% |
| B | 8016 | 369 | 4.603293% |
| C | 8016 | 295 | 3.680140% |
| D | 8016 | 786 | 9.805389% |
Noise dominated data is calculated using 1-second bins in cleaned event files. If a bin has >2000 counts, and if more than 50% of those come from <1% of pixels, then it is considered to be noise-dominated and hence unusable.
| Quadrant | # 1 sec bins | Bins with >0 counts | Bins with >2000 counts | High rate bins dominated by noise | Noise dominated (total time) | Noise dominated (detector-on time) | Marked lightcurve |
|---|---|---|---|---|---|---|---|
| A | 8615 | 8015 | 58 | 58 | 0.67% | 0.72% | 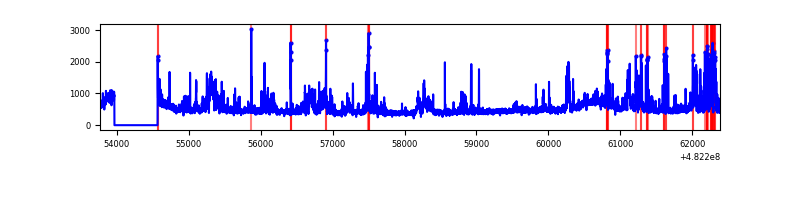 |
| B | 8616 | 8016 | 123 | 123 | 1.43% | 1.53% | 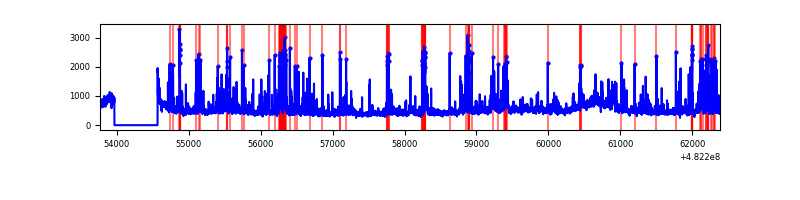 |
| C | 8616 | 8016 | 211 | 211 | 2.45% | 2.63% | 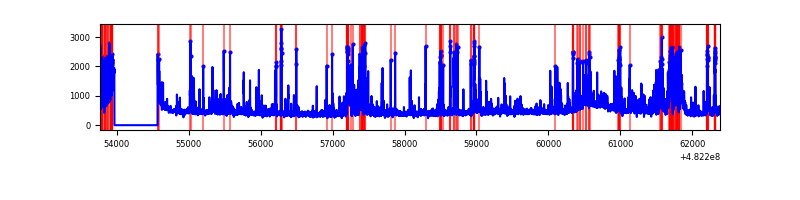 |
| D | 8616 | 8017 | 734 | 734 | 8.52% | 9.16% | 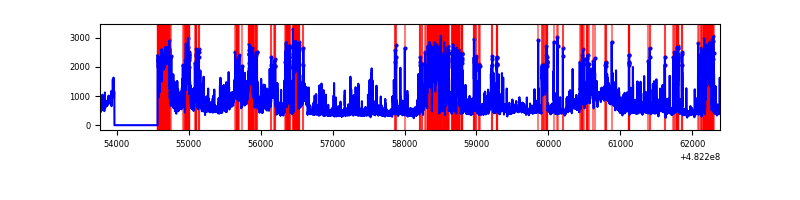 |
Top three noisy pixels from each quadrant. If the there are fewer than three noisy pixels in the level2.evt file, extra rows are filled as -1
| Pixel properties | Quadrant properties | ||||||
|---|---|---|---|---|---|---|---|
| Quadrant | DetID | PixID | Counts | Sigma | Mean | Median | Sigma |
| A | 12 | 250 | 384537 | 1744.84 | 904 | 882 | 219.9 |
| A | 12 | 3 | 321895 | 1459.95 | 904 | 882 | 219.9 |
| A | 4 | 175 | 77151 | 346.87 | 904 | 882 | 219.9 |
| B | 1 | 223 | 309734 | 1602.82 | 894 | 862 | 192.7 |
| B | 0 | 171 | 172832 | 892.4 | 894 | 862 | 192.7 |
| B | 8 | 128 | 137551 | 709.32 | 894 | 862 | 192.7 |
| C | 13 | 3 | 407208 | 1714.62 | 868 | 859 | 237.0 |
| C | 0 | 209 | 405453 | 1707.21 | 868 | 859 | 237.0 |
| C | 15 | 148 | 182396 | 766.01 | 868 | 859 | 237.0 |
| D | 2 | 62 | 1012067 | 4378.61 | 843 | 815 | 231.0 |
| D | 1 | 3 | 523822 | 2264.56 | 843 | 815 | 231.0 |
| D | 12 | 6 | 485218 | 2097.41 | 843 | 815 | 231.0 |
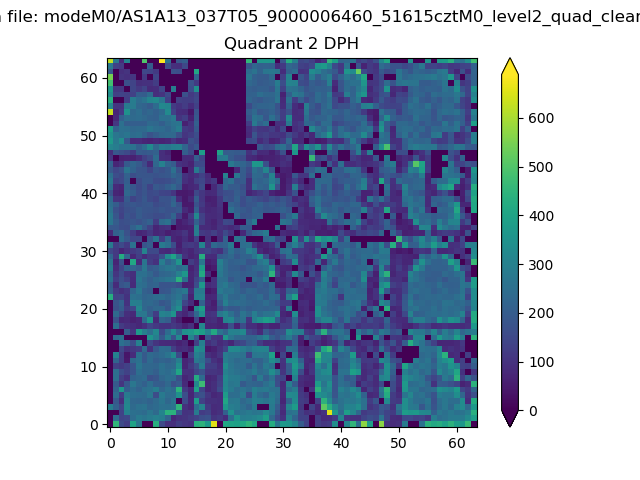
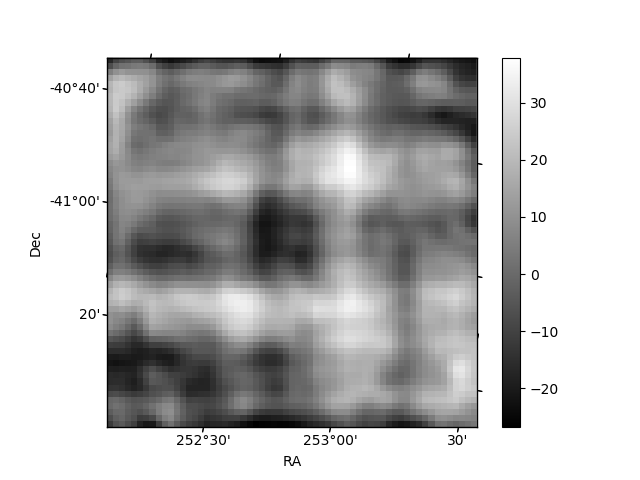
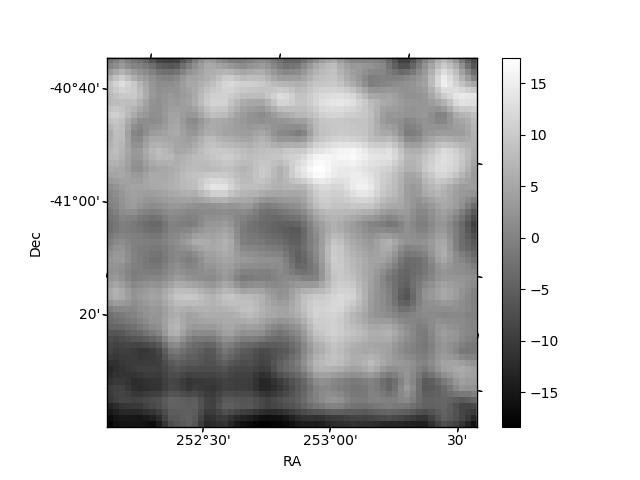
Histogram calculated using DETX and DETY for each event in the final _common_clean file
| Quadrant A | 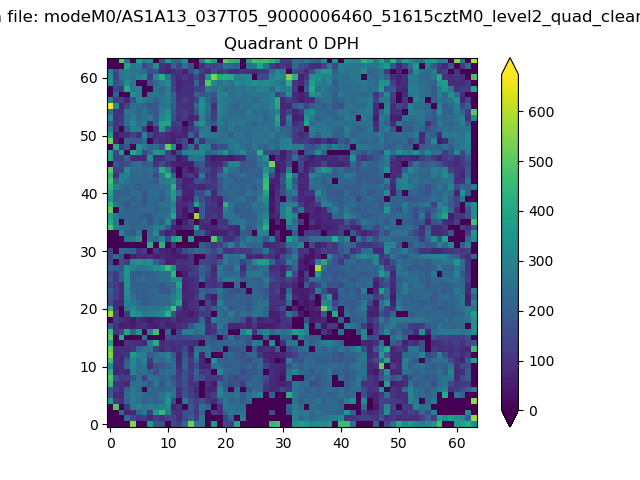 |
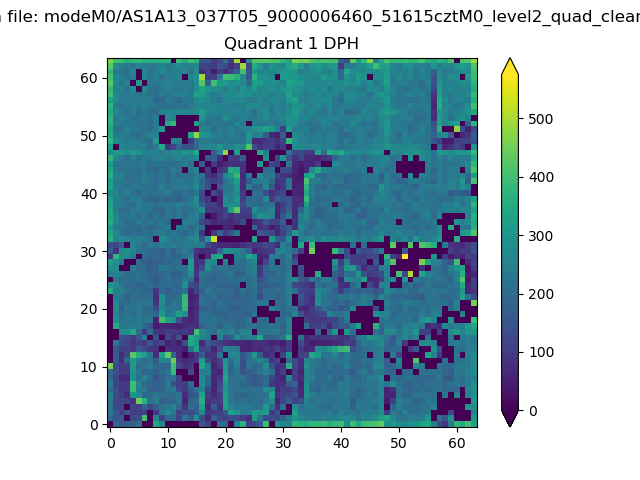 |
Quadrant B |
|---|---|---|---|
| Quadrant D | 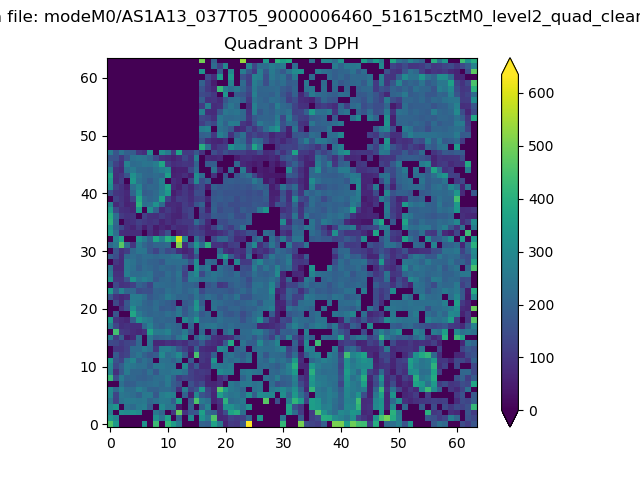 |
 |
Quadrant C |
| Plot type | Count rate plots | Images |
|---|---|---|
| Comparison with Poisson distribution Blue bars denote a histogram of data divided into 1 sec bins. Red curve is a Poisson curve with rate = median count rate of data. |
 |
 |
| Quadrant-wise count rates Data is divided into 100 sec bins |
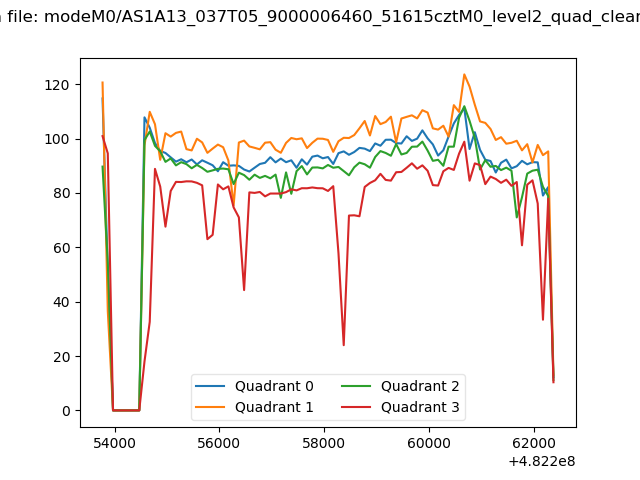 |
|
| Module-wise count rates for Quadrant A Data is divided into 100 sec bins |
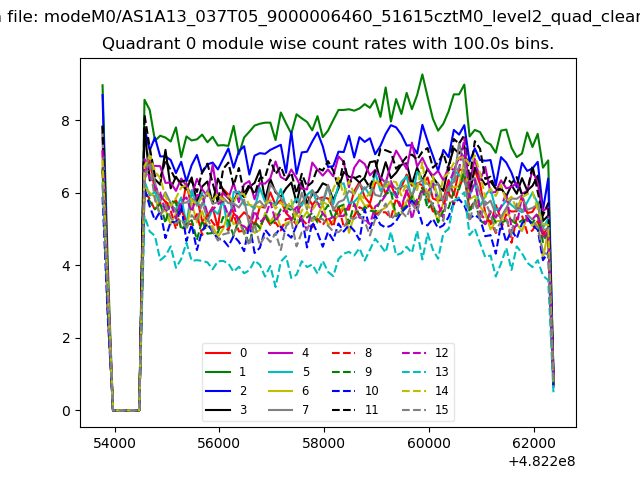 |
 |
| Module-wise count rates for Quadrant B Data is divided into 100 sec bins |
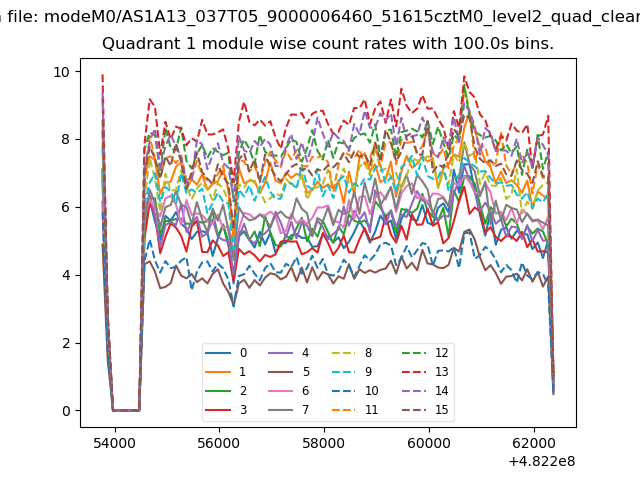 |
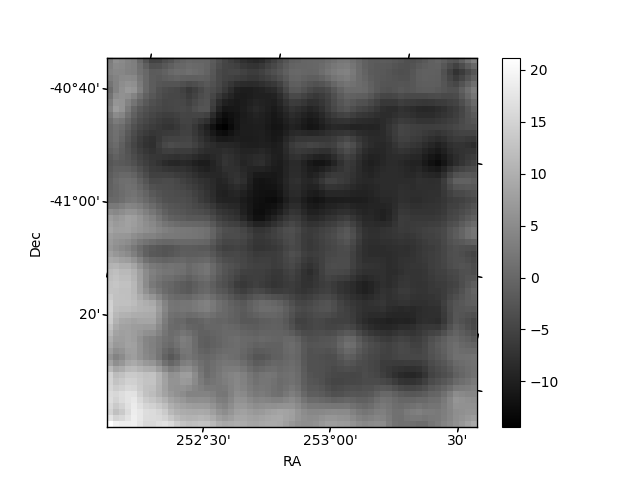 |
| Module-wise count rates for Quadrant C Data is divided into 100 sec bins |
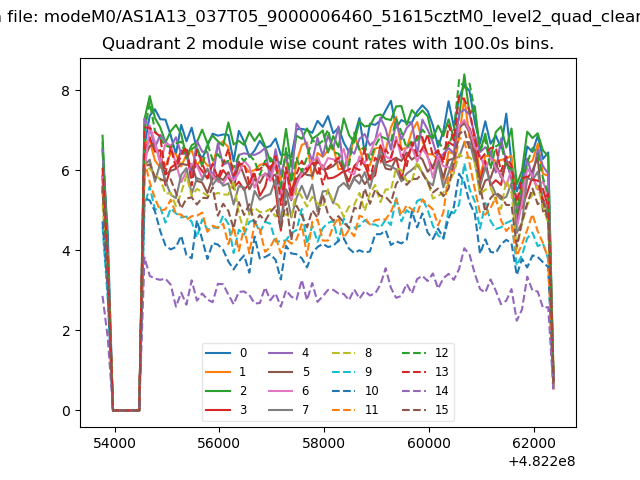 |
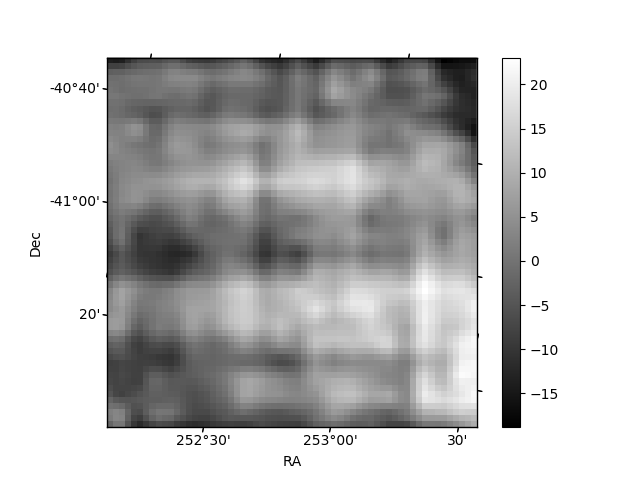 |
| Module-wise count rates for Quadrant D Data is divided into 100 sec bins |
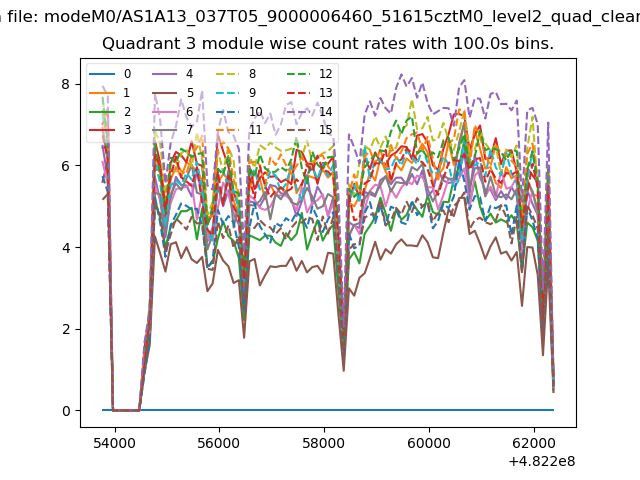 |
 |
| Parameter | Plot |
|---|---|
| CZT HV Monitor |  |
| D_VDD | 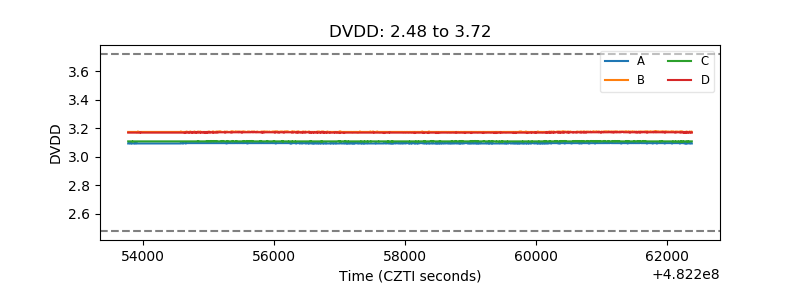 |
| Temperature 1 | 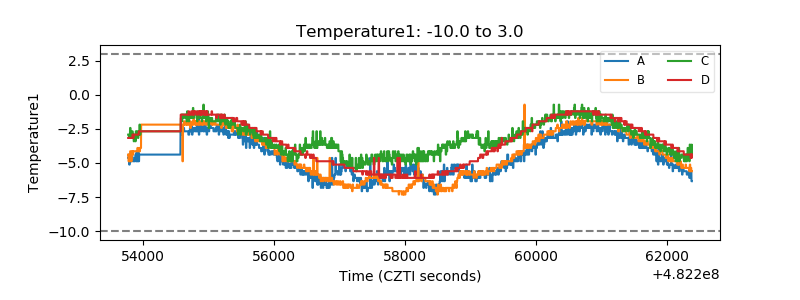 |
| Veto HV Monitor | 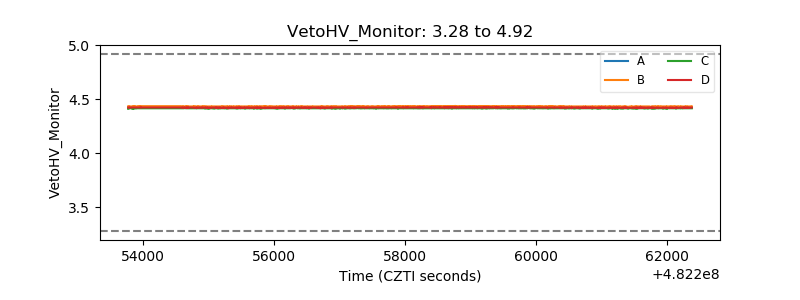 |
| Veto LLD | 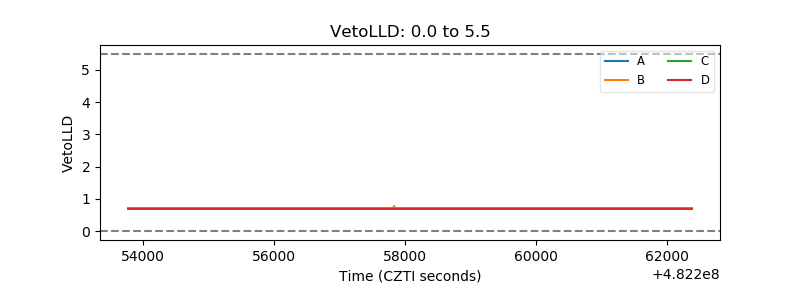 |
| Alpha Counter | 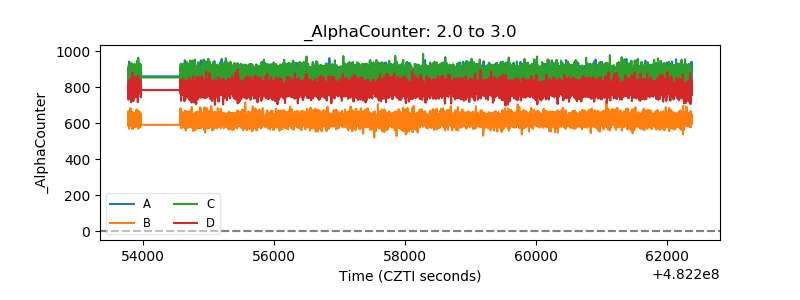 |
| _CPM_Rate | 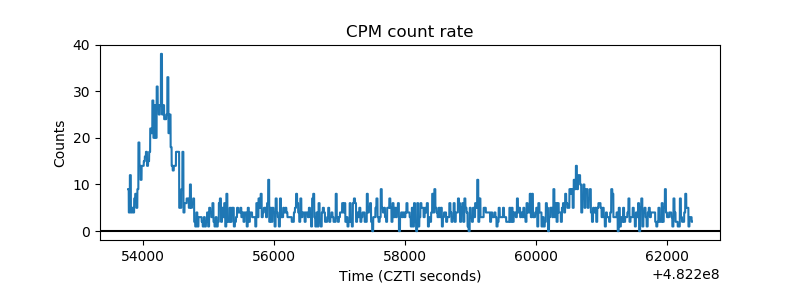 |
| CZT Counter | 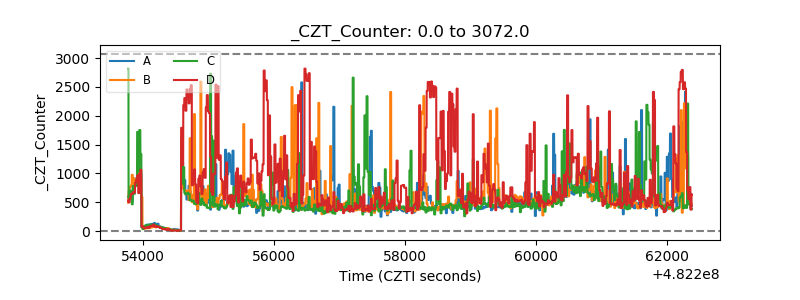 |
| +2.5 Volts monitor | 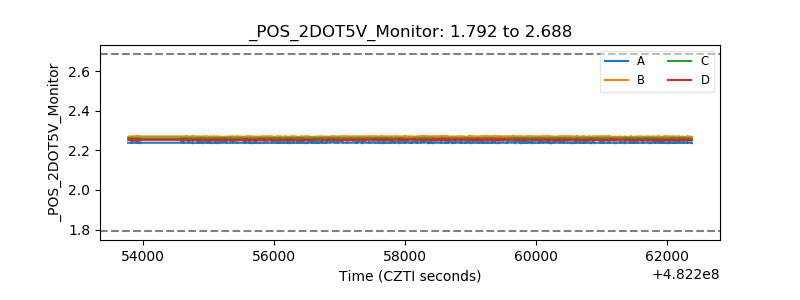 |
| +5 Volts monitor | 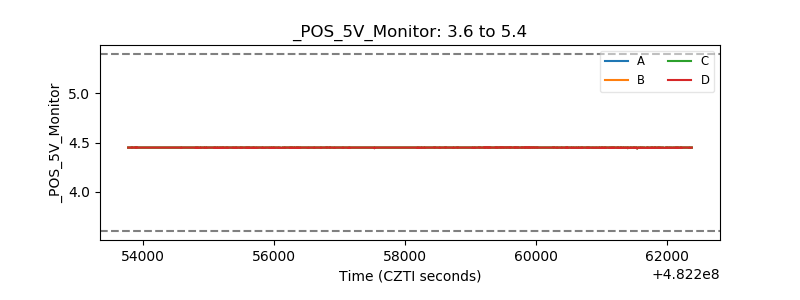 |
| _ROLL_ROT | 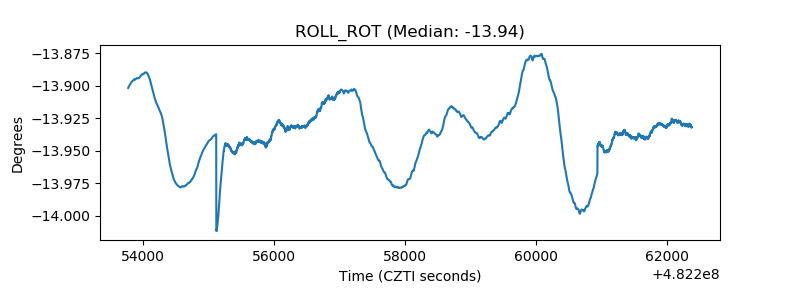 |
| _Roll_DEC | 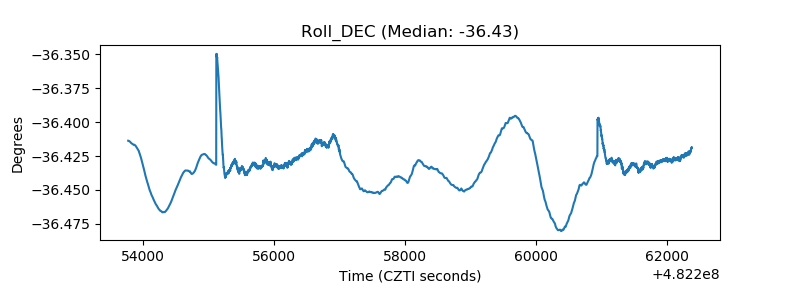 |
| _Roll_RA | 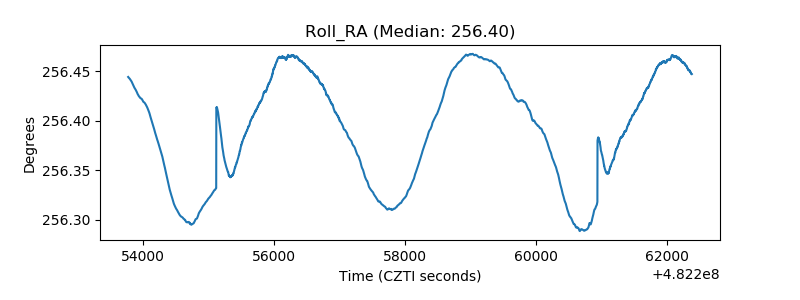 |
| Veto Counter | 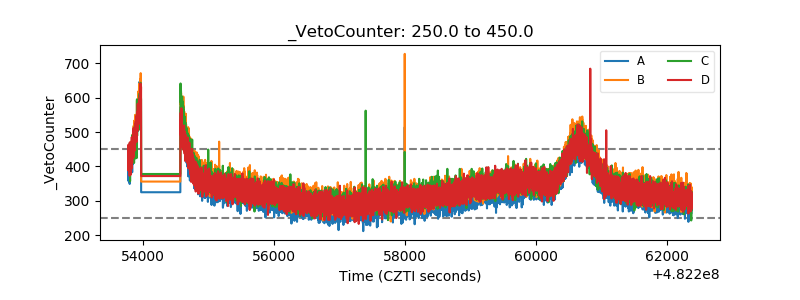 |