| Param | Original file | Final file |
|---|---|---|
| Filename | modeM0/AS1A13_037T05_9000006460_51616cztM0_level2.fits | modeM0/AS1A13_037T05_9000006460_51616cztM0_level2_quad_clean.evt |
| Size (bytes) | 619,367,040 | 111,623,040 |
| Size | 590.7 MB | 106.5 MB |
| Events in quadrant A | 5,321,286 | 727,837 |
| Events in quadrant B | 4,840,930 | 804,396 |
| Events in quadrant C | 4,768,892 | 711,277 |
| Events in quadrant D | 7,378,347 | 582,864 |
| Mode M0 | |||
|---|---|---|---|
| Quadrant | BADHDUFLAG | Total packets | Discarded packets |
| A | 0 | 21290 | 0 |
| B | 0 | 19836 | 0 |
| C | 0 | 20016 | 0 |
| D | 0 | 27408 | 0 |
| Mode SS | |||
|---|---|---|---|
| Quadrant | BADHDUFLAG | Total packets | Discarded packets |
| A | 0 | 160 | 0 |
| B | 0 | 160 | 0 |
| C | 0 | 160 | 0 |
| D | 0 | 160 | 0 |
| Quadrant | Total seconds | Saturated seconds | Saturation percentage |
|---|---|---|---|
| A | 7957 | 385 | 4.838507% |
| B | 7958 | 271 | 3.405378% |
| C | 7958 | 236 | 2.965569% |
| D | 7958 | 1290 | 16.210103% |
Noise dominated data is calculated using 1-second bins in cleaned event files. If a bin has >2000 counts, and if more than 50% of those come from <1% of pixels, then it is considered to be noise-dominated and hence unusable.
| Quadrant | # 1 sec bins | Bins with >0 counts | Bins with >2000 counts | High rate bins dominated by noise | Noise dominated (total time) | Noise dominated (detector-on time) | Marked lightcurve |
|---|---|---|---|---|---|---|---|
| A | 7957 | 7957 | 177 | 177 | 2.22% | 2.22% | 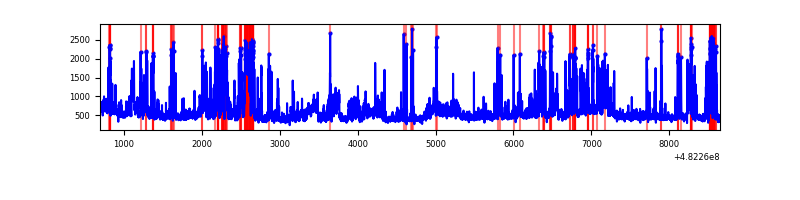 |
| B | 7958 | 7958 | 170 | 170 | 2.14% | 2.14% | 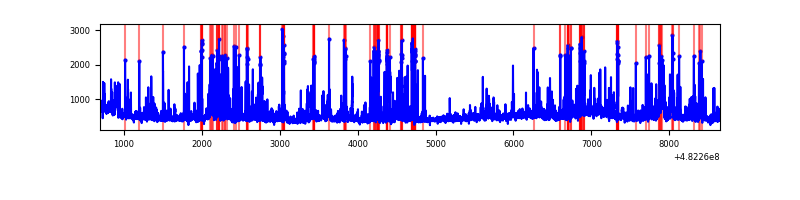 |
| C | 7958 | 7958 | 209 | 209 | 2.63% | 2.63% | 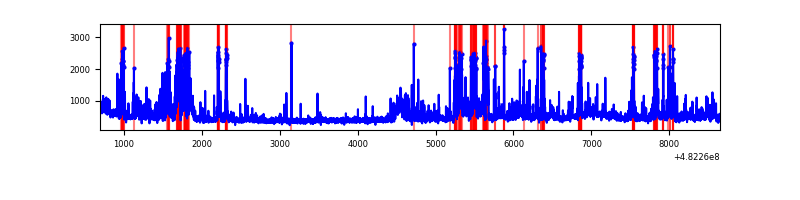 |
| D | 7958 | 7958 | 1219 | 1219 | 15.32% | 15.32% | 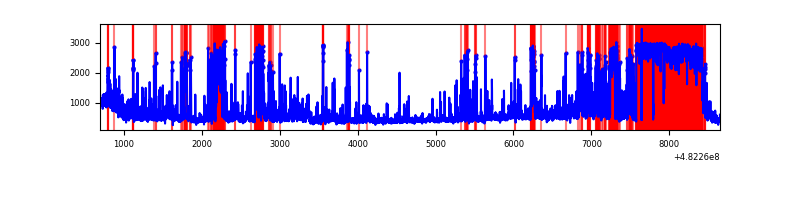 |
Top three noisy pixels from each quadrant. If the there are fewer than three noisy pixels in the level2.evt file, extra rows are filled as -1
| Pixel properties | Quadrant properties | ||||||
|---|---|---|---|---|---|---|---|
| Quadrant | DetID | PixID | Counts | Sigma | Mean | Median | Sigma |
| A | 12 | 250 | 1121326 | 5353.67 | 852 | 831 | 209.3 |
| A | 12 | 3 | 303071 | 1444.09 | 852 | 831 | 209.3 |
| A | 5 | 240 | 136080 | 646.21 | 852 | 831 | 209.3 |
| B | 1 | 223 | 508838 | 2765.3 | 855 | 826 | 183.7 |
| B | 4 | 174 | 213290 | 1156.52 | 855 | 826 | 183.7 |
| B | 5 | 185 | 139636 | 755.6 | 855 | 826 | 183.7 |
| C | 0 | 209 | 433195 | 1901.9 | 833 | 829 | 227.3 |
| C | 15 | 147 | 349649 | 1534.39 | 833 | 829 | 227.3 |
| C | 15 | 148 | 184334 | 807.2 | 833 | 829 | 227.3 |
| D | 7 | 222 | 1784253 | 8453.0 | 757 | 730 | 211.0 |
| D | 12 | 6 | 722164 | 3419.24 | 757 | 730 | 211.0 |
| D | 7 | 159 | 328415 | 1553.06 | 757 | 730 | 211.0 |
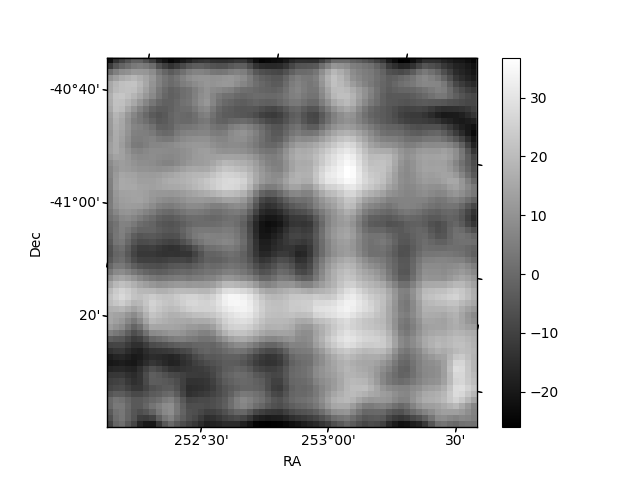
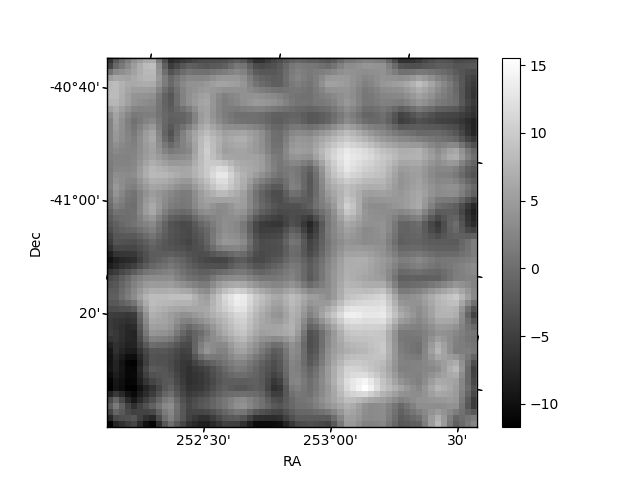
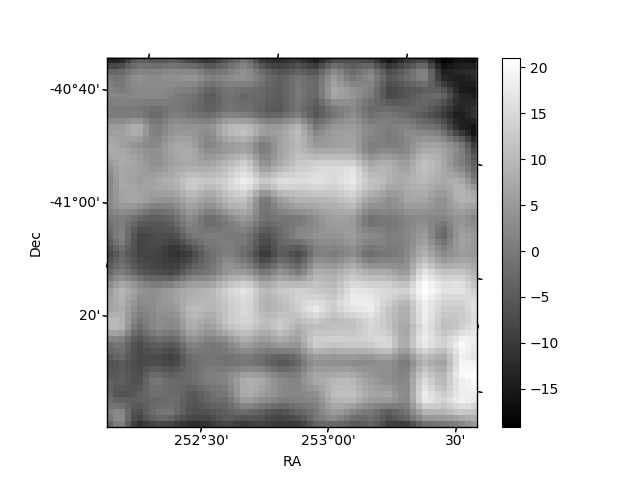
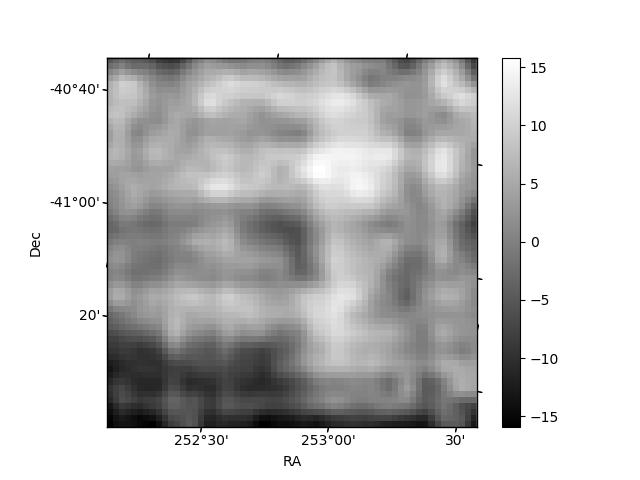
Histogram calculated using DETX and DETY for each event in the final _common_clean file
| Quadrant A | 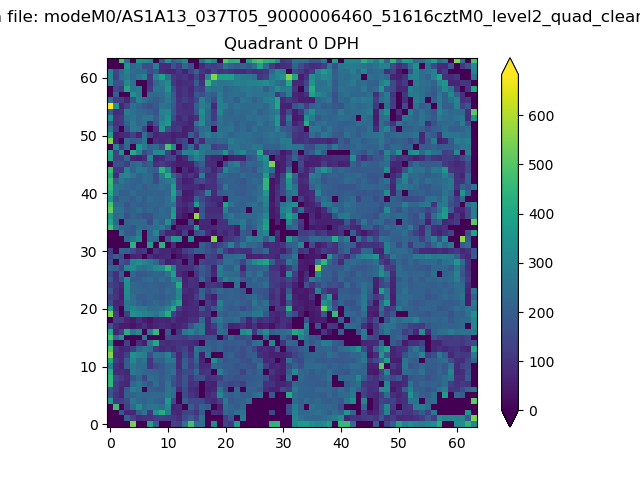 |
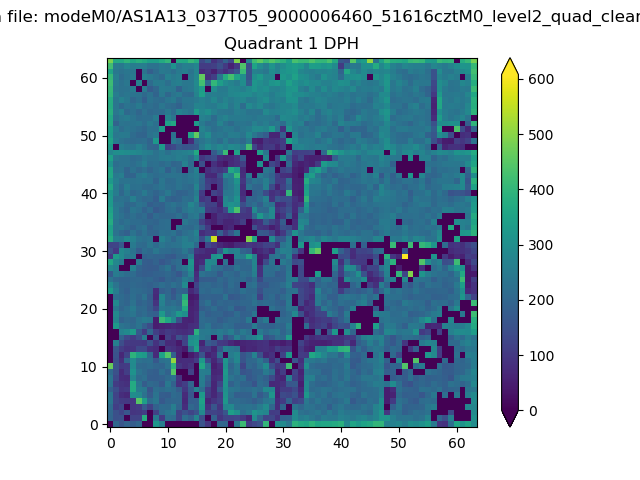 |
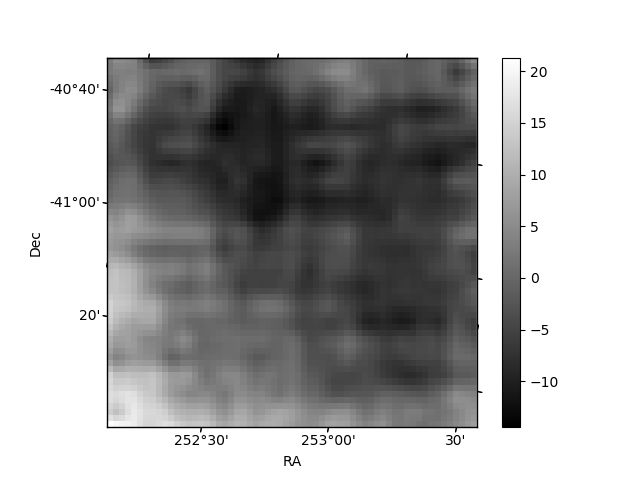
Quadrant B |
|---|---|---|---|
| Quadrant D | 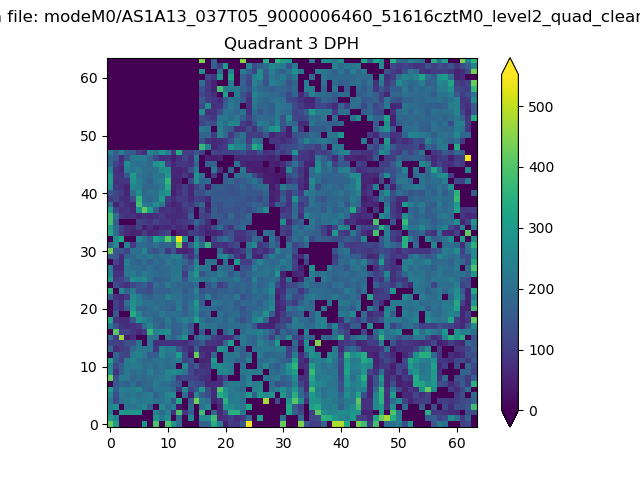 |
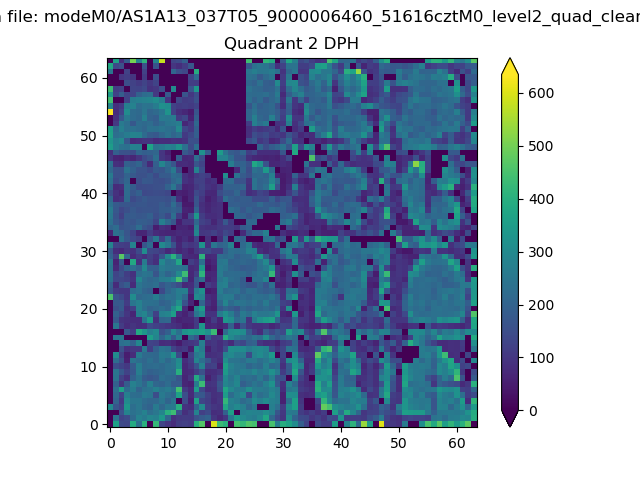 |
Quadrant C |
| Plot type | Count rate plots | Images |
|---|---|---|
| Comparison with Poisson distribution Blue bars denote a histogram of data divided into 1 sec bins. Red curve is a Poisson curve with rate = median count rate of data. |
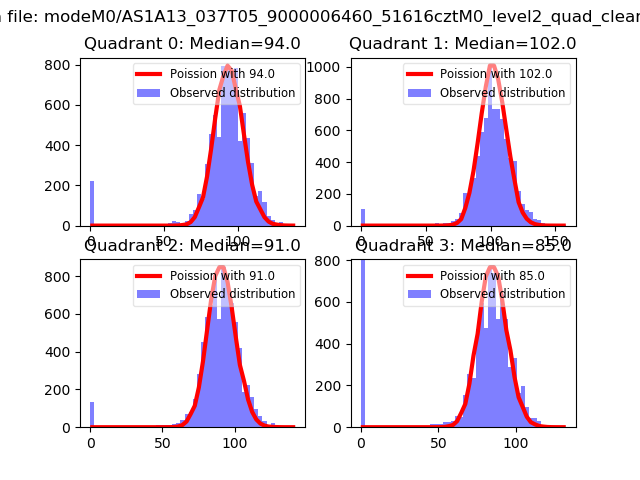 |
 |
| Quadrant-wise count rates Data is divided into 100 sec bins |
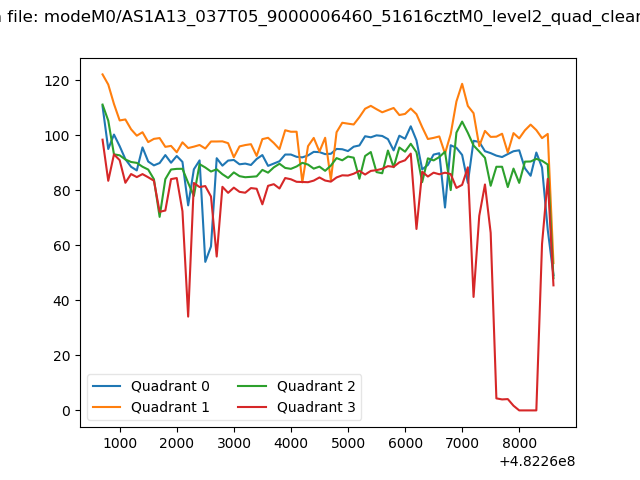 |
|
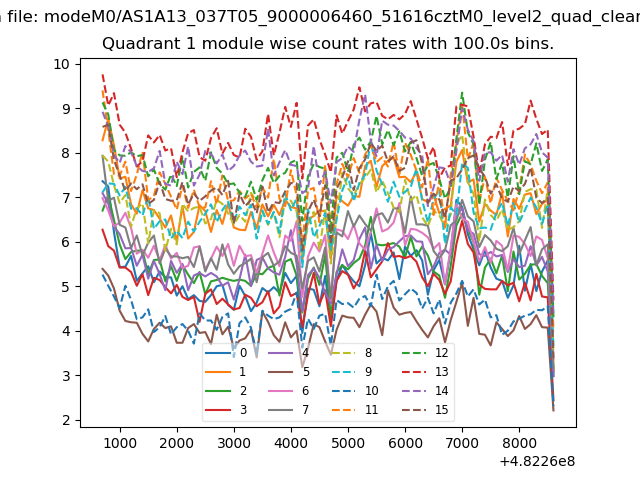
| Module-wise count rates for Quadrant A Data is divided into 100 sec bins |
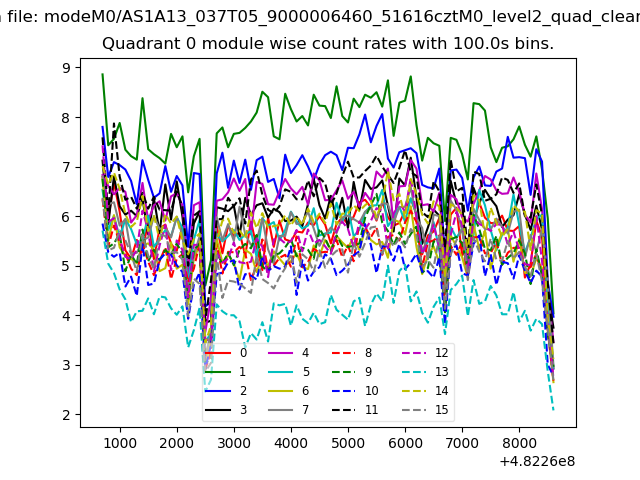 |
 |
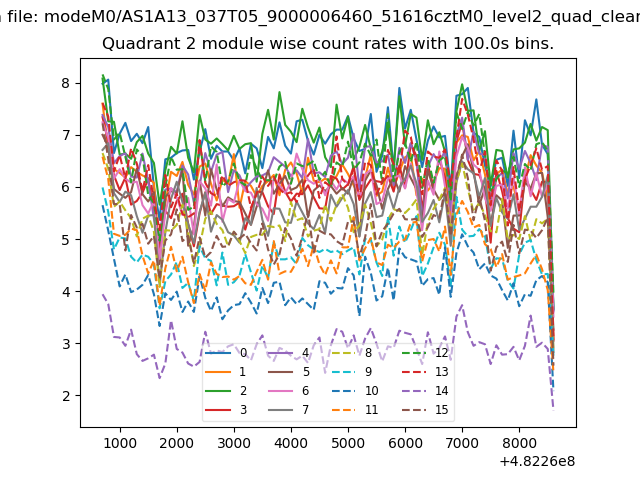
| Module-wise count rates for Quadrant B Data is divided into 100 sec bins |
 |
 |
| Module-wise count rates for Quadrant C Data is divided into 100 sec bins |
 |
 |
| Module-wise count rates for Quadrant D Data is divided into 100 sec bins |
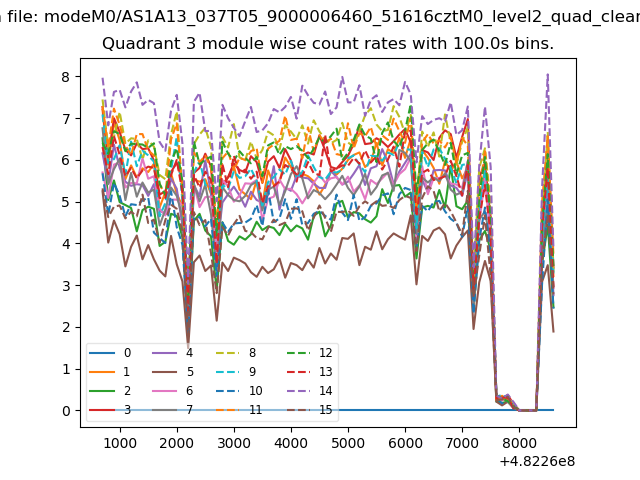 |
 |
| Parameter | Plot |
|---|---|
| CZT HV Monitor | 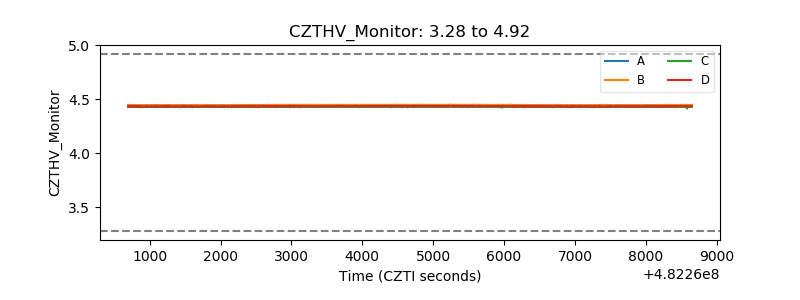 |
| D_VDD | 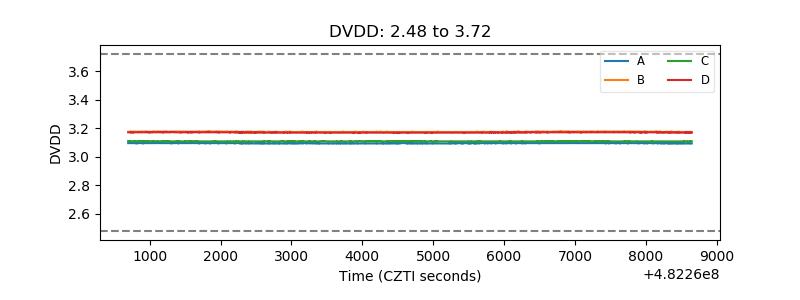 |
| Temperature 1 | 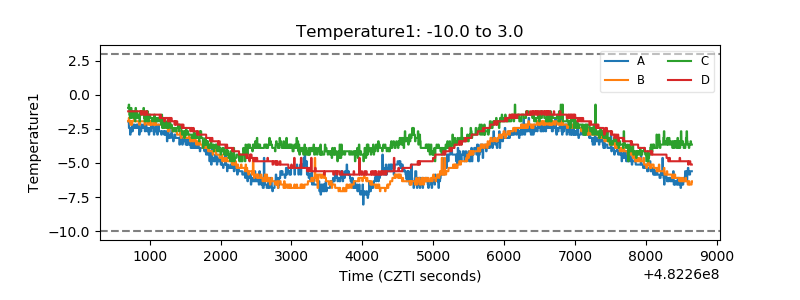 |
| Veto HV Monitor | 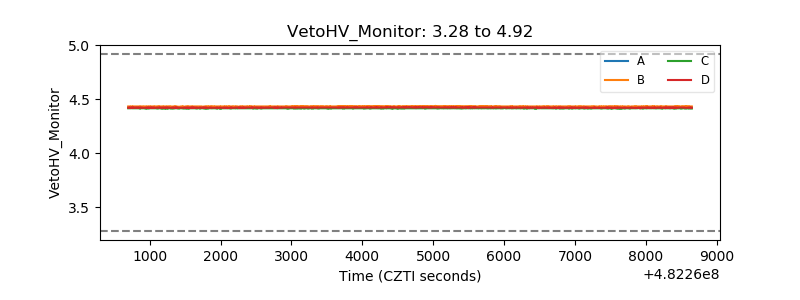 |
| Veto LLD | 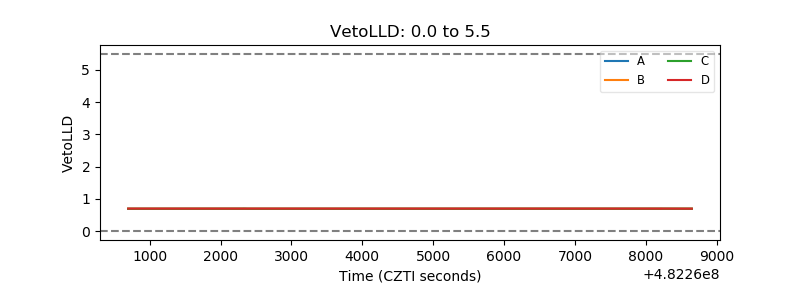 |
| Alpha Counter | 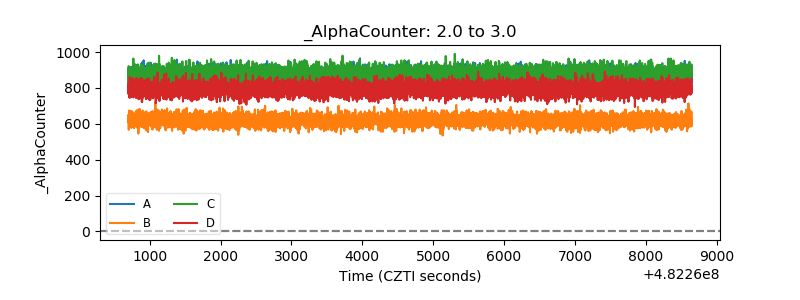 |
| _CPM_Rate | 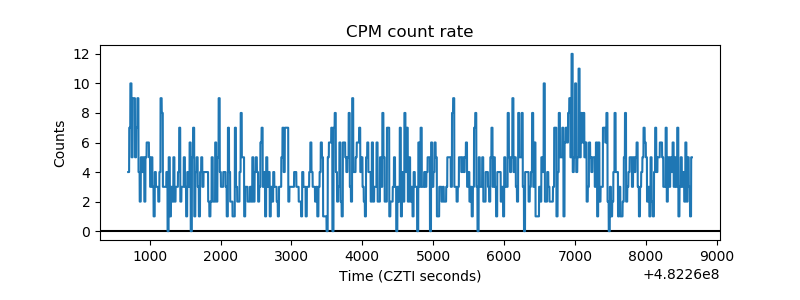 |
| CZT Counter | 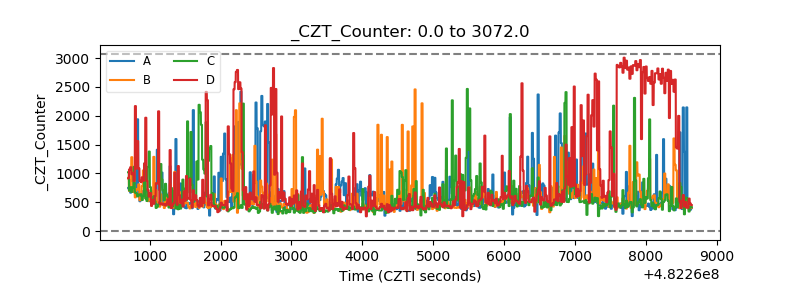 |
| +2.5 Volts monitor | 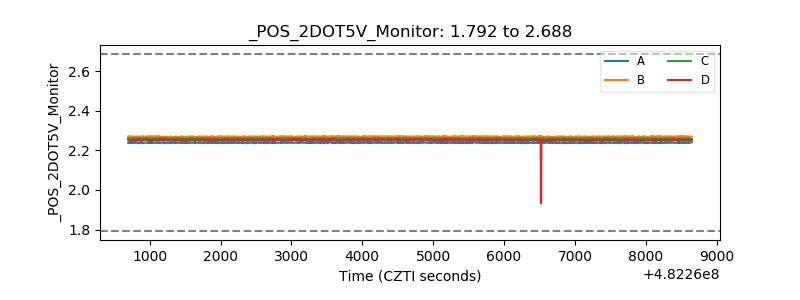 |
| +5 Volts monitor |  |
| _ROLL_ROT | 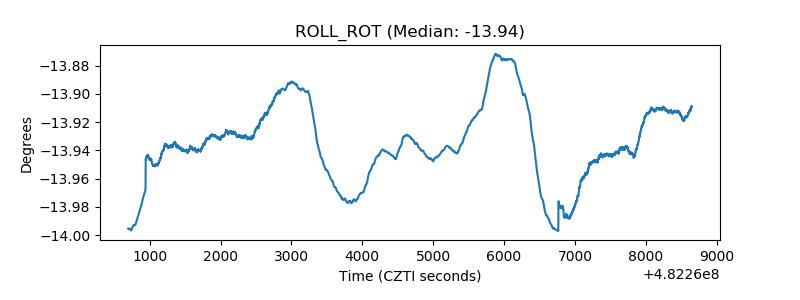 |
| _Roll_DEC | 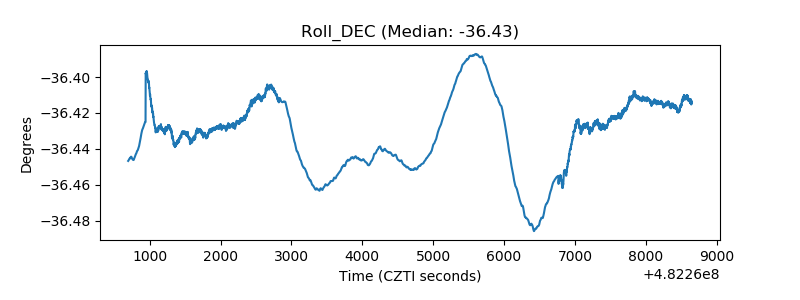 |
| _Roll_RA | 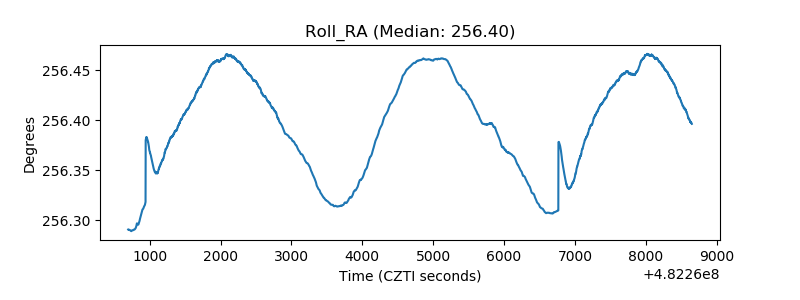 |
| Veto Counter | 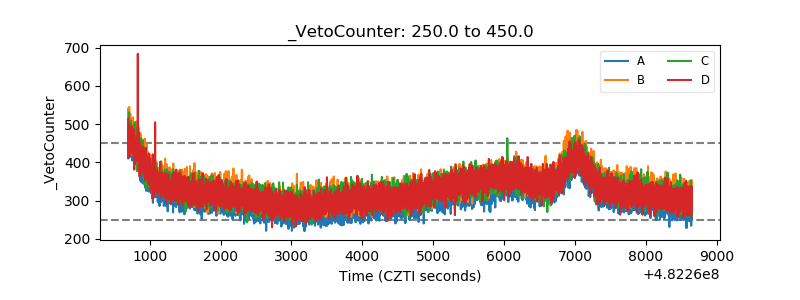 |