| Param | Original file | Final file |
|---|---|---|
| Filename | modeM0/AS1A13_037T05_9000006460_51623cztM0_level2.fits | modeM0/AS1A13_037T05_9000006460_51623cztM0_level2_quad_clean.evt |
| Size (bytes) | 1,234,385,280 | 220,599,360 |
| Size | 1.1 GB | 210.4 MB |
| Events in quadrant A | 10,981,139 | 1,391,336 |
| Events in quadrant B | 10,070,843 | 1,560,069 |
| Events in quadrant C | 9,113,846 | 1,398,498 |
| Events in quadrant D | 14,283,478 | 1,216,783 |
| Mode M9 | |||
|---|---|---|---|
| Quadrant | BADHDUFLAG | Total packets | Discarded packets |
| A | 0 | 29 | 9 |
| B | 0 | 23 | 3 |
| C | 0 | 25 | 5 |
| D | 0 | 28 | 8 |
| Mode M0 | |||
|---|---|---|---|
| Quadrant | BADHDUFLAG | Total packets | Discarded packets |
| A | 0 | 54588 | 11024 |
| B | 0 | 50467 | 9605 |
| C | 0 | 45660 | 7069 |
| D | 0 | 66628 | 13087 |
| Mode SS | |||
|---|---|---|---|
| Quadrant | BADHDUFLAG | Total packets | Discarded packets |
| A | 0 | 400 | 63 |
| B | 0 | 407 | 67 |
| C | 0 | 398 | 49 |
| D | 0 | 403 | 67 |
| Quadrant | Total seconds | Saturated seconds | Saturation percentage |
|---|---|---|---|
| A | 16021 | 775 | 4.837401% |
| B | 16211 | 674 | 4.157671% |
| C | 16238 | 405 | 2.494150% |
| D | 15821 | 1146 | 7.243537% |
Noise dominated data is calculated using 1-second bins in cleaned event files. If a bin has >2000 counts, and if more than 50% of those come from <1% of pixels, then it is considered to be noise-dominated and hence unusable.
| Quadrant | # 1 sec bins | Bins with >0 counts | Bins with >2000 counts | High rate bins dominated by noise | Noise dominated (total time) | Noise dominated (detector-on time) | Marked lightcurve |
|---|---|---|---|---|---|---|---|
| A | 24120 | 16565 | 595 | 595 | 2.47% | 3.59% | 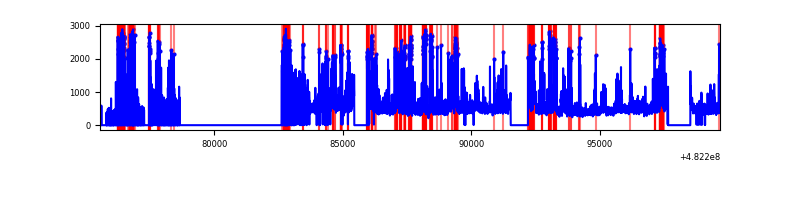 |
| B | 24135 | 16764 | 399 | 399 | 1.65% | 2.38% | 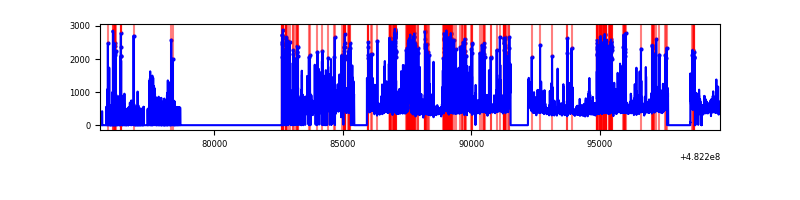 |
| C | 24069 | 16811 | 299 | 299 | 1.24% | 1.78% | 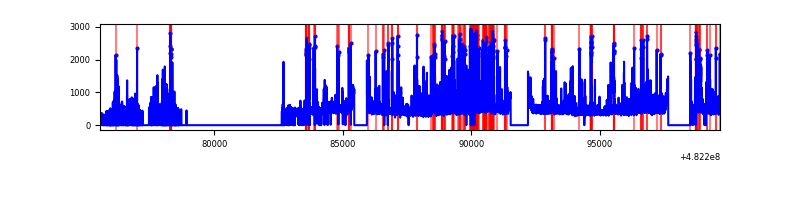 |
| D | 24117 | 16349 | 1079 | 1079 | 4.47% | 6.60% | 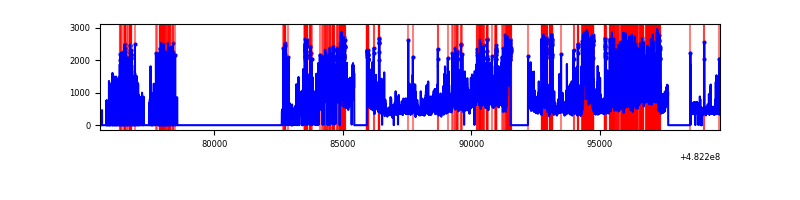 |
Top three noisy pixels from each quadrant. If the there are fewer than three noisy pixels in the level2.evt file, extra rows are filled as -1
| Pixel properties | Quadrant properties | ||||||
|---|---|---|---|---|---|---|---|
| Quadrant | DetID | PixID | Counts | Sigma | Mean | Median | Sigma |
| A | 15 | 174 | 1281865 | 3048.95 | 1718 | 1675 | 419.9 |
| A | 12 | 250 | 1162571 | 2764.83 | 1718 | 1675 | 419.9 |
| A | 4 | 175 | 465462 | 1104.57 | 1718 | 1675 | 419.9 |
| B | 10 | 41 | 778017 | 2109.96 | 1729 | 1665 | 367.9 |
| B | 5 | 185 | 770991 | 2090.86 | 1729 | 1665 | 367.9 |
| B | 8 | 128 | 276979 | 748.24 | 1729 | 1665 | 367.9 |
| C | 15 | 255 | 760773 | 1602.47 | 1727 | 1710 | 473.7 |
| C | 14 | 245 | 407874 | 857.46 | 1727 | 1710 | 473.7 |
| C | 13 | 3 | 289901 | 608.41 | 1727 | 1710 | 473.7 |
| D | 0 | 18 | 2737332 | 6061.24 | 1629 | 1574 | 451.4 |
| D | 6 | 42 | 1162873 | 2572.93 | 1629 | 1574 | 451.4 |
| D | 1 | 3 | 804353 | 1778.61 | 1629 | 1574 | 451.4 |
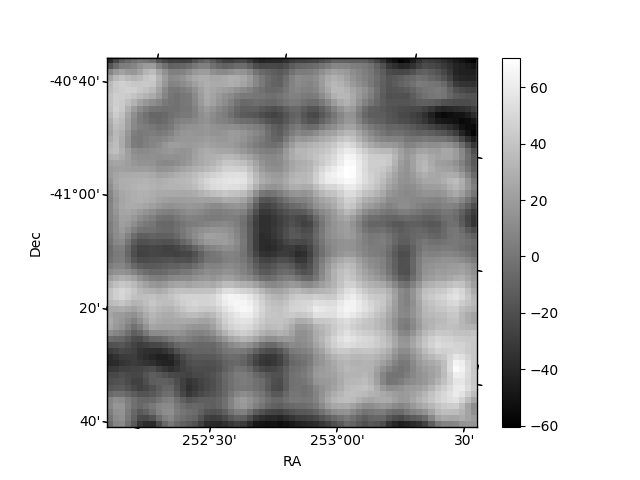
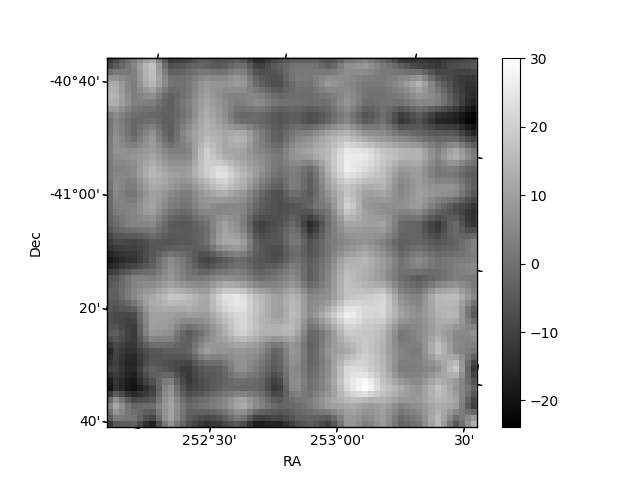
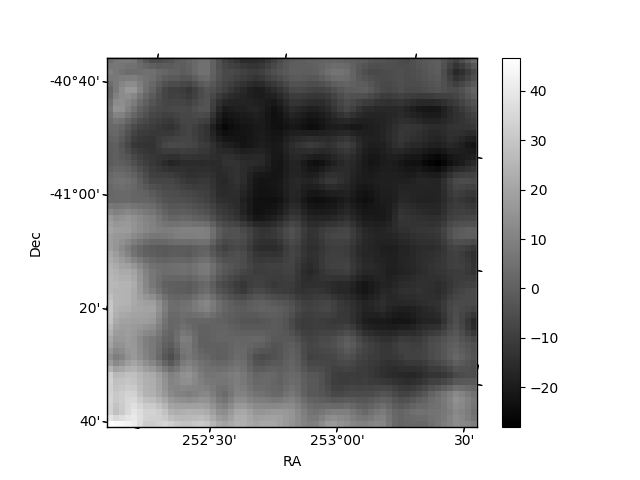
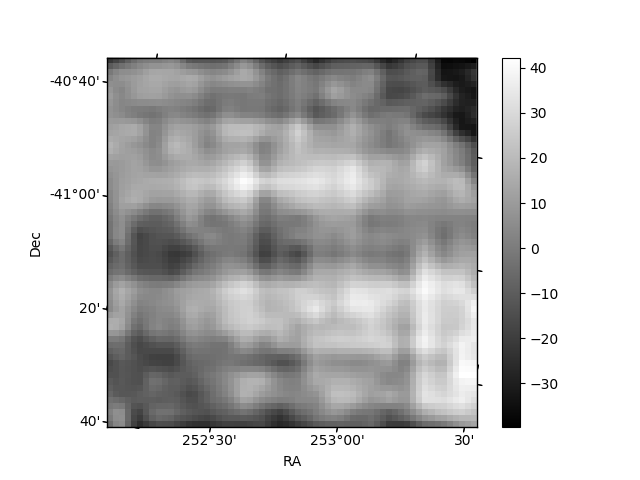
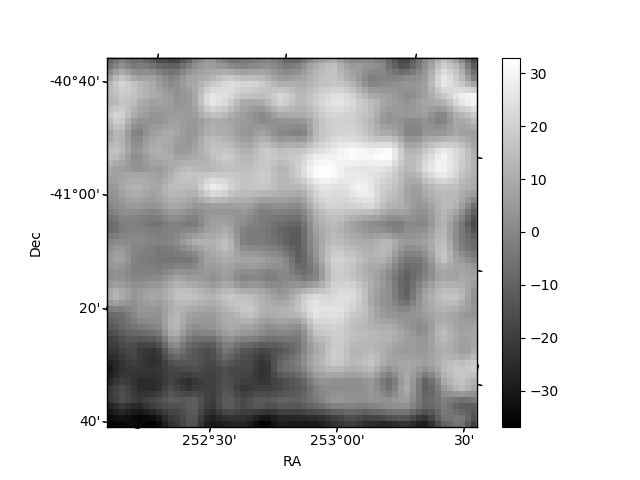
Histogram calculated using DETX and DETY for each event in the final _common_clean file
| Quadrant A | 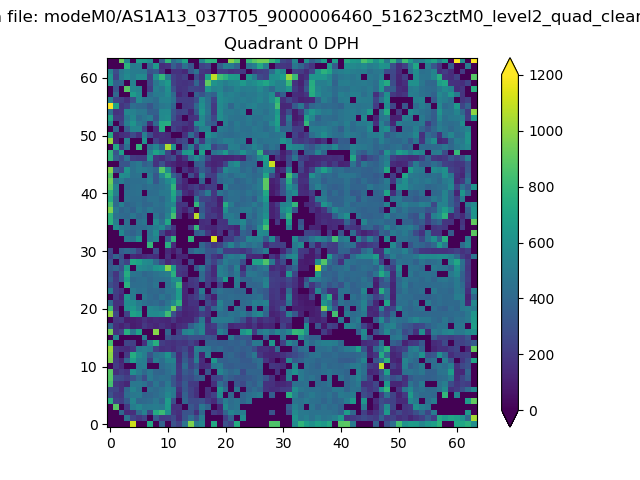 |
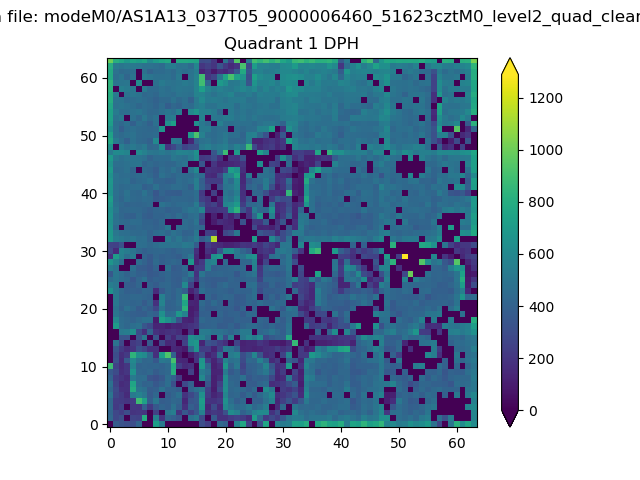 |
Quadrant B |
|---|---|---|---|
| Quadrant D | 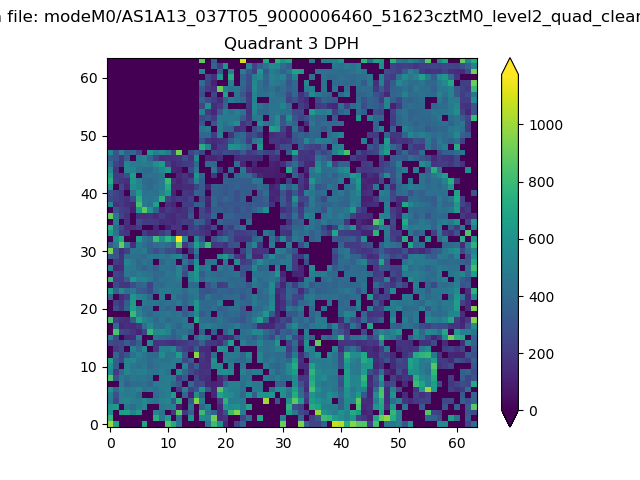 |
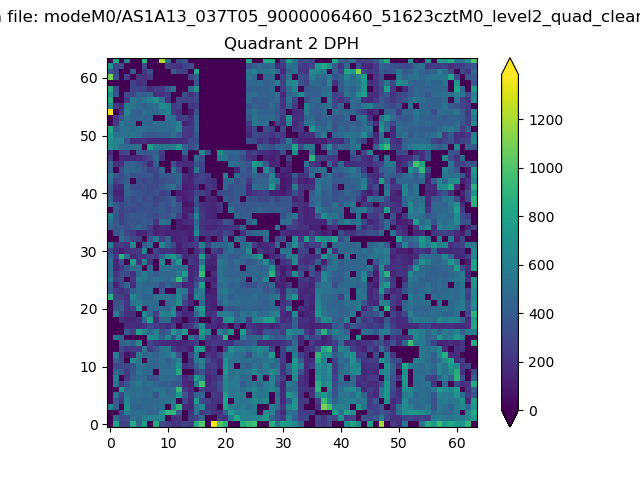 |
Quadrant C |
| Plot type | Count rate plots | Images |
|---|---|---|
| Comparison with Poisson distribution Blue bars denote a histogram of data divided into 1 sec bins. Red curve is a Poisson curve with rate = median count rate of data. |
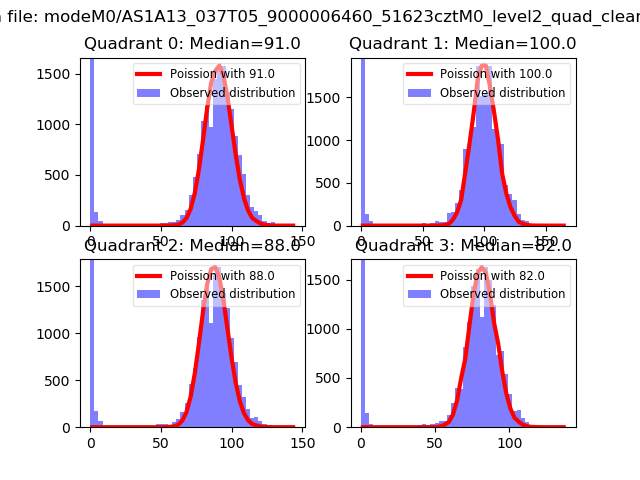 |
 |
| Quadrant-wise count rates Data is divided into 100 sec bins |
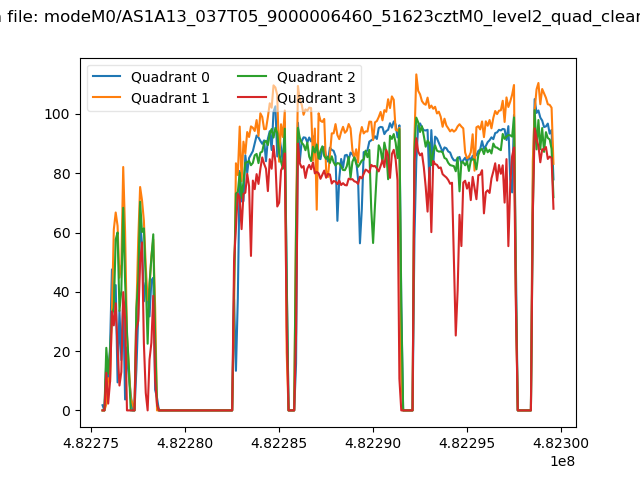 |
|
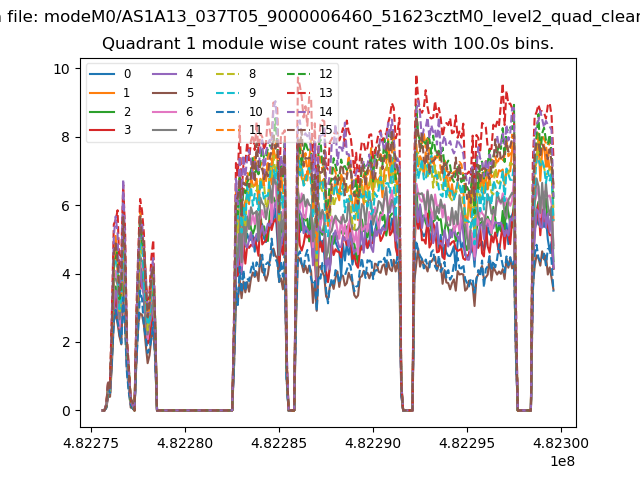
| Module-wise count rates for Quadrant A Data is divided into 100 sec bins |
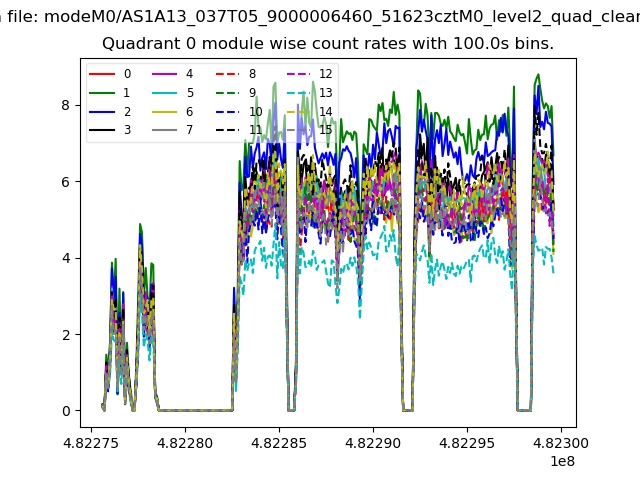 |
 |
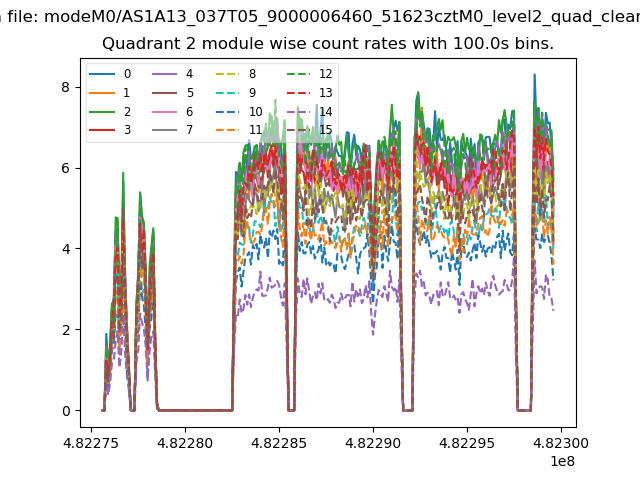
| Module-wise count rates for Quadrant B Data is divided into 100 sec bins |
 |
 |
| Module-wise count rates for Quadrant C Data is divided into 100 sec bins |
 |
 |
| Module-wise count rates for Quadrant D Data is divided into 100 sec bins |
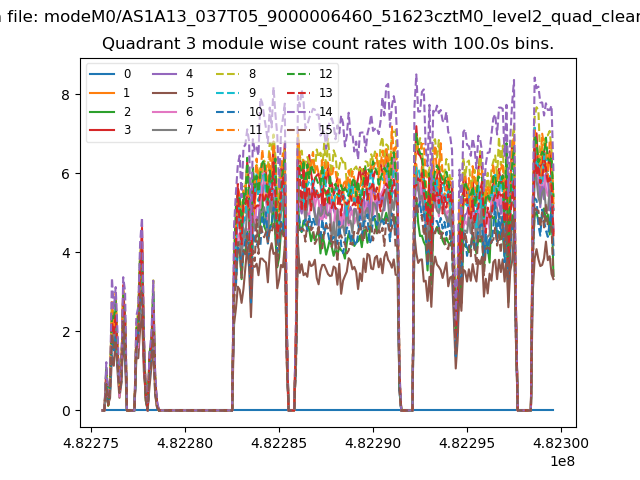 |
 |
| Parameter | Plot |
|---|---|
| CZT HV Monitor | 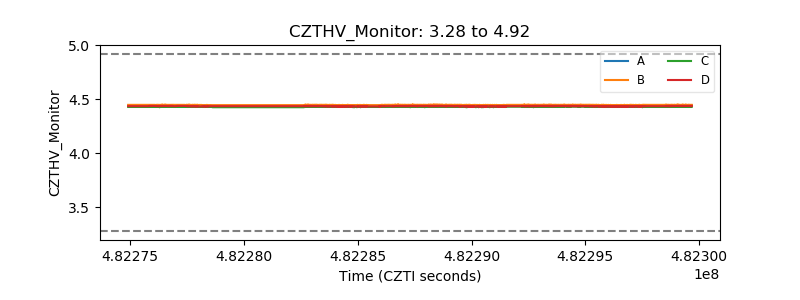 |
| D_VDD | 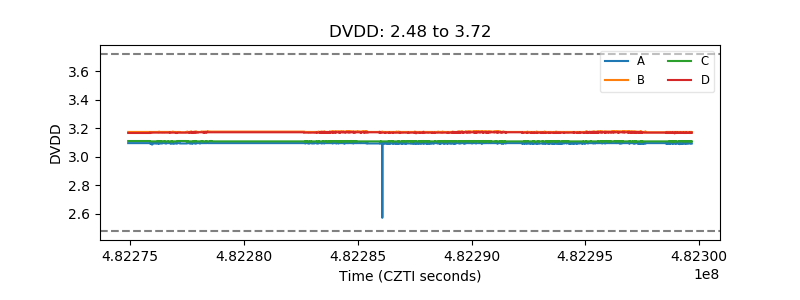 |
| Temperature 1 | 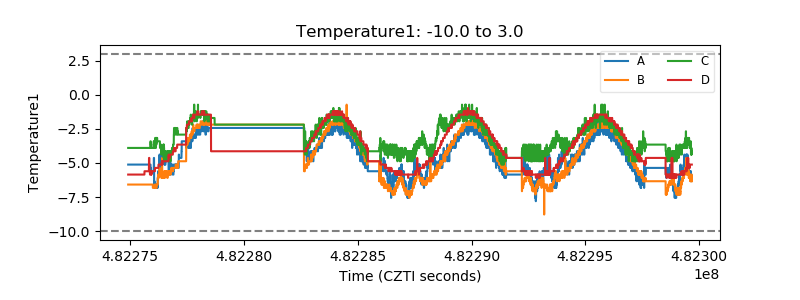 |
| Veto HV Monitor | 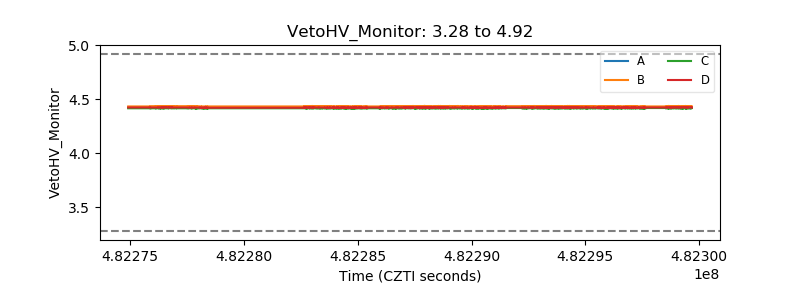 |
| Veto LLD | 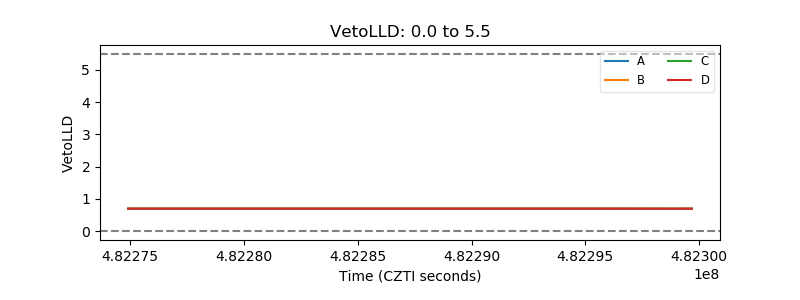 |
| Alpha Counter | 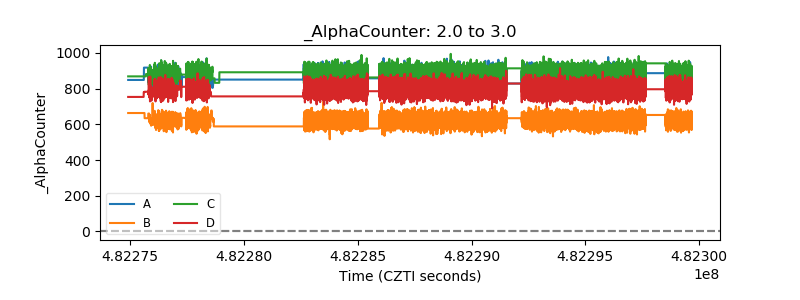 |
| _CPM_Rate | 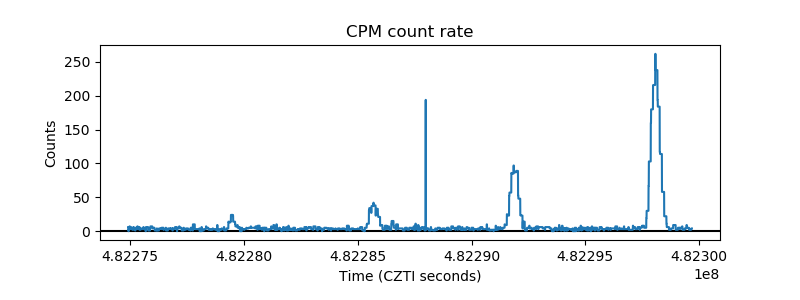 |
| CZT Counter | 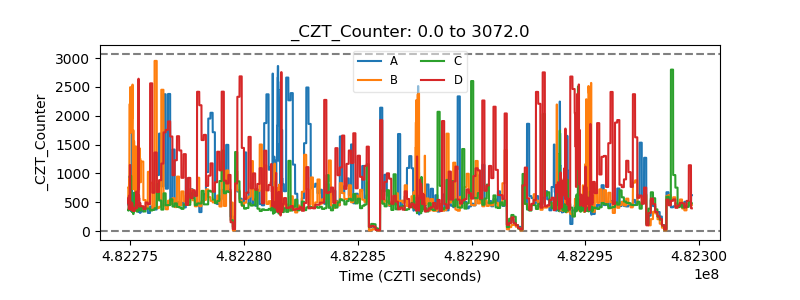 |
| +2.5 Volts monitor | 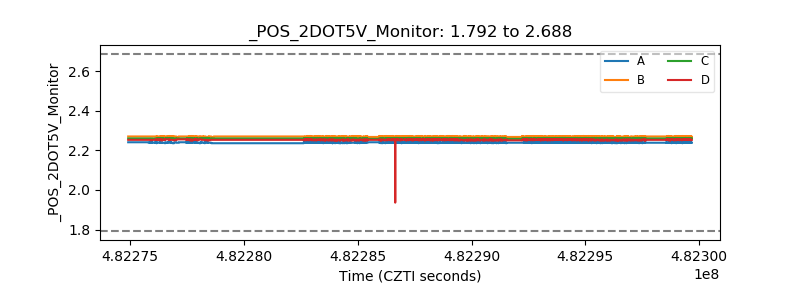 |
| +5 Volts monitor | 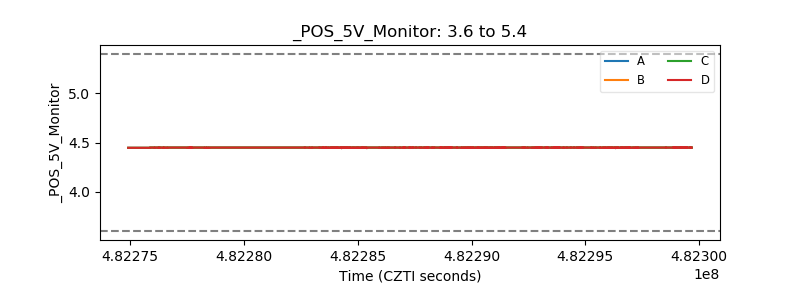 |
| _ROLL_ROT | 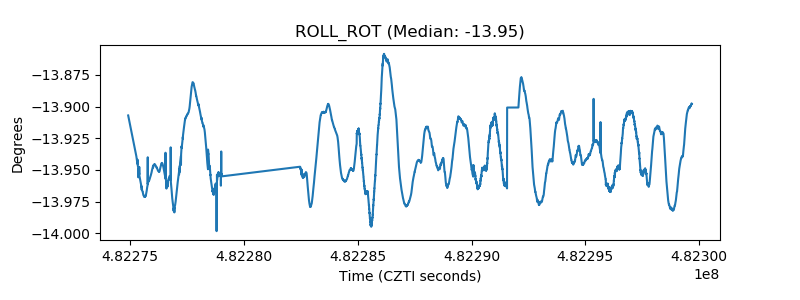 |
| _Roll_DEC | 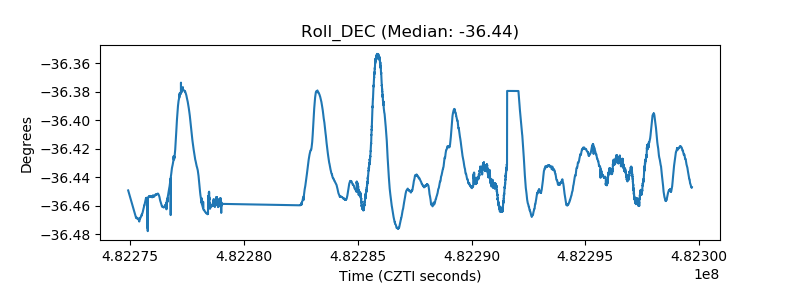 |
| _Roll_RA | 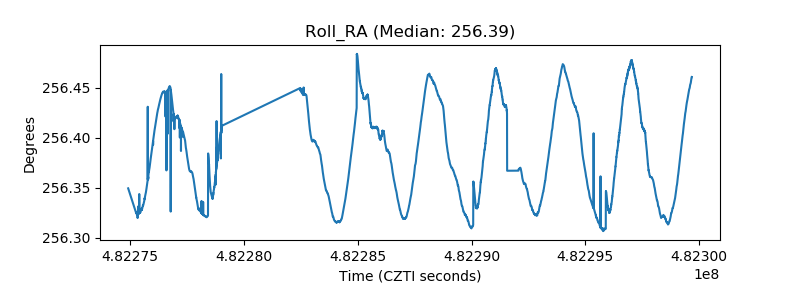 |
| Veto Counter | 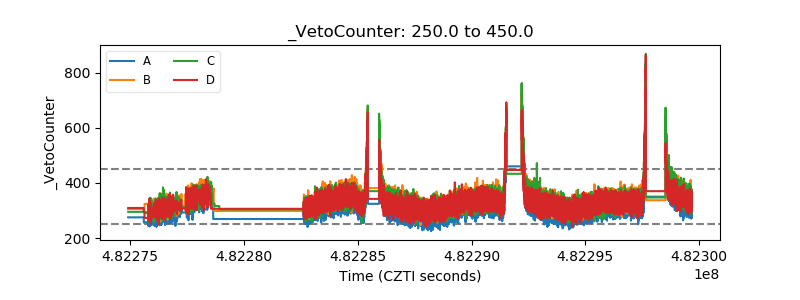 |