| Param | Original file | Final file |
|---|---|---|
| Filename | modeM0/AS1A13_037T05_9000006460_51627cztM0_level2.fits | modeM0/AS1A13_037T05_9000006460_51627cztM0_level2_quad_clean.evt |
| Size (bytes) | 482,549,760 | 98,893,440 |
| Size | 460.2 MB | 94.3 MB |
| Events in quadrant A | 4,599,379 | 630,233 |
| Events in quadrant B | 4,698,769 | 684,645 |
| Events in quadrant C | 3,974,782 | 628,162 |
| Events in quadrant D | 4,061,811 | 578,356 |
| Mode M9 | |||
|---|---|---|---|
| Quadrant | BADHDUFLAG | Total packets | Discarded packets |
| A | 0 | 9 | 0 |
| B | 0 | 9 | 0 |
| C | 0 | 9 | 0 |
| D | 0 | 9 | 0 |
| Mode M0 | |||
|---|---|---|---|
| Quadrant | BADHDUFLAG | Total packets | Discarded packets |
| A | 0 | 18199 | 7 |
| B | 0 | 18524 | 1 |
| C | 0 | 16529 | 1 |
| D | 0 | 16753 | 1 |
| Mode SS | |||
|---|---|---|---|
| Quadrant | BADHDUFLAG | Total packets | Discarded packets |
| A | 0 | 138 | 0 |
| B | 0 | 138 | 0 |
| C | 0 | 138 | 0 |
| D | 0 | 138 | 0 |
| Quadrant | Total seconds | Saturated seconds | Saturation percentage |
|---|---|---|---|
| A | 6789 | 475 | 6.996612% |
| B | 6789 | 421 | 6.201208% |
| C | 6789 | 283 | 4.168508% |
| D | 6789 | 380 | 5.597290% |
Noise dominated data is calculated using 1-second bins in cleaned event files. If a bin has >2000 counts, and if more than 50% of those come from <1% of pixels, then it is considered to be noise-dominated and hence unusable.
| Quadrant | # 1 sec bins | Bins with >0 counts | Bins with >2000 counts | High rate bins dominated by noise | Noise dominated (total time) | Noise dominated (detector-on time) | Marked lightcurve |
|---|---|---|---|---|---|---|---|
| A | 7754 | 6790 | 251 | 251 | 3.24% | 3.70% | 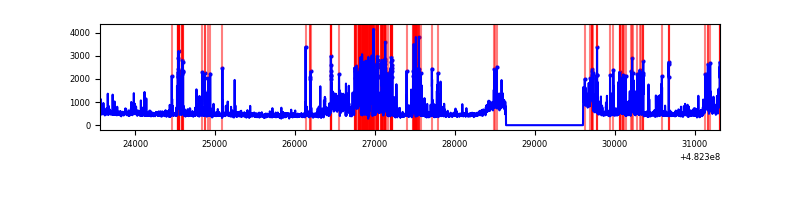 |
| B | 7754 | 6790 | 209 | 209 | 2.70% | 3.08% | 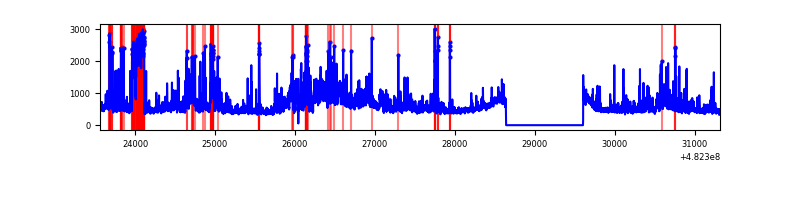 |
| C | 7754 | 6790 | 175 | 175 | 2.26% | 2.58% | 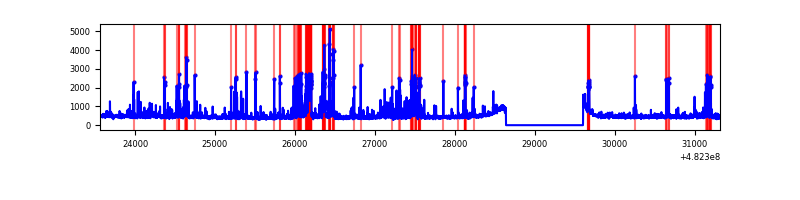 |
| D | 7754 | 6790 | 219 | 219 | 2.82% | 3.23% | 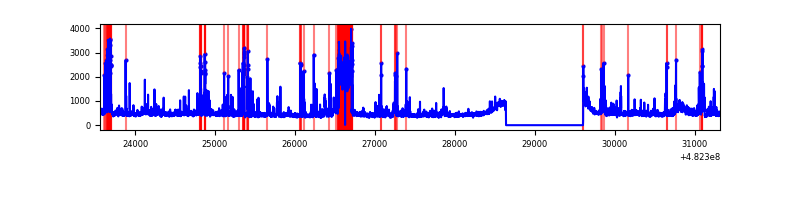 |
Top three noisy pixels from each quadrant. If the there are fewer than three noisy pixels in the level2.evt file, extra rows are filled as -1
| Pixel properties | Quadrant properties | ||||||
|---|---|---|---|---|---|---|---|
| Quadrant | DetID | PixID | Counts | Sigma | Mean | Median | Sigma |
| A | 7 | 64 | 899749 | 4924.28 | 753 | 735 | 182.6 |
| A | 12 | 3 | 192796 | 1052.0 | 753 | 735 | 182.6 |
| A | 5 | 240 | 115273 | 627.37 | 753 | 735 | 182.6 |
| B | 5 | 172 | 733594 | 4555.01 | 751 | 726 | 160.9 |
| B | 5 | 185 | 155816 | 963.93 | 751 | 726 | 160.9 |
| B | 4 | 174 | 132181 | 817.03 | 751 | 726 | 160.9 |
| C | 15 | 189 | 366258 | 1805.57 | 741 | 736 | 202.4 |
| C | 13 | 3 | 154141 | 757.77 | 741 | 736 | 202.4 |
| C | 10 | 19 | 138573 | 680.87 | 741 | 736 | 202.4 |
| D | 8 | 176 | 683801 | 3371.14 | 729 | 703 | 202.6 |
| D | 1 | 3 | 100551 | 492.76 | 729 | 703 | 202.6 |
| D | 2 | 249 | 86184 | 421.85 | 729 | 703 | 202.6 |
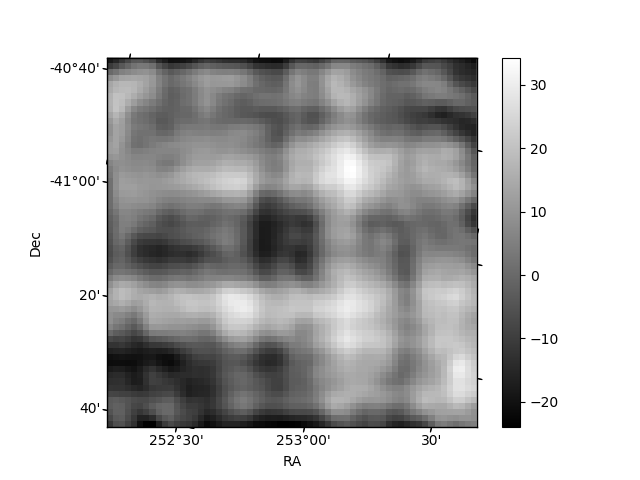
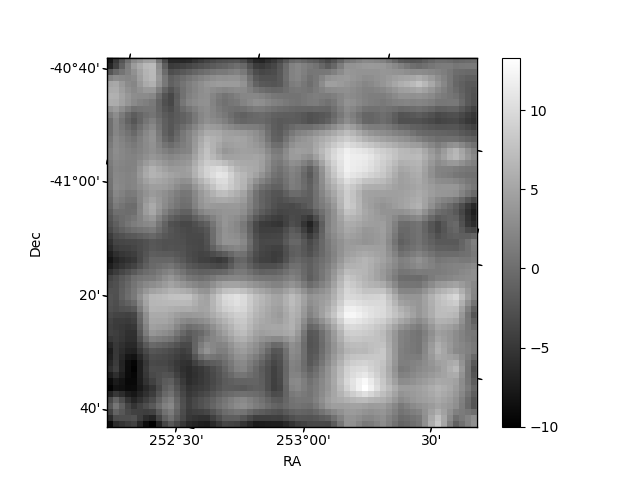
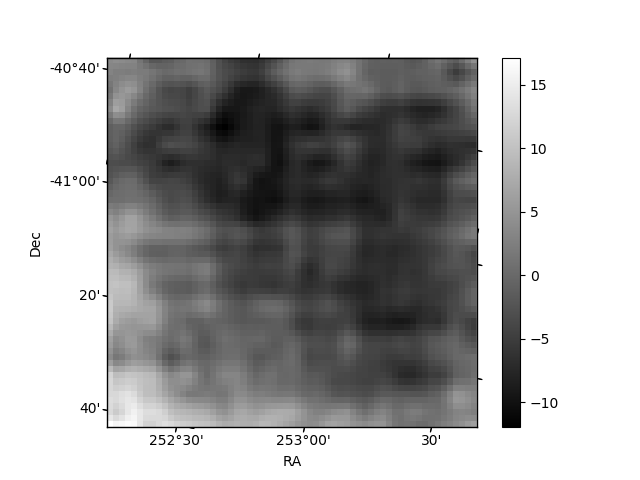
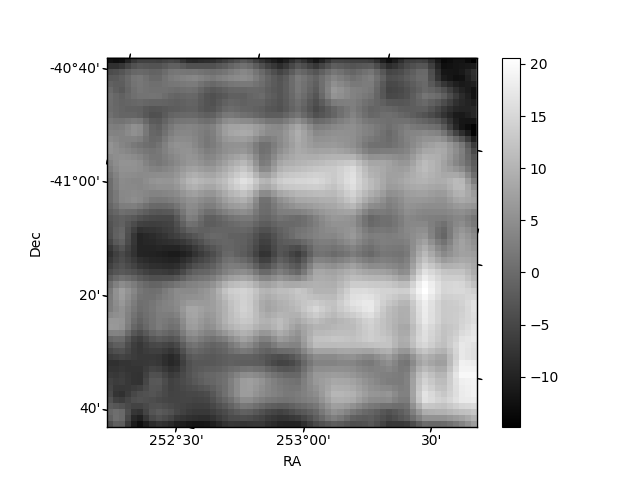
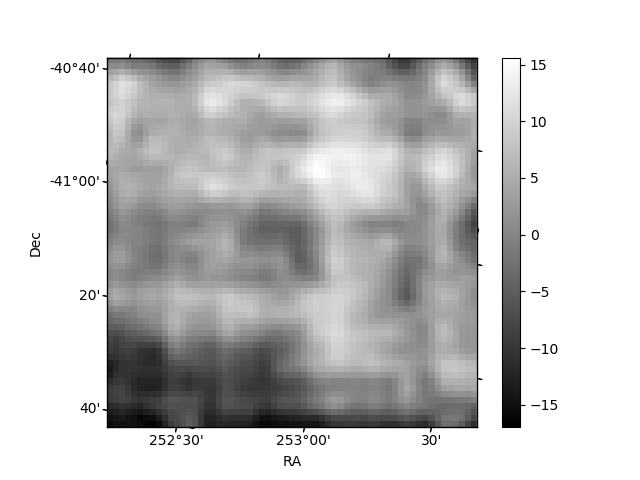
Histogram calculated using DETX and DETY for each event in the final _common_clean file
| Quadrant A | 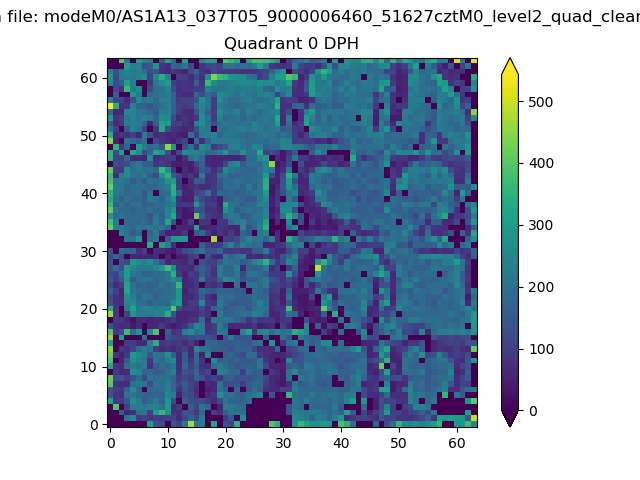 |
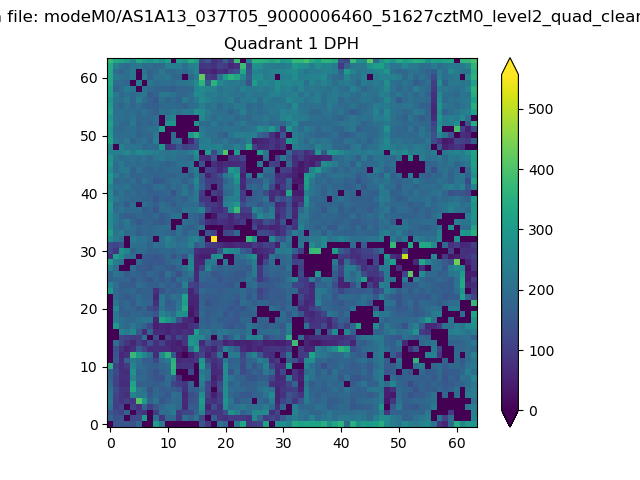 |
Quadrant B |
|---|---|---|---|
| Quadrant D | 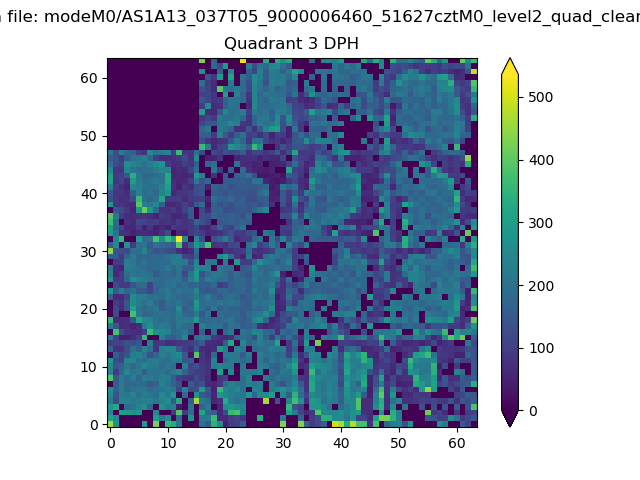 |
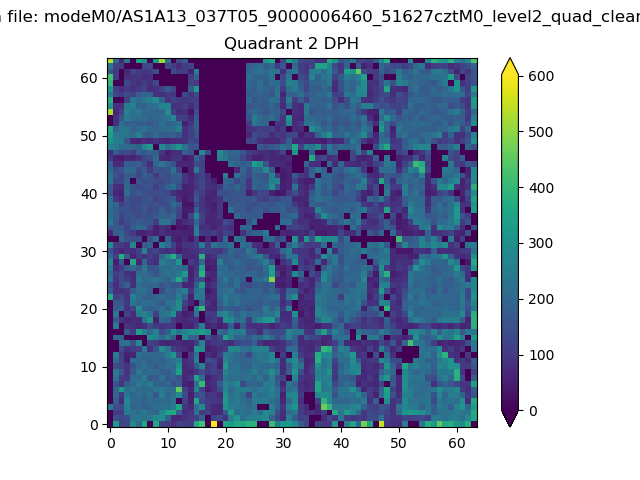 |
Quadrant C |
| Plot type | Count rate plots | Images |
|---|---|---|
| Comparison with Poisson distribution Blue bars denote a histogram of data divided into 1 sec bins. Red curve is a Poisson curve with rate = median count rate of data. |
 |
 |
| Quadrant-wise count rates Data is divided into 100 sec bins |
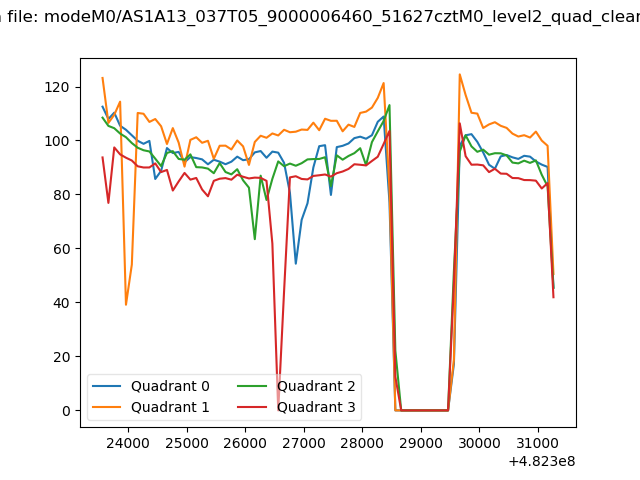 |
|
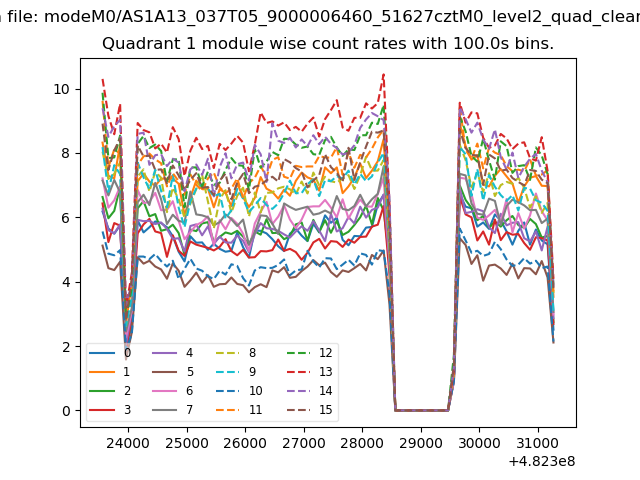
| Module-wise count rates for Quadrant A Data is divided into 100 sec bins |
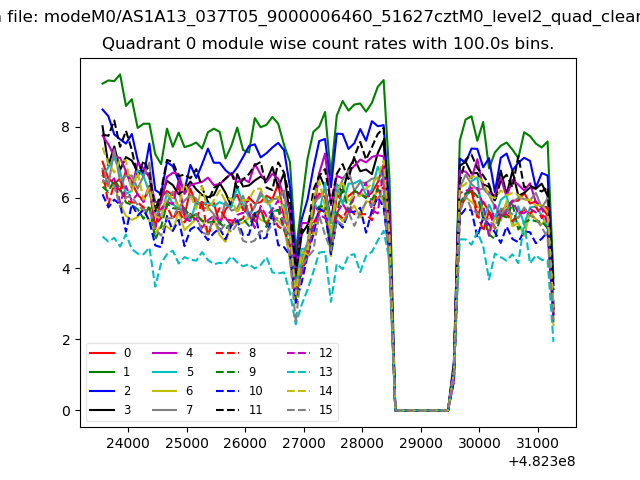 |
 |
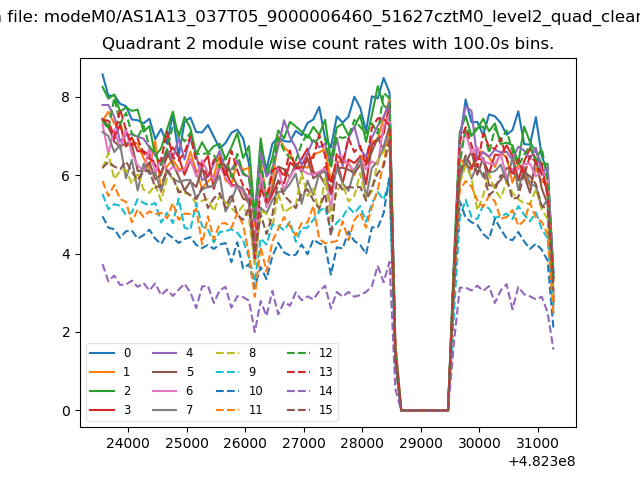
| Module-wise count rates for Quadrant B Data is divided into 100 sec bins |
 |
 |
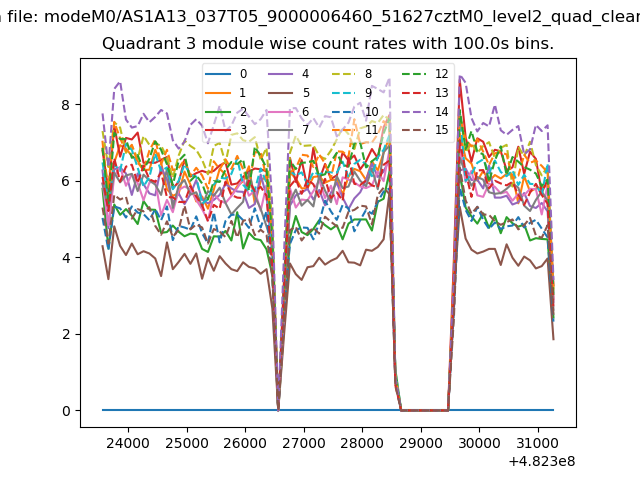
| Module-wise count rates for Quadrant C Data is divided into 100 sec bins |
 |
 |
| Module-wise count rates for Quadrant D Data is divided into 100 sec bins |
 |
 |
| Parameter | Plot |
|---|---|
| CZT HV Monitor |  |
| D_VDD | 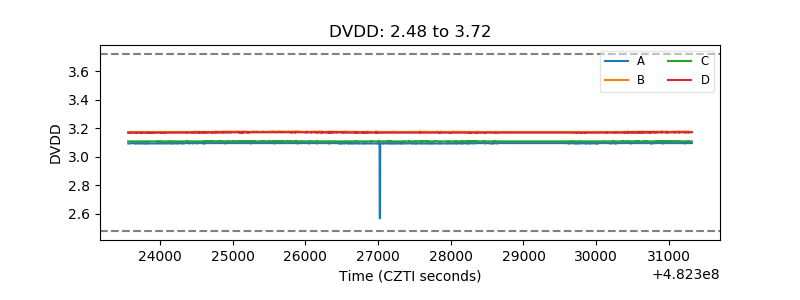 |
| Temperature 1 | 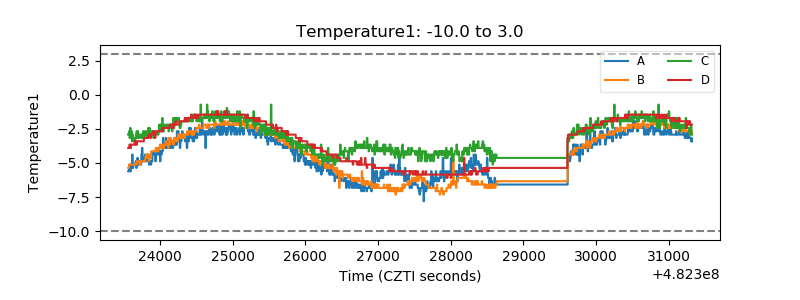 |
| Veto HV Monitor | 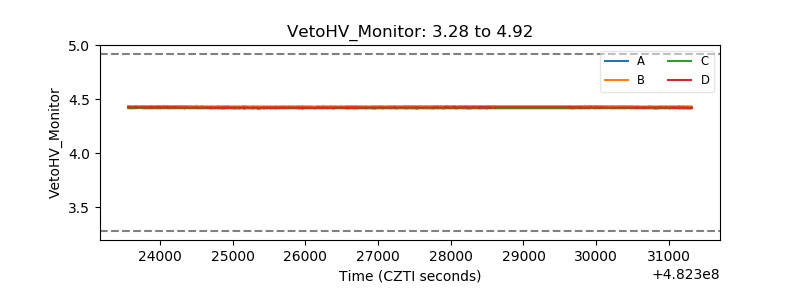 |
| Veto LLD | 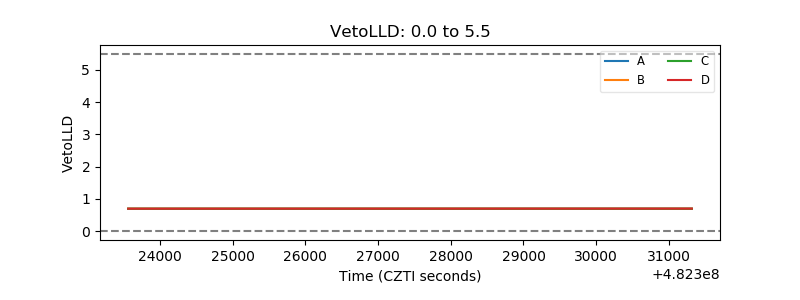 |
| Alpha Counter | 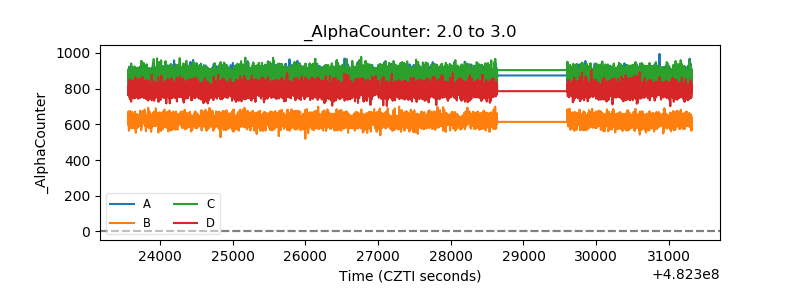 |
| _CPM_Rate | 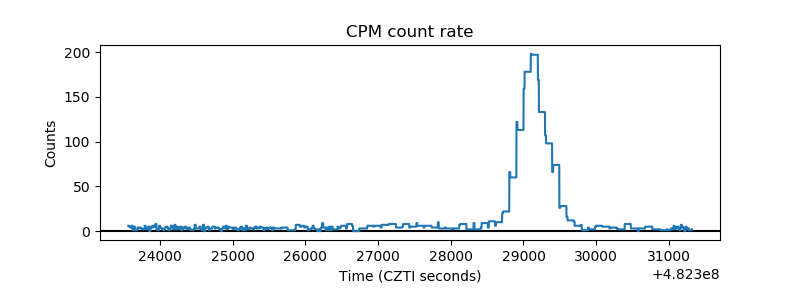 |
| CZT Counter | 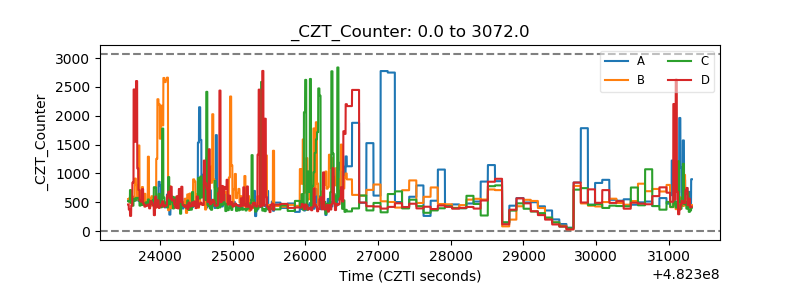 |
| +2.5 Volts monitor | 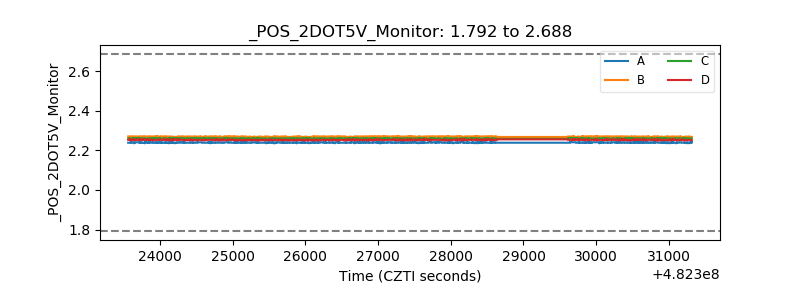 |
| +5 Volts monitor | 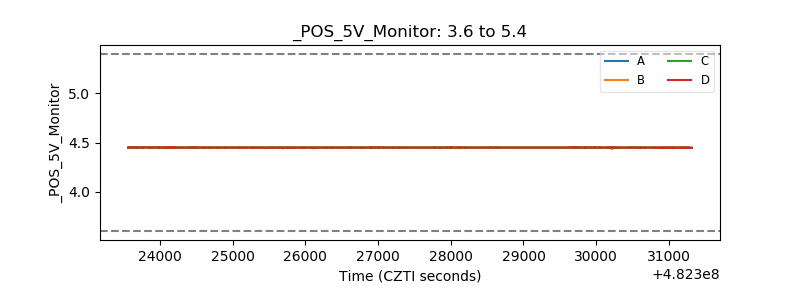 |
| _ROLL_ROT | 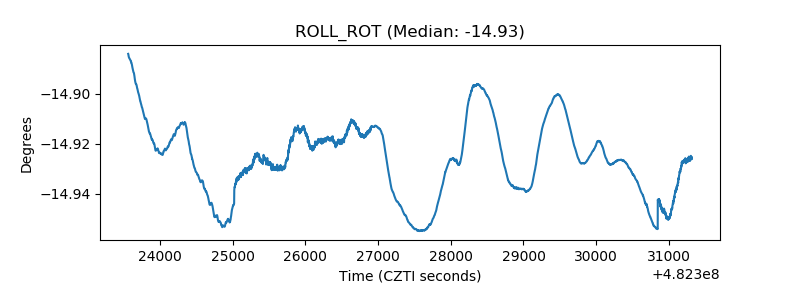 |
| _Roll_DEC | 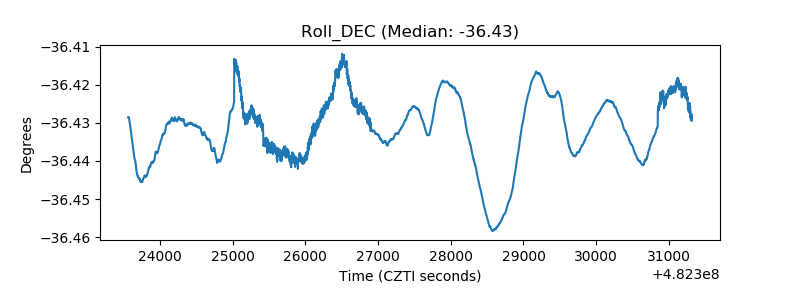 |
| _Roll_RA | 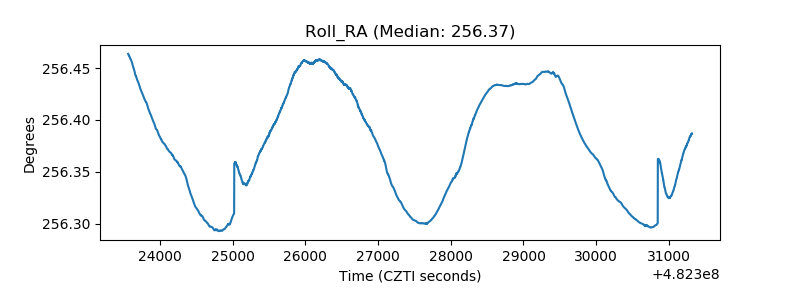 |
| Veto Counter | 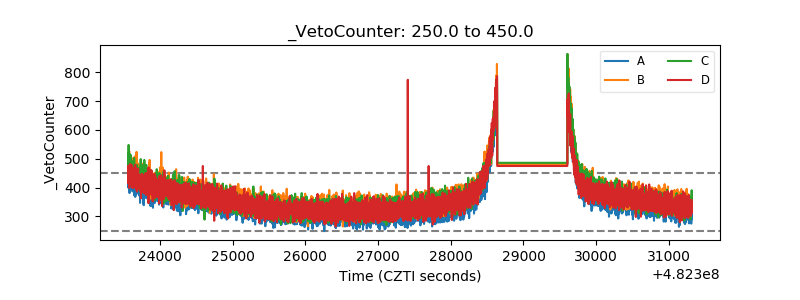 |