| Param | Original file | Final file |
|---|---|---|
| Filename | modeM0/AS1A13_037T05_9000006460_51630cztM0_level2.fits | modeM0/AS1A13_037T05_9000006460_51630cztM0_level2_quad_clean.evt |
| Size (bytes) | 760,717,440 | 112,896,000 |
| Size | 725.5 MB | 107.7 MB |
| Events in quadrant A | 9,947,637 | 638,688 |
| Events in quadrant B | 5,217,788 | 810,439 |
| Events in quadrant C | 6,707,103 | 708,724 |
| Events in quadrant D | 5,646,370 | 685,226 |
| Mode M9 | |||
|---|---|---|---|
| Quadrant | BADHDUFLAG | Total packets | Discarded packets |
| A | 0 | 1 | 0 |
| B | 0 | 1 | 0 |
| C | 0 | 1 | 0 |
| D | 0 | 1 | 0 |
| Mode M0 | |||
|---|---|---|---|
| Quadrant | BADHDUFLAG | Total packets | Discarded packets |
| A | 0 | 35308 | 2 |
| B | 0 | 21074 | 2 |
| C | 0 | 25696 | 2 |
| D | 0 | 22460 | 2 |
| Mode SS | |||
|---|---|---|---|
| Quadrant | BADHDUFLAG | Total packets | Discarded packets |
| A | 0 | 170 | 0 |
| B | 0 | 170 | 0 |
| C | 0 | 170 | 0 |
| D | 0 | 168 | 0 |
| Quadrant | Total seconds | Saturated seconds | Saturation percentage |
|---|---|---|---|
| A | 8270 | 1915 | 23.155985% |
| B | 8271 | 496 | 5.996856% |
| C | 8271 | 750 | 9.067827% |
| D | 8271 | 432 | 5.223069% |
Noise dominated data is calculated using 1-second bins in cleaned event files. If a bin has >2000 counts, and if more than 50% of those come from <1% of pixels, then it is considered to be noise-dominated and hence unusable.
| Quadrant | # 1 sec bins | Bins with >0 counts | Bins with >2000 counts | High rate bins dominated by noise | Noise dominated (total time) | Noise dominated (detector-on time) | Marked lightcurve |
|---|---|---|---|---|---|---|---|
| A | 8400 | 8273 | 1229 | 1229 | 14.63% | 14.86% | 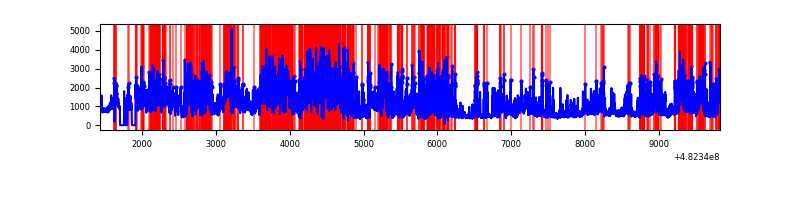 |
| B | 8400 | 8273 | 106 | 106 | 1.26% | 1.28% | 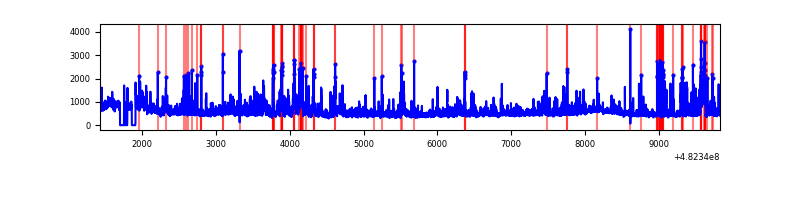 |
| C | 8400 | 8273 | 499 | 499 | 5.94% | 6.03% | 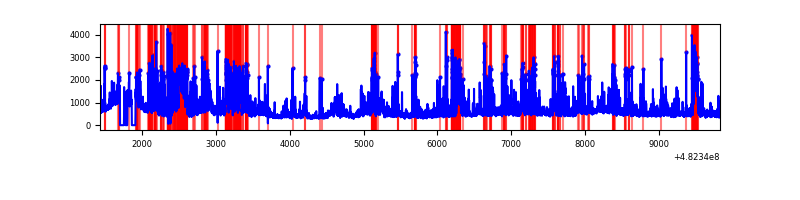 |
| D | 8400 | 8273 | 281 | 281 | 3.35% | 3.40% | 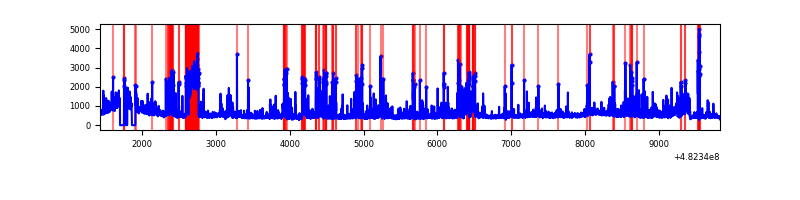 |
Top three noisy pixels from each quadrant. If the there are fewer than three noisy pixels in the level2.evt file, extra rows are filled as -1
| Pixel properties | Quadrant properties | ||||||
|---|---|---|---|---|---|---|---|
| Quadrant | DetID | PixID | Counts | Sigma | Mean | Median | Sigma |
| A | 7 | 64 | 3179120 | 14826.34 | 877 | 853 | 214.4 |
| A | 12 | 3 | 1261562 | 5881.1 | 877 | 853 | 214.4 |
| A | 12 | 250 | 771289 | 3594.02 | 877 | 853 | 214.4 |
| B | 10 | 44 | 336289 | 1660.34 | 934 | 899 | 202.0 |
| B | 1 | 207 | 252674 | 1246.41 | 934 | 899 | 202.0 |
| B | 0 | 171 | 173880 | 856.34 | 934 | 899 | 202.0 |
| C | 9 | 38 | 699856 | 2833.58 | 899 | 893 | 246.7 |
| C | 15 | 189 | 521087 | 2108.86 | 899 | 893 | 246.7 |
| C | 10 | 19 | 392914 | 1589.25 | 899 | 893 | 246.7 |
| D | 8 | 176 | 640403 | 2558.93 | 905 | 871 | 249.9 |
| D | 10 | 172 | 416533 | 1663.17 | 905 | 871 | 249.9 |
| D | 3 | 12 | 235368 | 938.28 | 905 | 871 | 249.9 |
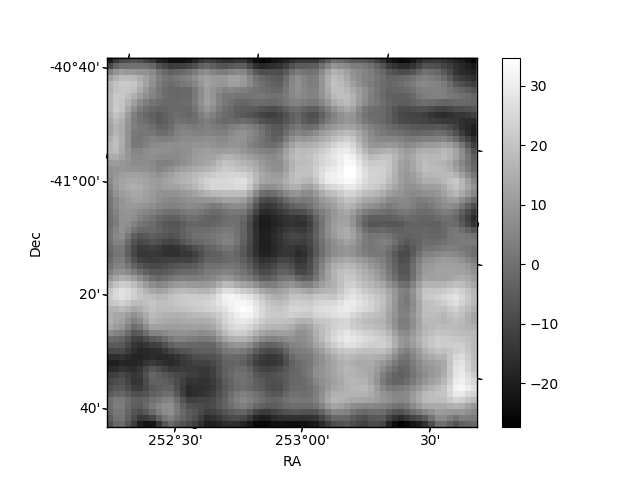
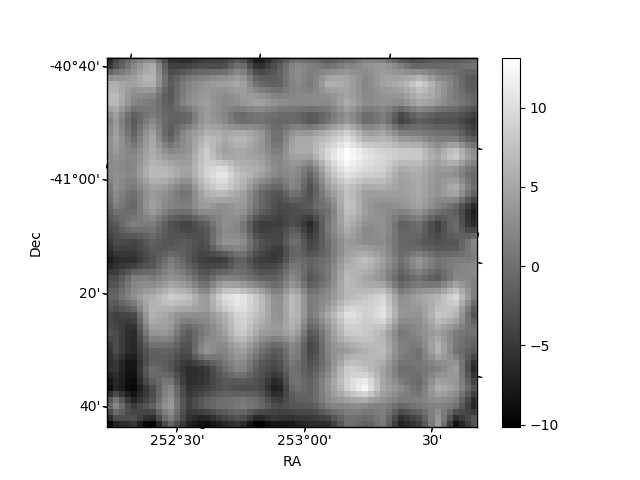
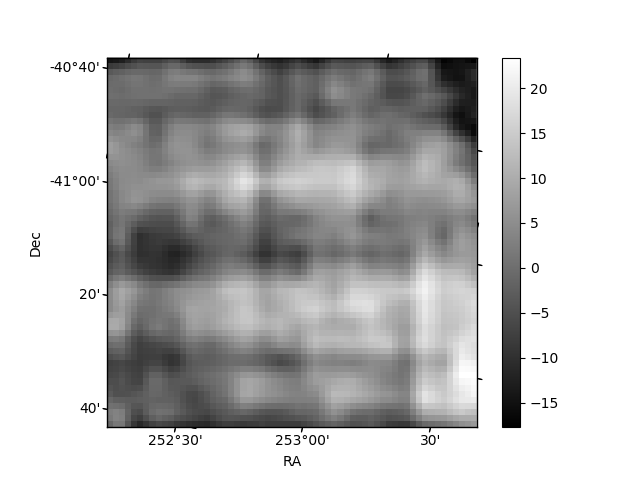
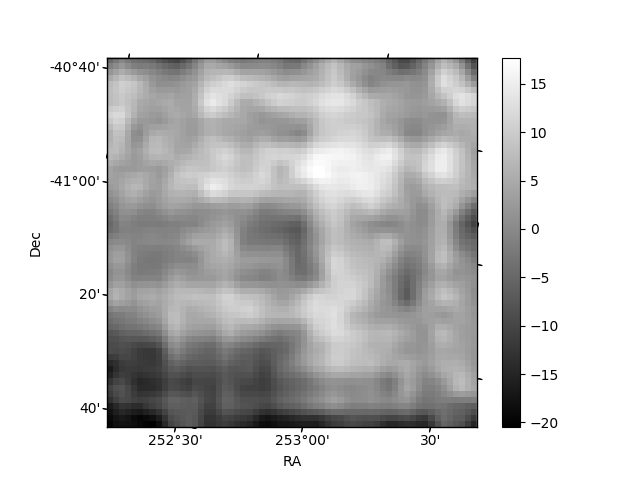
Histogram calculated using DETX and DETY for each event in the final _common_clean file
| Quadrant A | 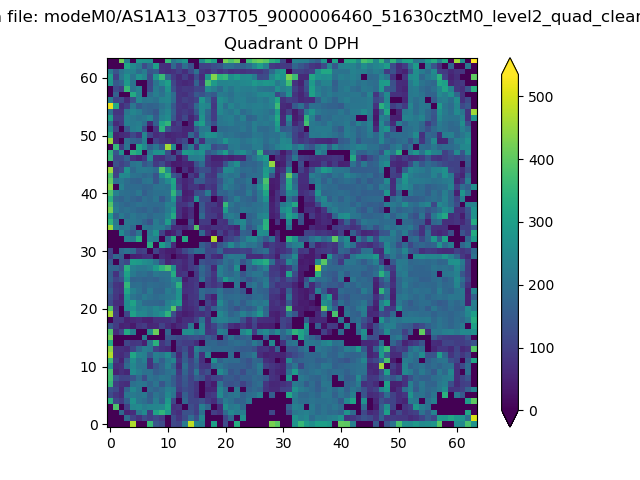 |
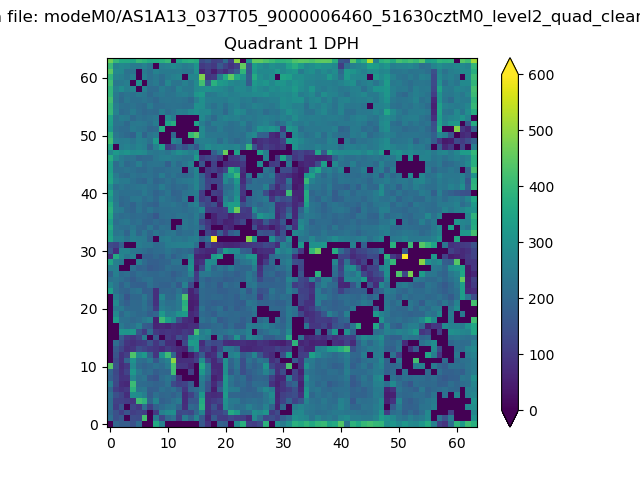 |
Quadrant B |
|---|---|---|---|
| Quadrant D | 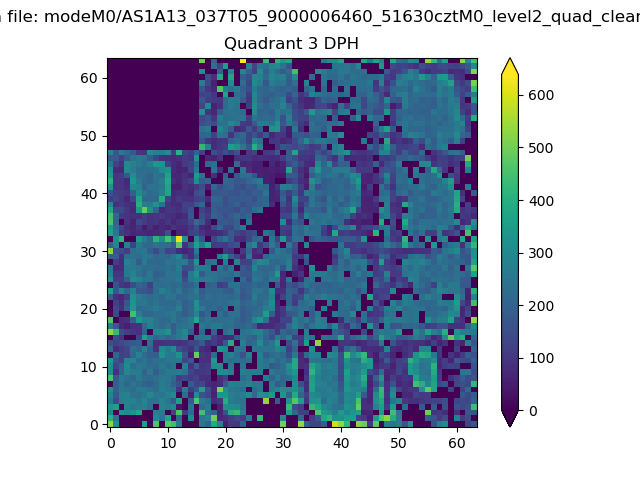 |
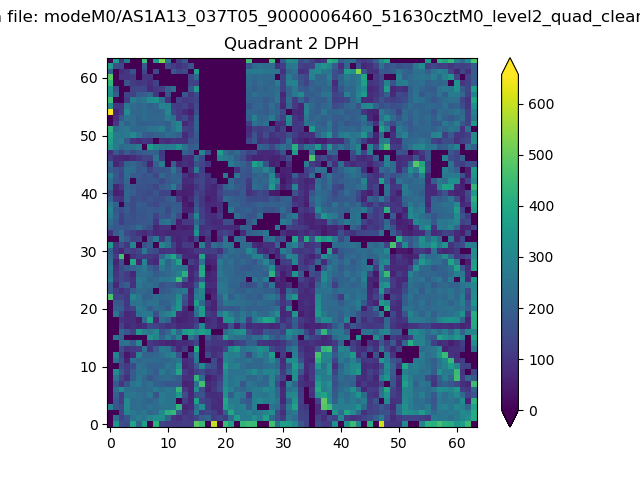 |
Quadrant C |
| Plot type | Count rate plots | Images |
|---|---|---|
| Comparison with Poisson distribution Blue bars denote a histogram of data divided into 1 sec bins. Red curve is a Poisson curve with rate = median count rate of data. |
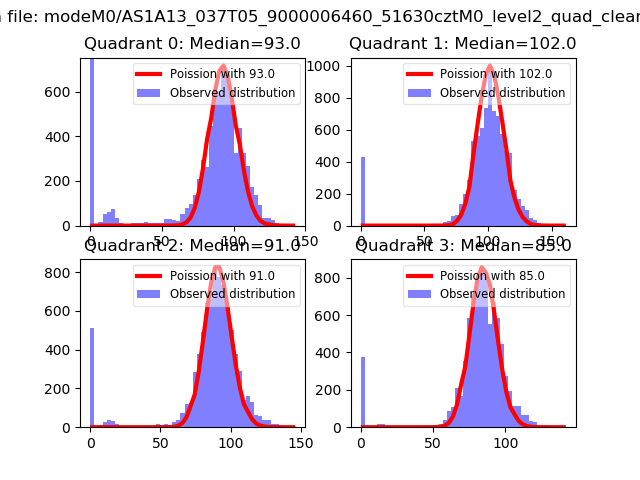 |
 |
| Quadrant-wise count rates Data is divided into 100 sec bins |
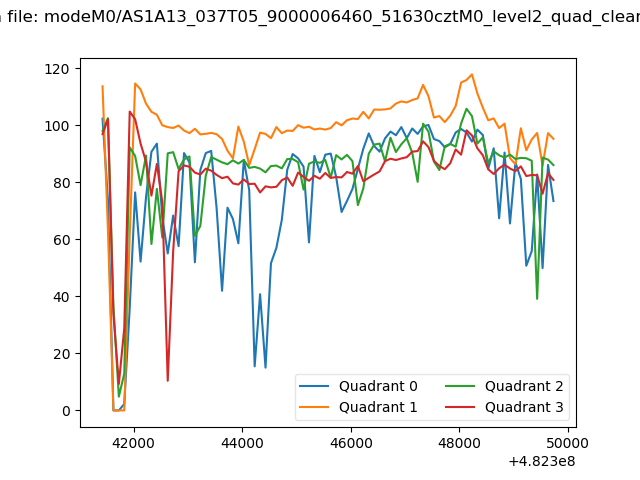 |
|
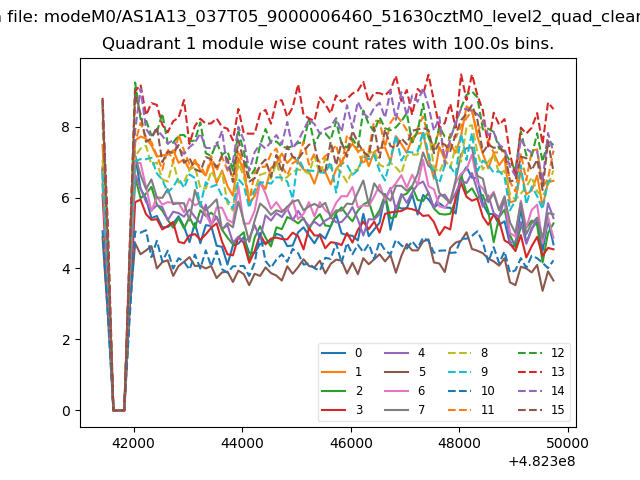
| Module-wise count rates for Quadrant A Data is divided into 100 sec bins |
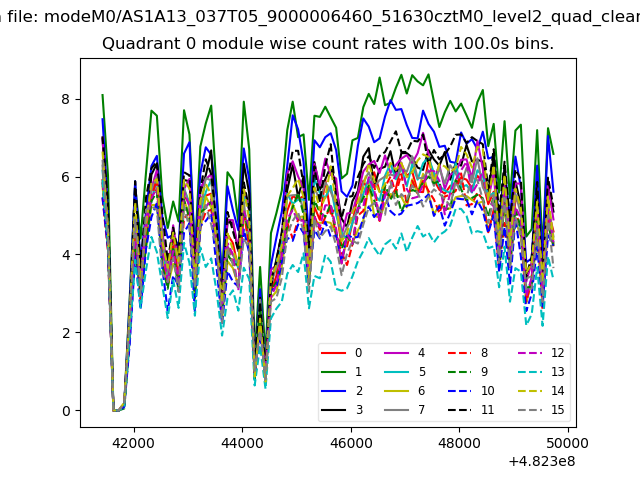 |
 |
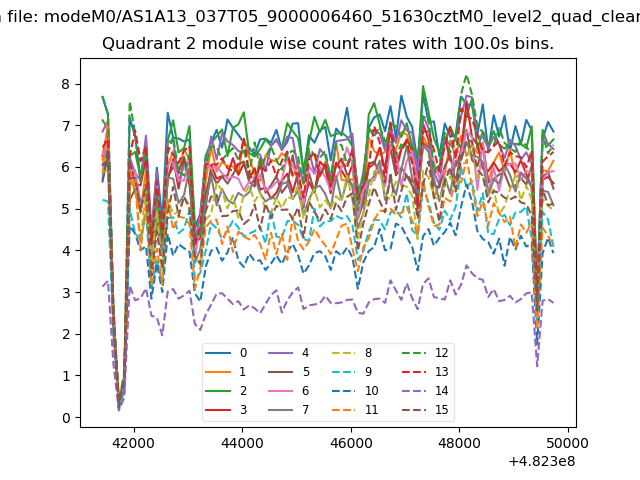
| Module-wise count rates for Quadrant B Data is divided into 100 sec bins |
 |
 |
| Module-wise count rates for Quadrant C Data is divided into 100 sec bins |
 |
 |
| Module-wise count rates for Quadrant D Data is divided into 100 sec bins |
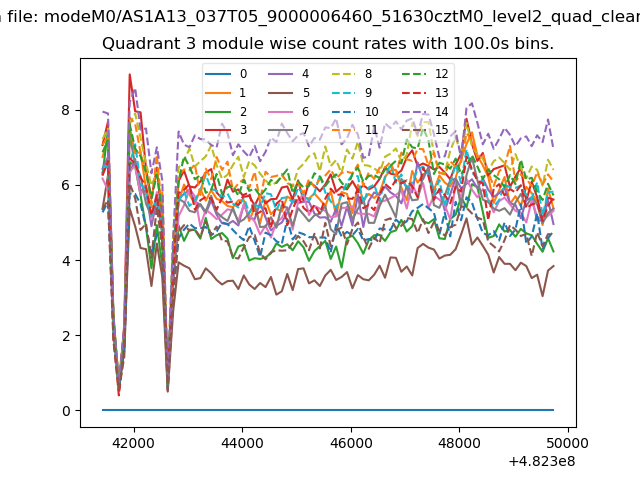 |
 |
| Parameter | Plot |
|---|---|
| CZT HV Monitor | 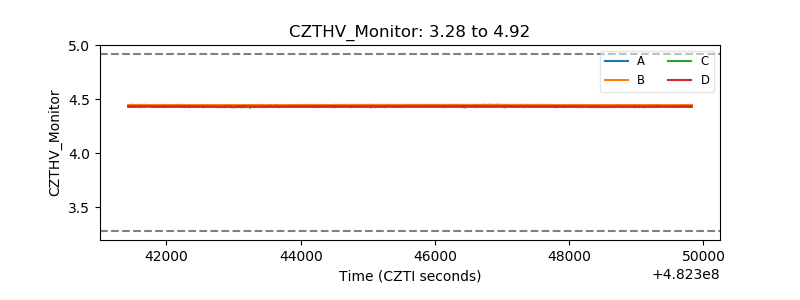 |
| D_VDD | 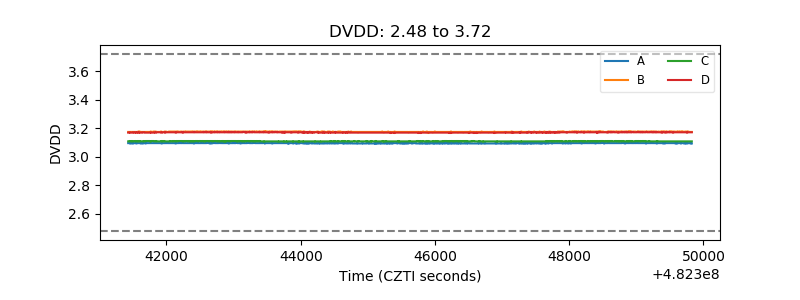 |
| Temperature 1 | 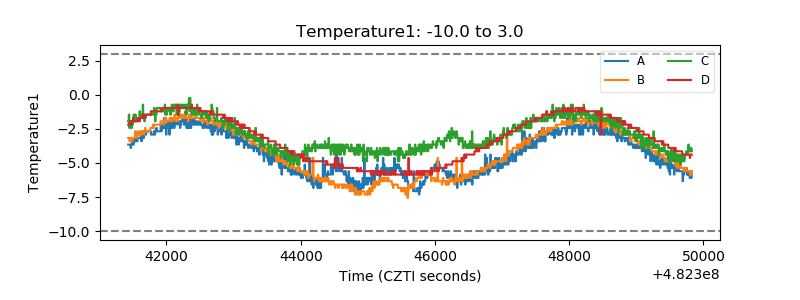 |
| Veto HV Monitor | 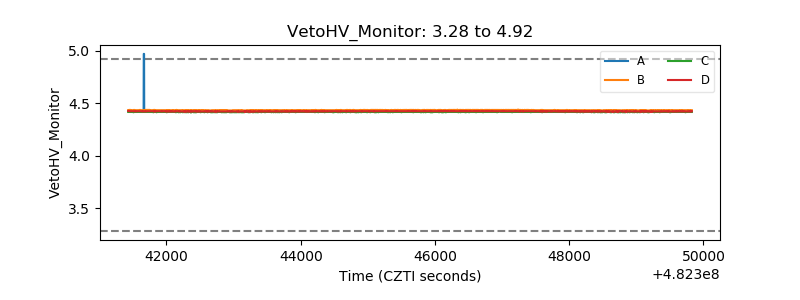 |
| Veto LLD | 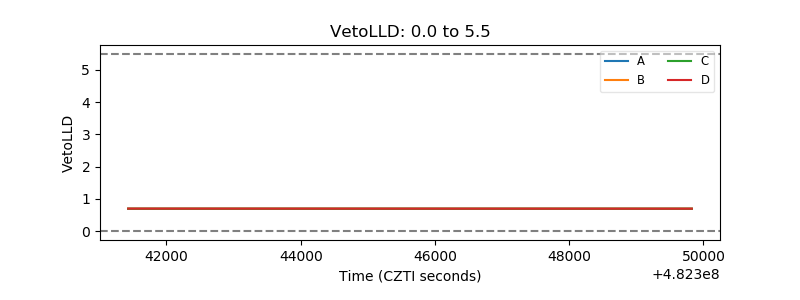 |
| Alpha Counter | 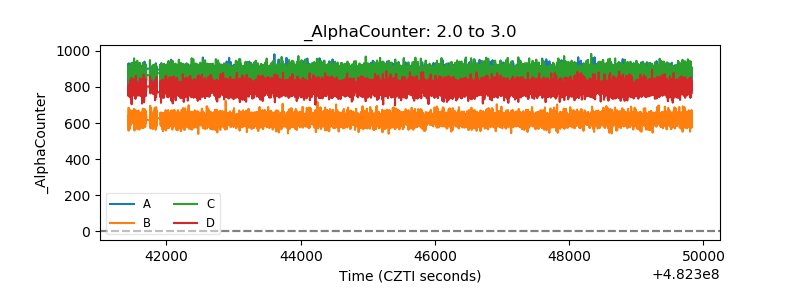 |
| _CPM_Rate | 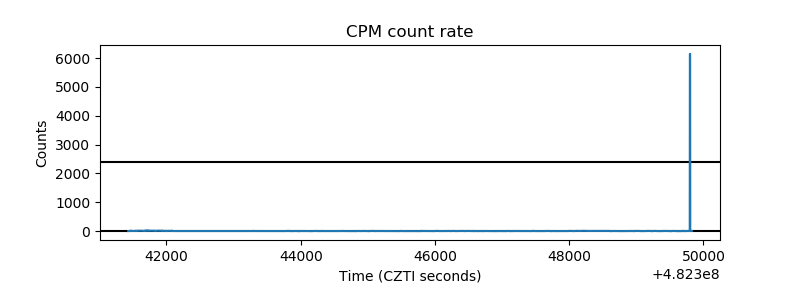 |
| CZT Counter | 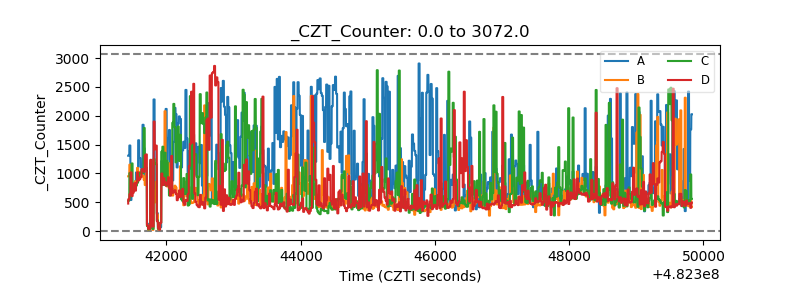 |
| +2.5 Volts monitor | 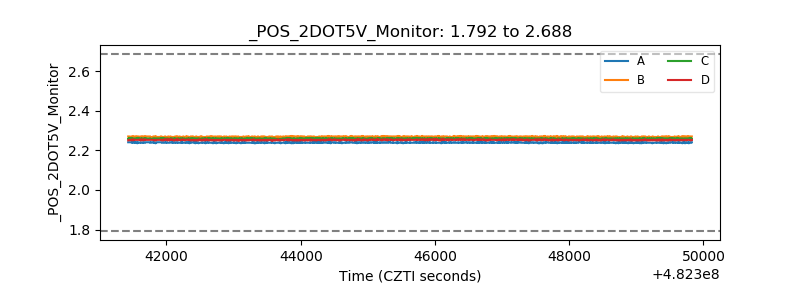 |
| +5 Volts monitor | 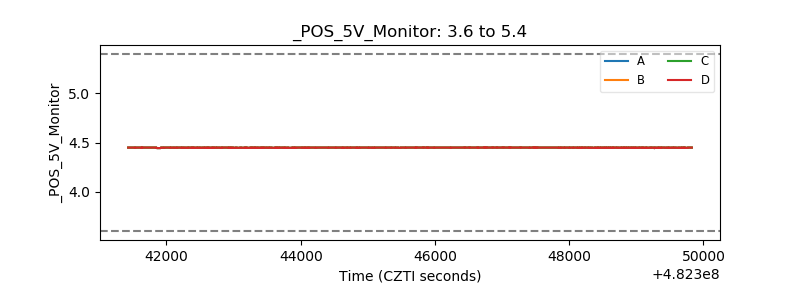 |
| _ROLL_ROT | 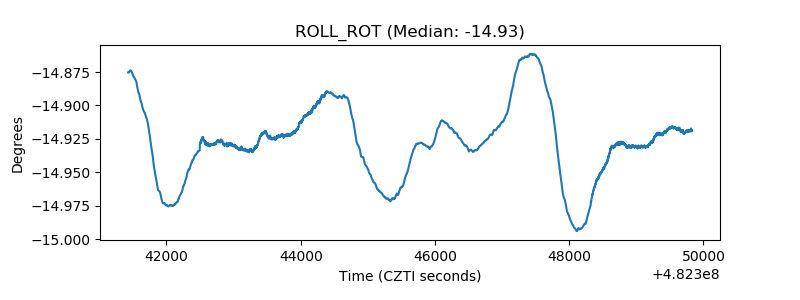 |
| _Roll_DEC | 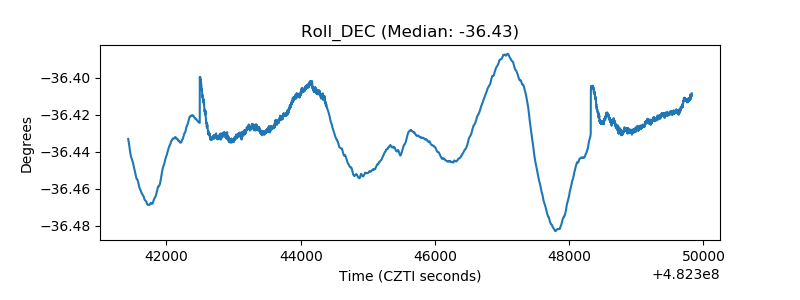 |
| _Roll_RA | 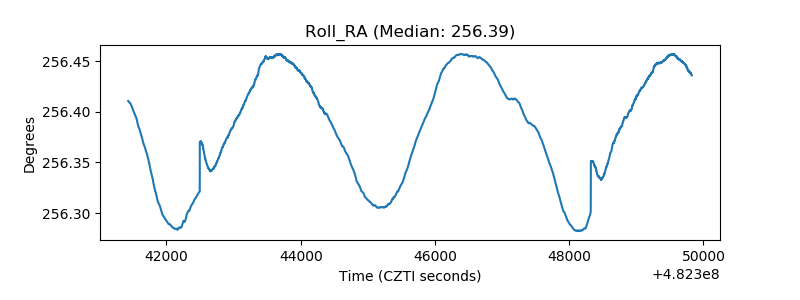 |
| Veto Counter | 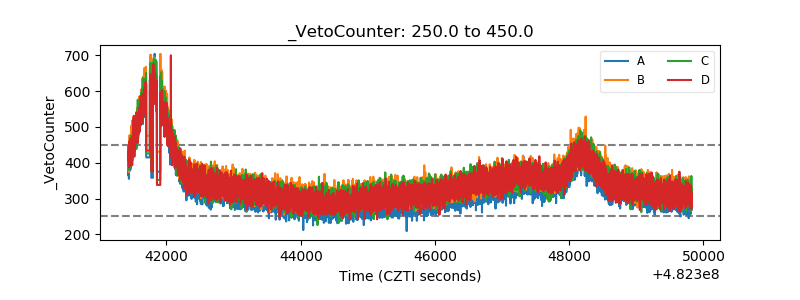 |