| Param | Original file | Final file |
|---|---|---|
| Filename | modeM0/AS1A13_037T05_9000006460_51638cztM0_level2.fits | modeM0/AS1A13_037T05_9000006460_51638cztM0_level2_quad_clean.evt |
| Size (bytes) | 2,328,318,720 | 349,090,560 |
| Size | 2.2 GB | 332.9 MB |
| Events in quadrant A | 19,820,278 | 2,249,302 |
| Events in quadrant B | 21,571,147 | 2,396,157 |
| Events in quadrant C | 22,959,548 | 2,151,487 |
| Events in quadrant D | 19,862,247 | 2,010,499 |
| Mode M9 | |||
|---|---|---|---|
| Quadrant | BADHDUFLAG | Total packets | Discarded packets |
| A | 0 | 16 | 0 |
| B | 0 | 16 | 0 |
| C | 0 | 16 | 0 |
| D | 0 | 16 | 0 |
| Mode M0 | |||
|---|---|---|---|
| Quadrant | BADHDUFLAG | Total packets | Discarded packets |
| A | 0 | 76881 | 3 |
| B | 0 | 81789 | 3 |
| C | 0 | 85953 | 3 |
| D | 0 | 77357 | 3 |
| Mode SS | |||
|---|---|---|---|
| Quadrant | BADHDUFLAG | Total packets | Discarded packets |
| A | 0 | 522 | 0 |
| B | 0 | 522 | 0 |
| C | 0 | 522 | 0 |
| D | 0 | 522 | 0 |
| Quadrant | Total seconds | Saturated seconds | Saturation percentage |
|---|---|---|---|
| A | 25602 | 2073 | 8.097024% |
| B | 25602 | 2691 | 10.510898% |
| C | 25602 | 2217 | 8.659480% |
| D | 25603 | 2176 | 8.499004% |
Noise dominated data is calculated using 1-second bins in cleaned event files. If a bin has >2000 counts, and if more than 50% of those come from <1% of pixels, then it is considered to be noise-dominated and hence unusable.
| Quadrant | # 1 sec bins | Bins with >0 counts | Bins with >2000 counts | High rate bins dominated by noise | Noise dominated (total time) | Noise dominated (detector-on time) | Marked lightcurve |
|---|---|---|---|---|---|---|---|
| A | 27282 | 25606 | 1112 | 1112 | 4.08% | 4.34% | 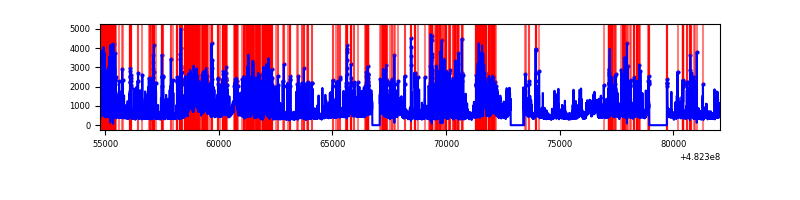 |
| B | 27282 | 25606 | 1868 | 1868 | 6.85% | 7.30% | 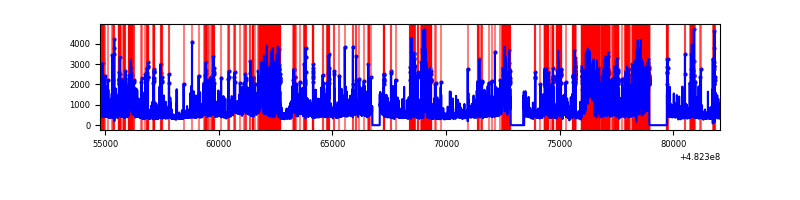 |
| C | 27282 | 25606 | 1895 | 1895 | 6.95% | 7.40% |  |
| D | 27283 | 25607 | 1874 | 1874 | 6.87% | 7.32% | 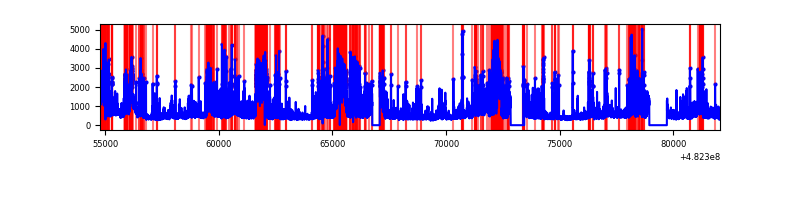 |
Top three noisy pixels from each quadrant. If the there are fewer than three noisy pixels in the level2.evt file, extra rows are filled as -1
| Pixel properties | Quadrant properties | ||||||
|---|---|---|---|---|---|---|---|
| Quadrant | DetID | PixID | Counts | Sigma | Mean | Median | Sigma |
| A | 7 | 64 | 2849888 | 4351.86 | 2675 | 2610 | 654.3 |
| A | 12 | 250 | 2843021 | 4341.36 | 2675 | 2610 | 654.3 |
| A | 12 | 3 | 580218 | 882.83 | 2675 | 2610 | 654.3 |
| B | 10 | 44 | 3978515 | 7084.82 | 2636 | 2544 | 561.2 |
| B | 5 | 172 | 2404390 | 4279.87 | 2636 | 2544 | 561.2 |
| B | 10 | 41 | 691207 | 1227.13 | 2636 | 2544 | 561.2 |
| C | 5 | 250 | 8151082 | 11412.76 | 2622 | 2610 | 714.0 |
| C | 15 | 189 | 994325 | 1389.0 | 2622 | 2610 | 714.0 |
| C | 15 | 147 | 861636 | 1203.15 | 2622 | 2610 | 714.0 |
| D | 7 | 60 | 2669553 | 3714.36 | 2584 | 2491 | 718.0 |
| D | 3 | 12 | 1963809 | 2731.49 | 2584 | 2491 | 718.0 |
| D | 1 | 3 | 977118 | 1357.34 | 2584 | 2491 | 718.0 |
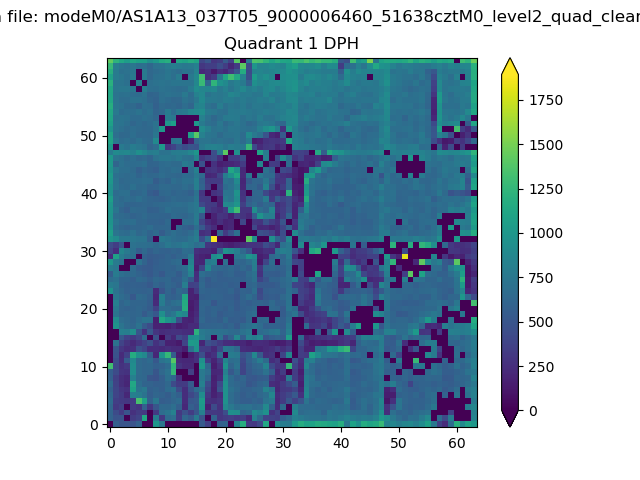
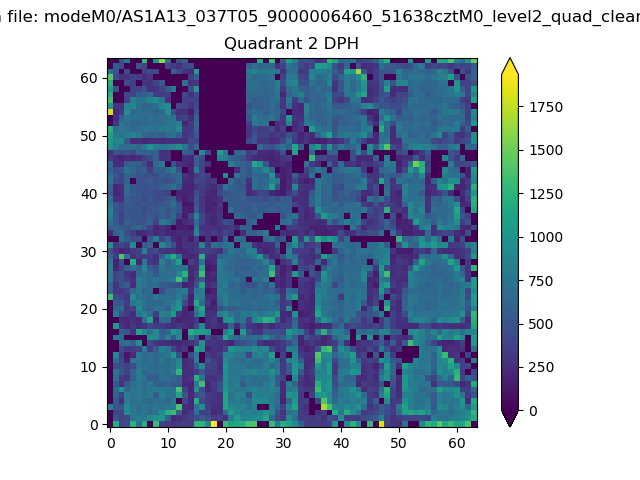
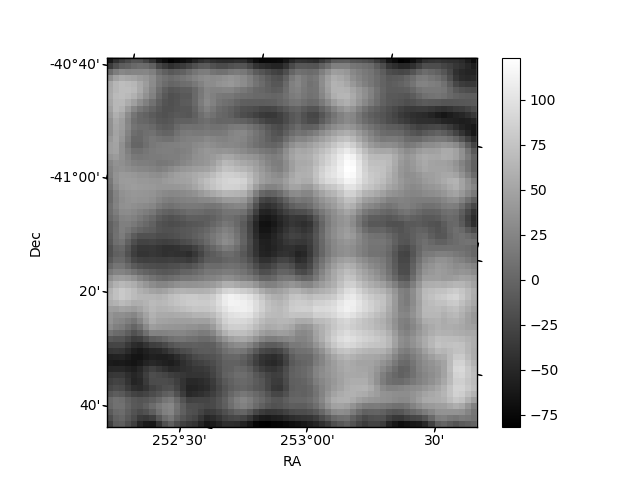
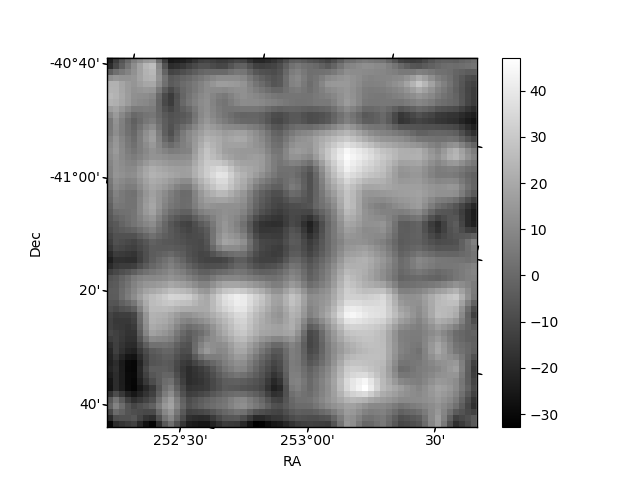
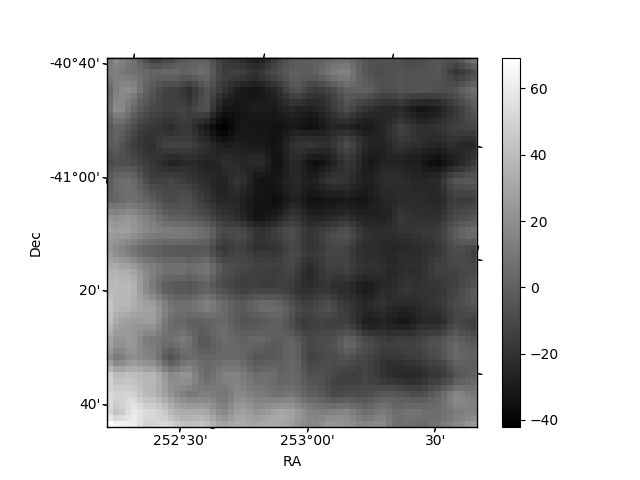
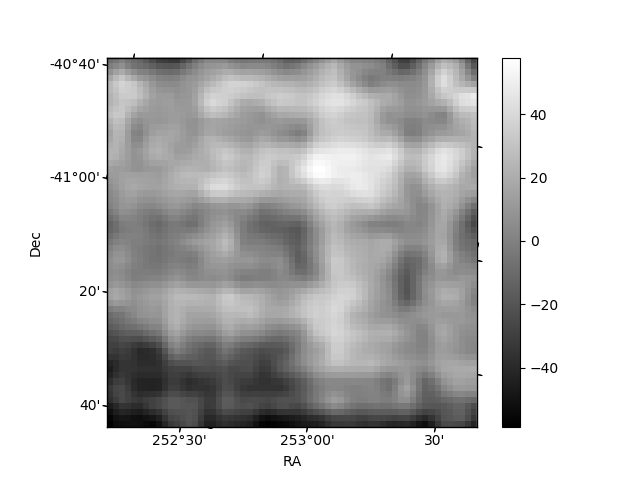
Histogram calculated using DETX and DETY for each event in the final _common_clean file
| Quadrant A | 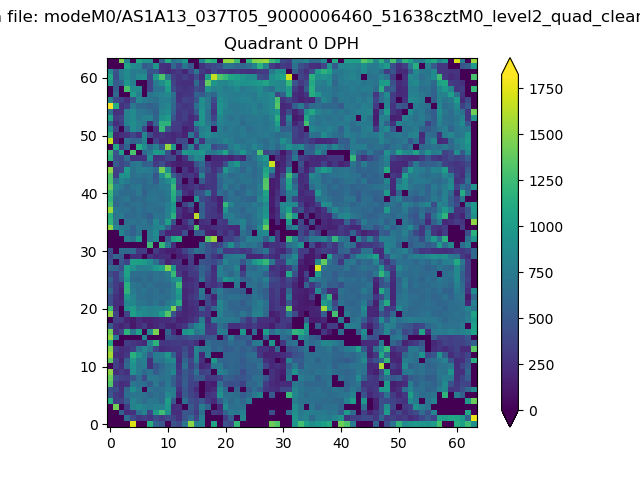 |
 |
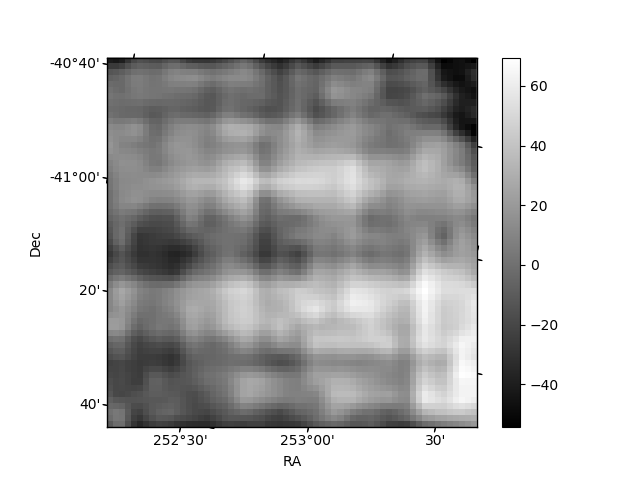
Quadrant B |
|---|---|---|---|
| Quadrant D | 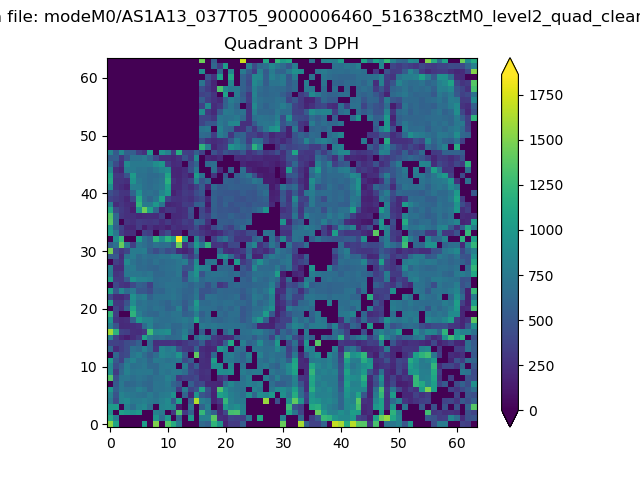 |
 |
Quadrant C |
| Plot type | Count rate plots | Images |
|---|---|---|
| Comparison with Poisson distribution Blue bars denote a histogram of data divided into 1 sec bins. Red curve is a Poisson curve with rate = median count rate of data. |
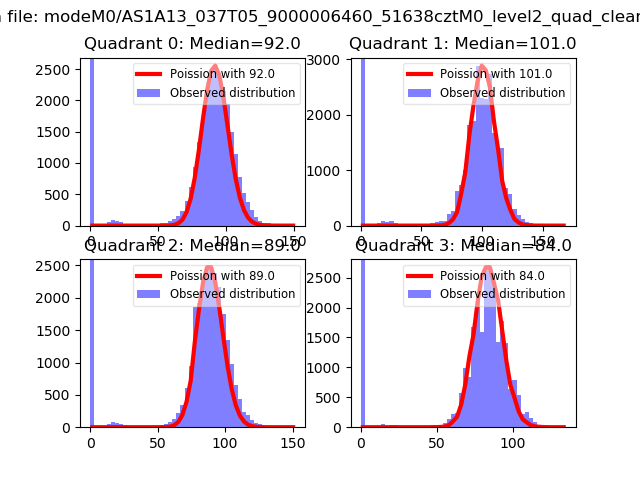 |
 |
| Quadrant-wise count rates Data is divided into 100 sec bins |
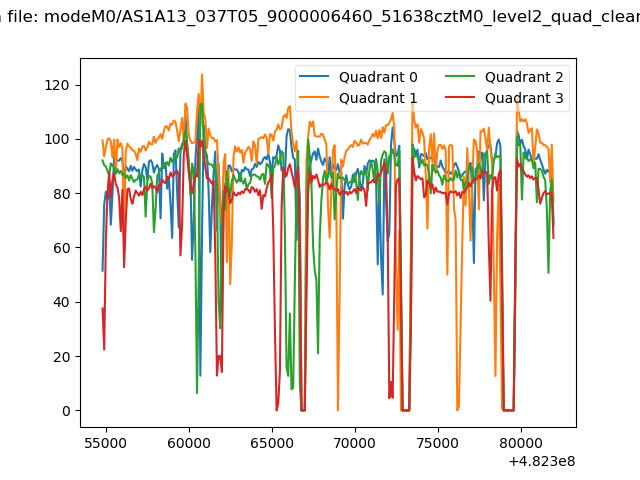 |
|
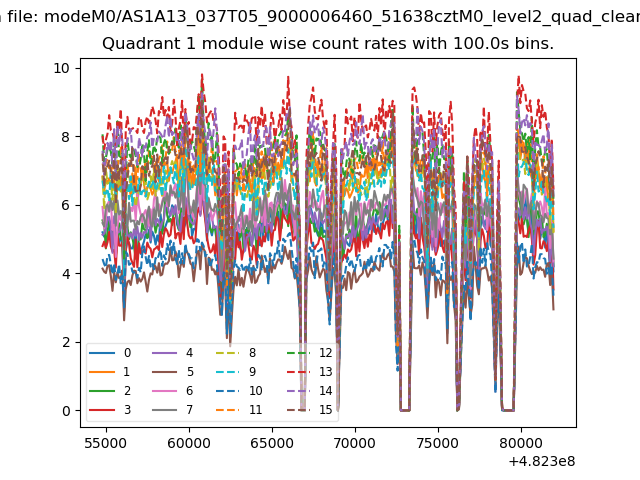
| Module-wise count rates for Quadrant A Data is divided into 100 sec bins |
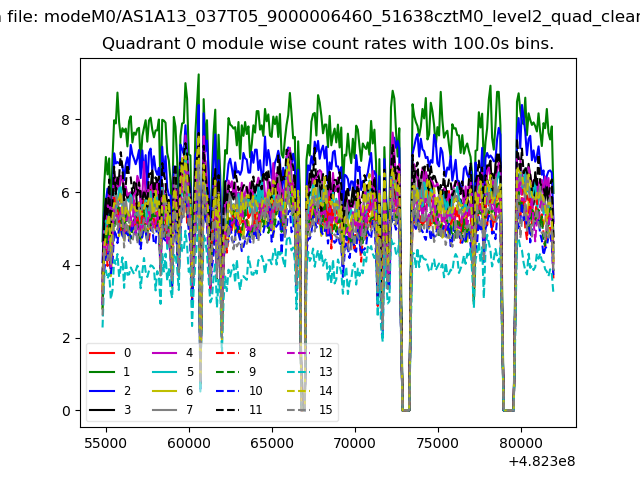 |
 |
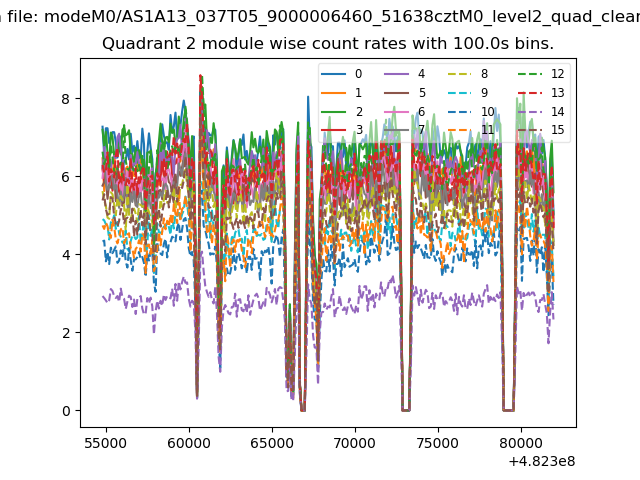
| Module-wise count rates for Quadrant B Data is divided into 100 sec bins |
 |
 |
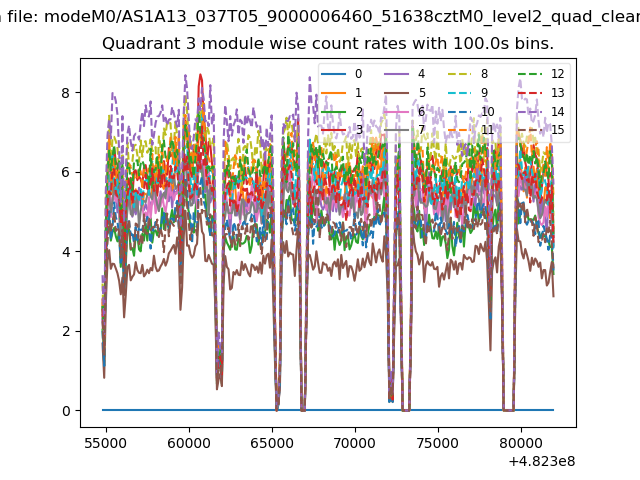
| Module-wise count rates for Quadrant C Data is divided into 100 sec bins |
 |
 |
| Module-wise count rates for Quadrant D Data is divided into 100 sec bins |
 |
 |
| Parameter | Plot |
|---|---|
| CZT HV Monitor | 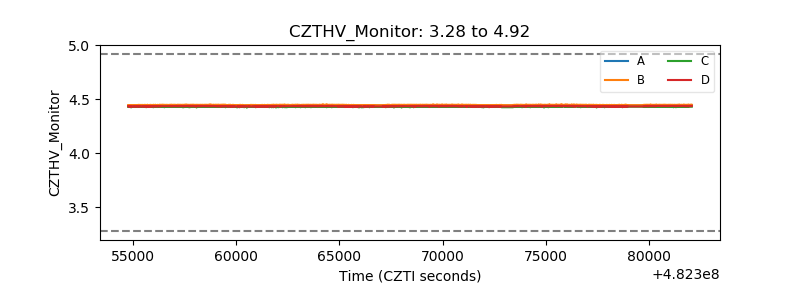 |
| D_VDD | 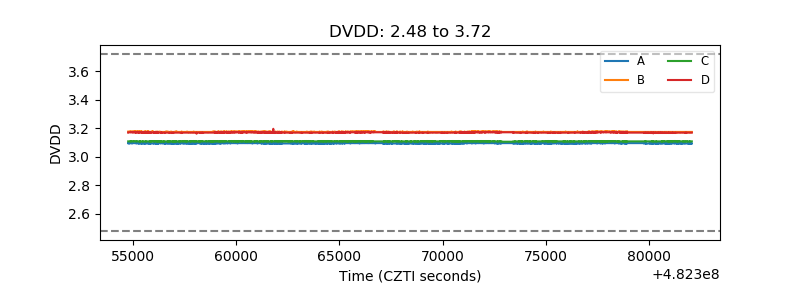 |
| Temperature 1 | 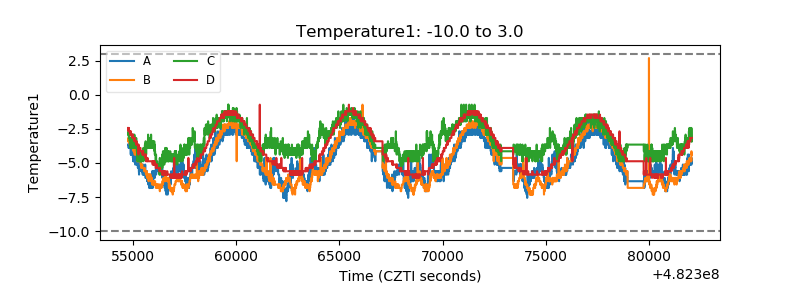 |
| Veto HV Monitor | 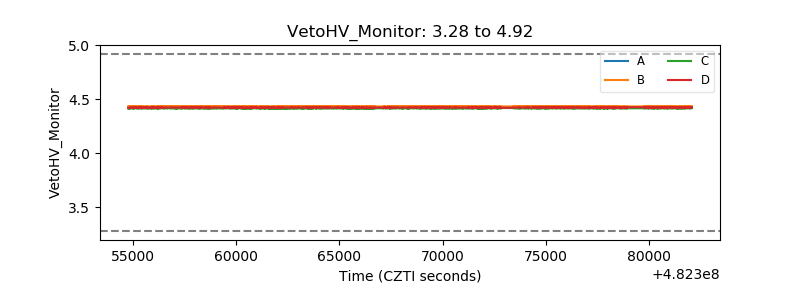 |
| Veto LLD | 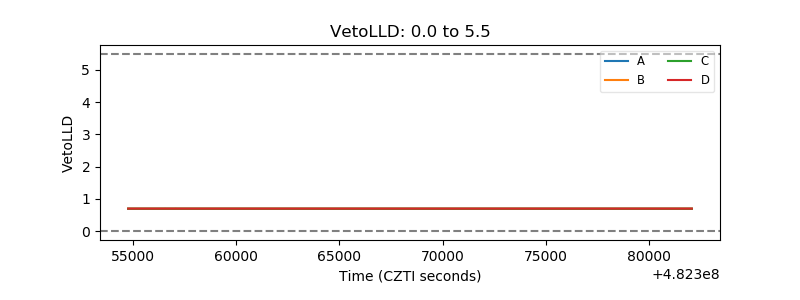 |
| Alpha Counter | 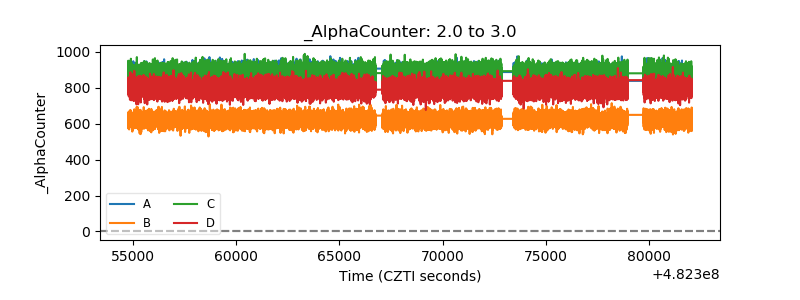 |
| _CPM_Rate | 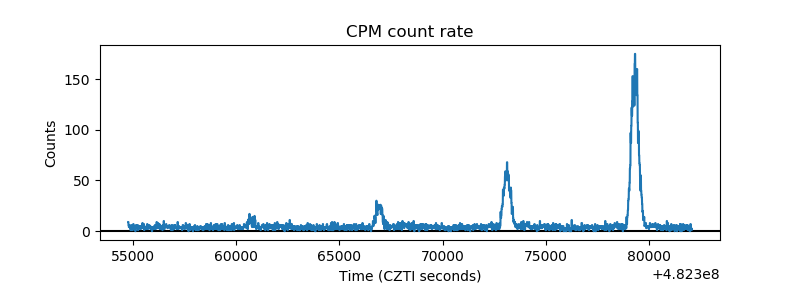 |
| CZT Counter | 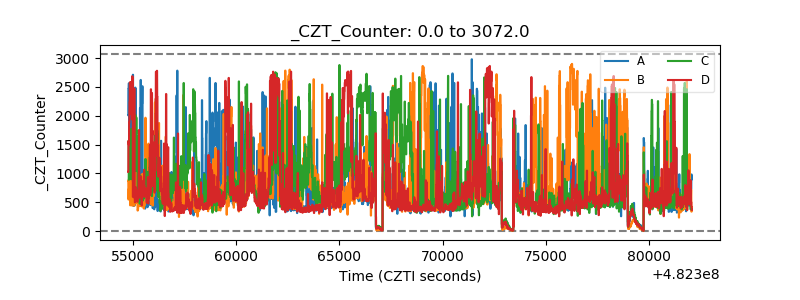 |
| +2.5 Volts monitor | 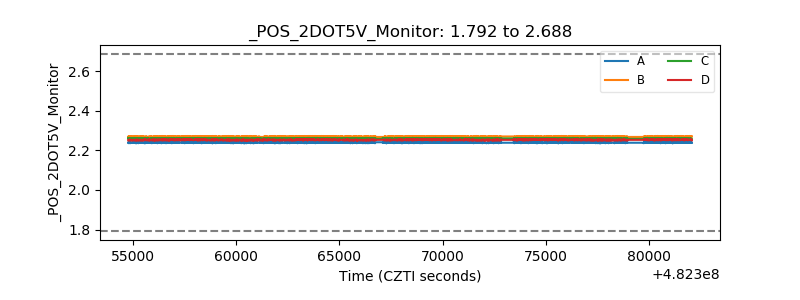 |
| +5 Volts monitor | 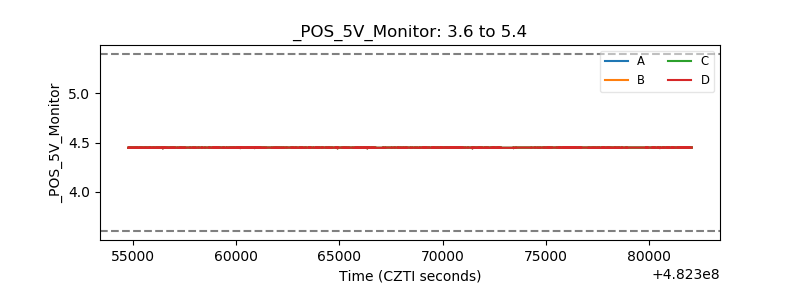 |
| _ROLL_ROT | 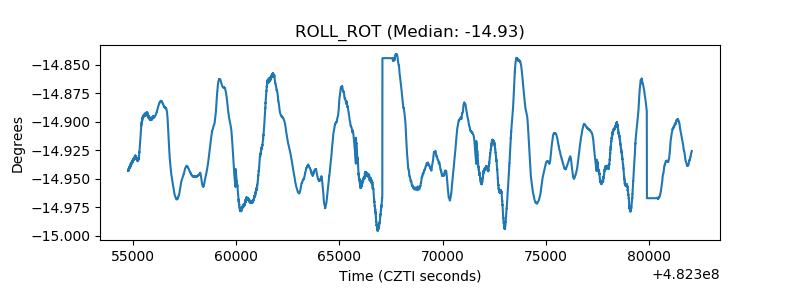 |
| _Roll_DEC | 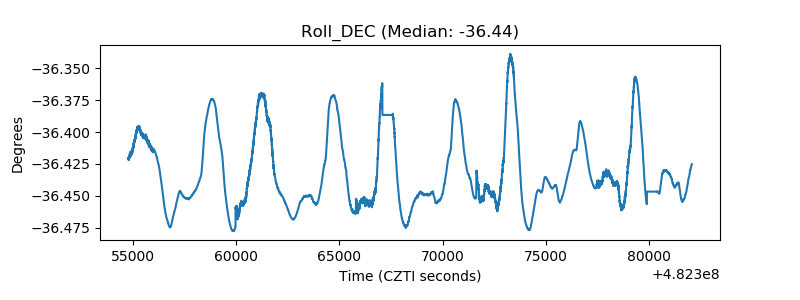 |
| _Roll_RA | 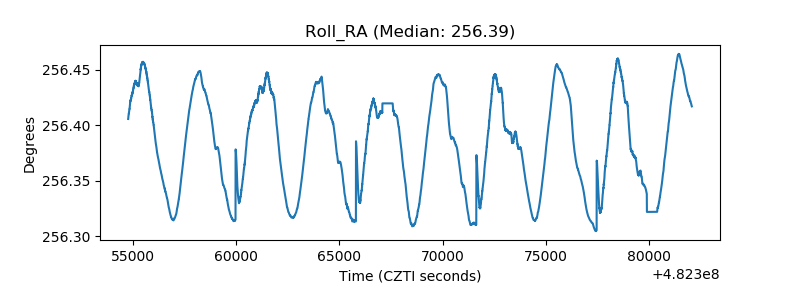 |
| Veto Counter | 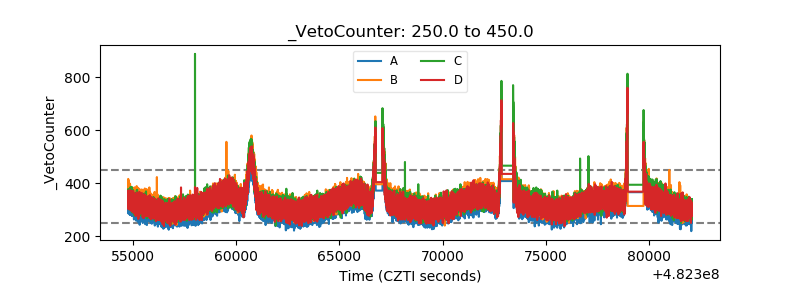 |