| Param | Original file | Final file |
|---|---|---|
| Filename | modeM0/AS1A13_037T05_9000006460_51639cztM0_level2.fits | modeM0/AS1A13_037T05_9000006460_51639cztM0_level2_quad_clean.evt |
| Size (bytes) | 1,299,093,120 | 211,930,560 |
| Size | 1.2 GB | 202.1 MB |
| Events in quadrant A | 10,401,637 | 1,406,080 |
| Events in quadrant B | 15,239,352 | 1,325,477 |
| Events in quadrant C | 12,168,287 | 1,331,444 |
| Events in quadrant D | 9,102,979 | 1,304,425 |
| Mode M9 | |||
|---|---|---|---|
| Quadrant | BADHDUFLAG | Total packets | Discarded packets |
| A | 0 | 32 | 0 |
| B | 0 | 32 | 0 |
| C | 0 | 32 | 0 |
| D | 0 | 32 | 0 |
| Mode M0 | |||
|---|---|---|---|
| Quadrant | BADHDUFLAG | Total packets | Discarded packets |
| A | 0 | 41403 | 3 |
| B | 0 | 55692 | 3 |
| C | 0 | 46591 | 3 |
| D | 0 | 37366 | 3 |
| Mode SS | |||
|---|---|---|---|
| Quadrant | BADHDUFLAG | Total packets | Discarded packets |
| A | 0 | 308 | 0 |
| B | 0 | 308 | 0 |
| C | 0 | 308 | 0 |
| D | 0 | 308 | 0 |
| Quadrant | Total seconds | Saturated seconds | Saturation percentage |
|---|---|---|---|
| A | 15212 | 890 | 5.850644% |
| B | 15213 | 2782 | 18.286991% |
| C | 15213 | 1377 | 9.051469% |
| D | 15213 | 421 | 2.767370% |
Noise dominated data is calculated using 1-second bins in cleaned event files. If a bin has >2000 counts, and if more than 50% of those come from <1% of pixels, then it is considered to be noise-dominated and hence unusable.
| Quadrant | # 1 sec bins | Bins with >0 counts | Bins with >2000 counts | High rate bins dominated by noise | Noise dominated (total time) | Noise dominated (detector-on time) | Marked lightcurve |
|---|---|---|---|---|---|---|---|
| A | 18277 | 15215 | 600 | 600 | 3.28% | 3.94% | 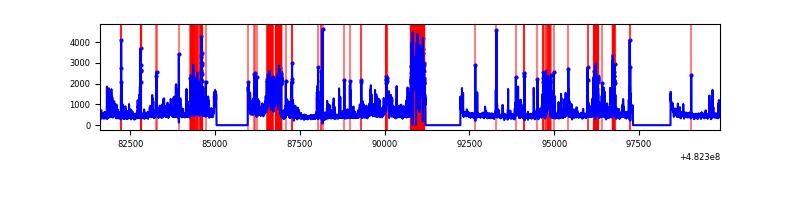 |
| B | 18278 | 15215 | 2033 | 2033 | 11.12% | 13.36% | 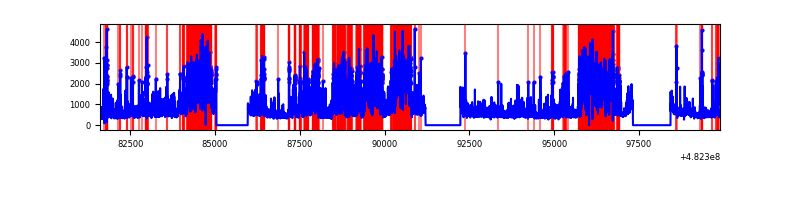 |
| C | 18278 | 15216 | 971 | 971 | 5.31% | 6.38% | 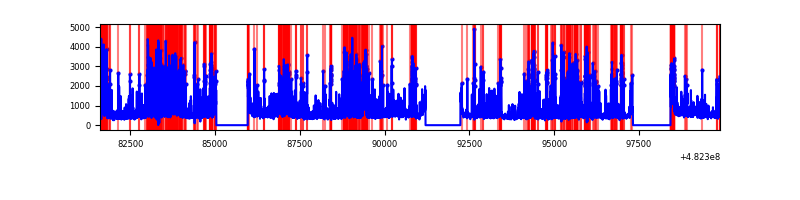 |
| D | 18278 | 15216 | 249 | 249 | 1.36% | 1.64% | 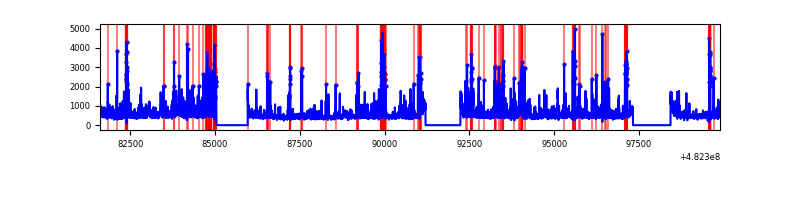 |
Top three noisy pixels from each quadrant. If the there are fewer than three noisy pixels in the level2.evt file, extra rows are filled as -1
| Pixel properties | Quadrant properties | ||||||
|---|---|---|---|---|---|---|---|
| Quadrant | DetID | PixID | Counts | Sigma | Mean | Median | Sigma |
| A | 15 | 174 | 1046364 | 2594.99 | 1645 | 1602 | 402.6 |
| A | 12 | 80 | 884154 | 2192.09 | 1645 | 1602 | 402.6 |
| A | 12 | 250 | 657870 | 1630.04 | 1645 | 1602 | 402.6 |
| B | 10 | 44 | 6553494 | 19845.33 | 1558 | 1505 | 330.2 |
| B | 8 | 128 | 345999 | 1043.44 | 1558 | 1505 | 330.2 |
| B | 1 | 223 | 280022 | 843.6 | 1558 | 1505 | 330.2 |
| C | 12 | 254 | 1972061 | 4510.88 | 1589 | 1574 | 436.8 |
| C | 15 | 189 | 1683856 | 3851.12 | 1589 | 1574 | 436.8 |
| C | 0 | 192 | 768126 | 1754.81 | 1589 | 1574 | 436.8 |
| D | 6 | 42 | 477943 | 1055.76 | 1636 | 1577 | 451.2 |
| D | 8 | 176 | 405148 | 894.43 | 1636 | 1577 | 451.2 |
| D | 1 | 3 | 400341 | 883.78 | 1636 | 1577 | 451.2 |
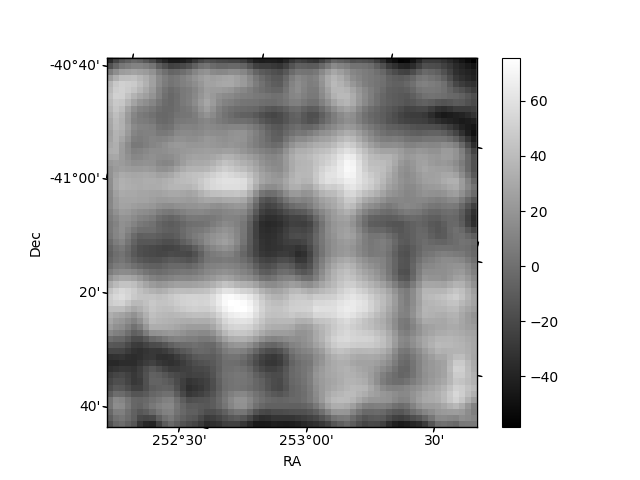
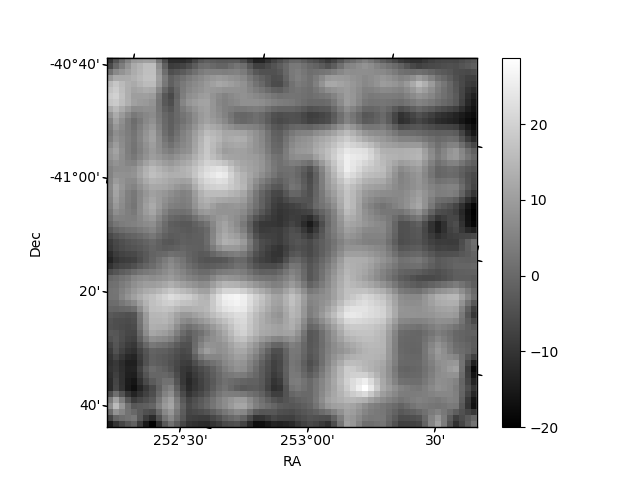
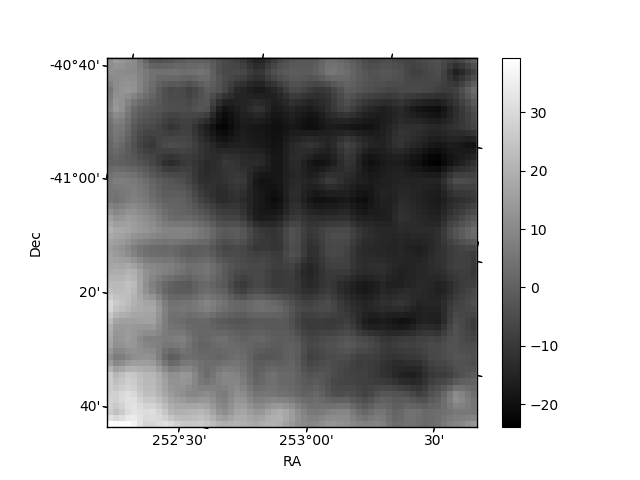
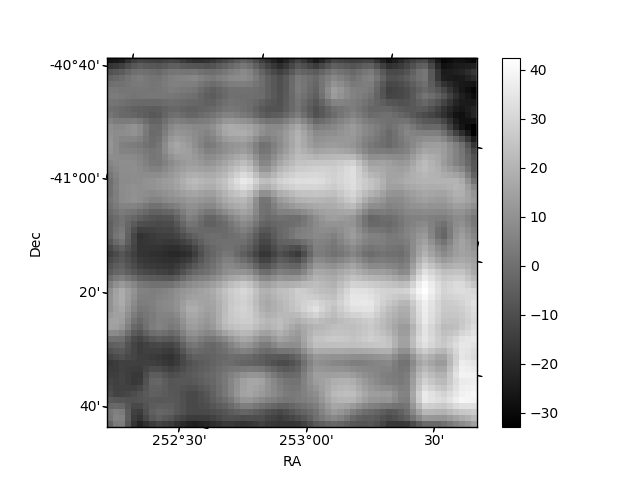
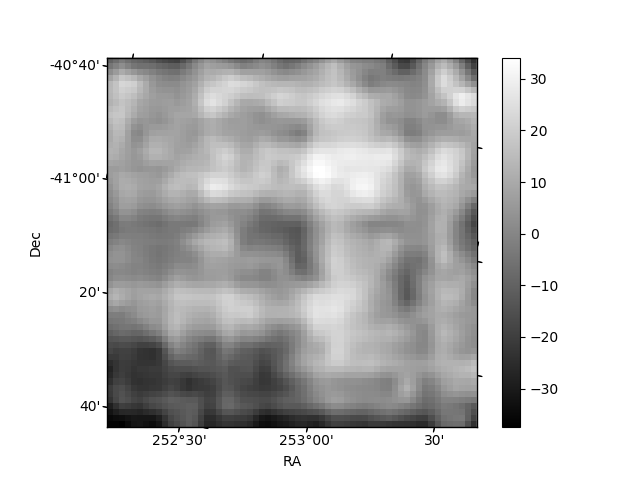
Histogram calculated using DETX and DETY for each event in the final _common_clean file
| Quadrant A | 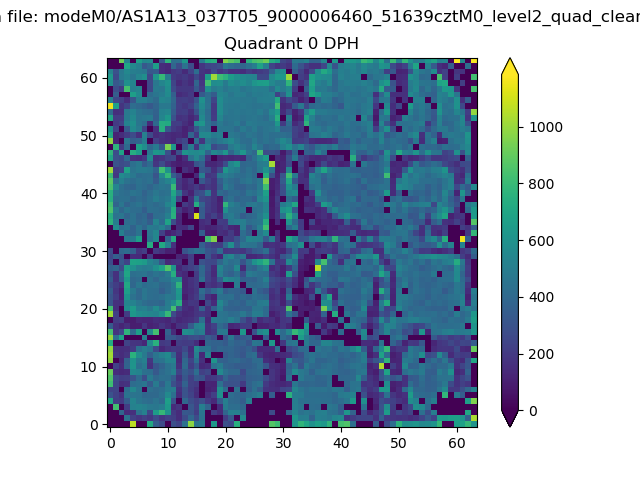 |
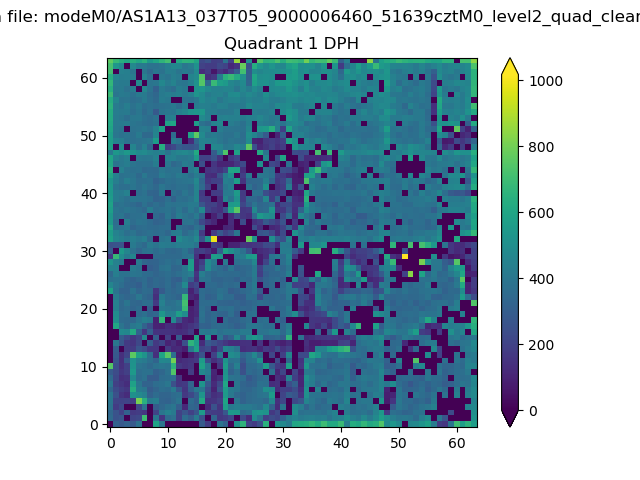 |
Quadrant B |
|---|---|---|---|
| Quadrant D | 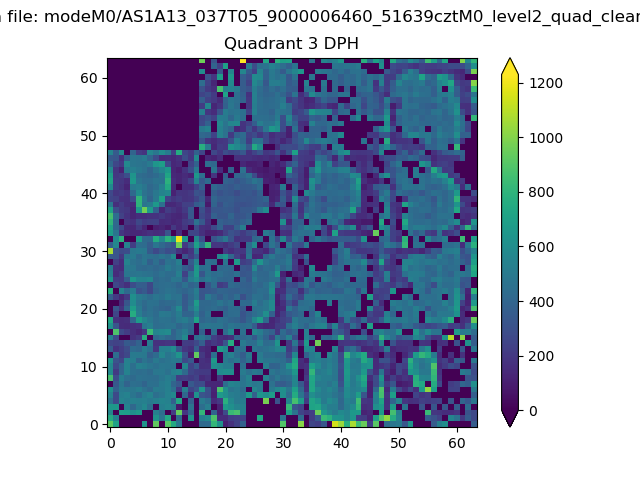 |
 |
Quadrant C |
| Plot type | Count rate plots | Images |
|---|---|---|
| Comparison with Poisson distribution Blue bars denote a histogram of data divided into 1 sec bins. Red curve is a Poisson curve with rate = median count rate of data. |
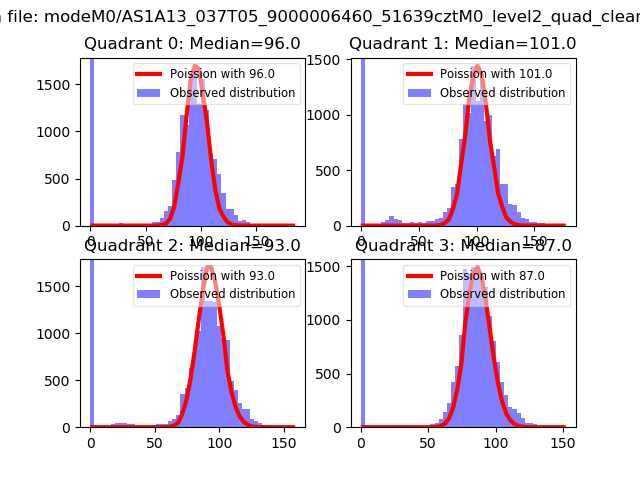 |
 |
| Quadrant-wise count rates Data is divided into 100 sec bins |
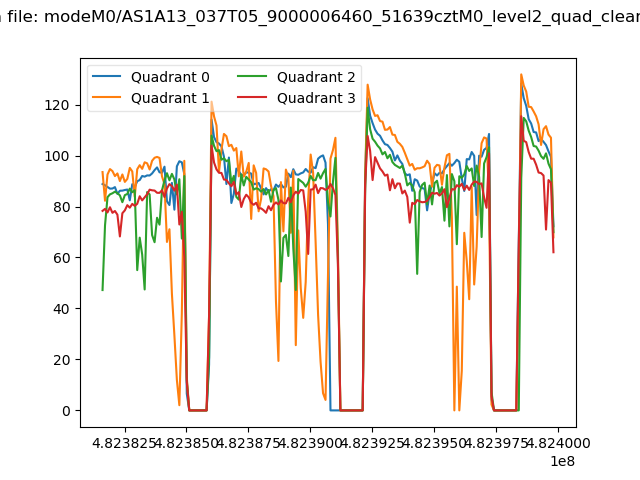 |
|
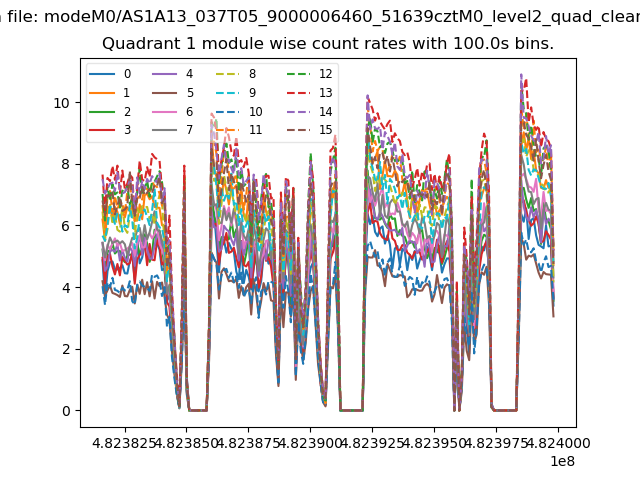
| Module-wise count rates for Quadrant A Data is divided into 100 sec bins |
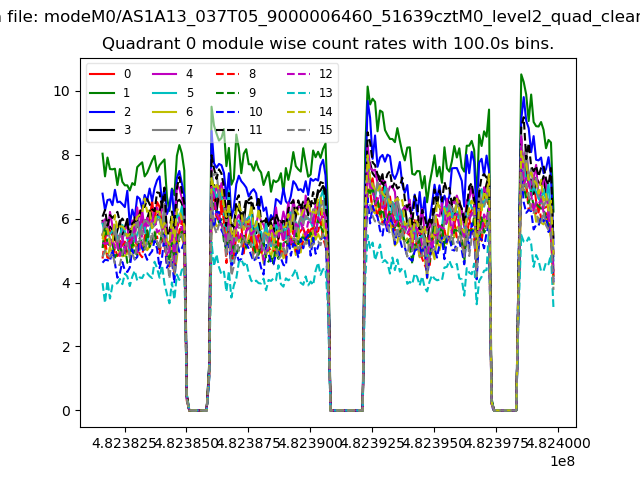 |
 |
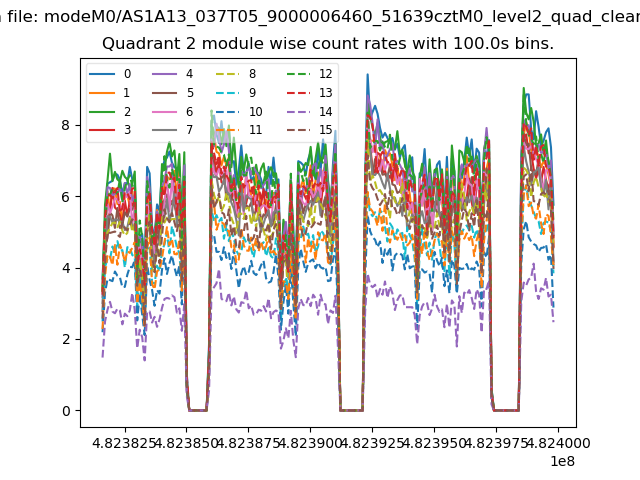
| Module-wise count rates for Quadrant B Data is divided into 100 sec bins |
 |
 |
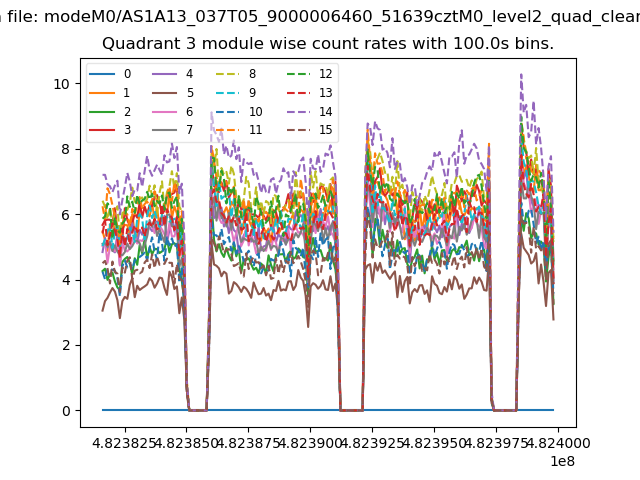
| Module-wise count rates for Quadrant C Data is divided into 100 sec bins |
 |
 |
| Module-wise count rates for Quadrant D Data is divided into 100 sec bins |
 |
 |
| Parameter | Plot |
|---|---|
| CZT HV Monitor | 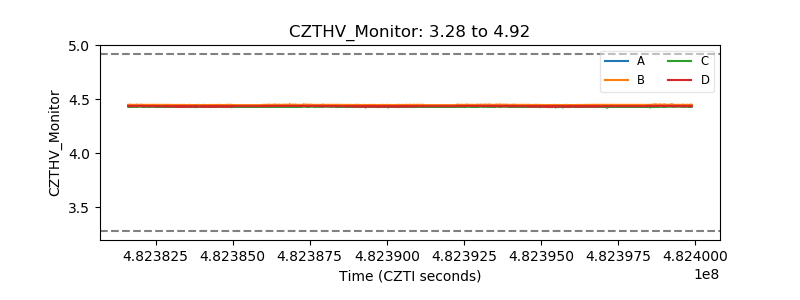 |
| D_VDD | 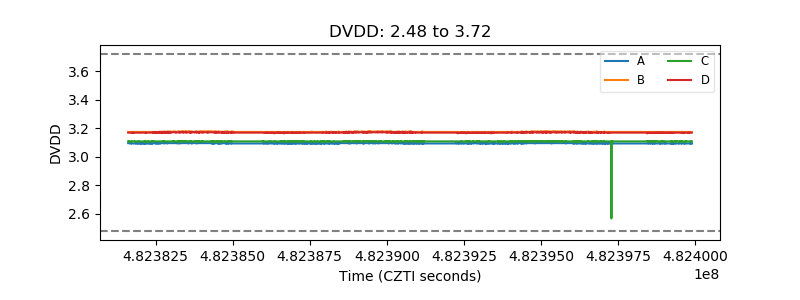 |
| Temperature 1 | 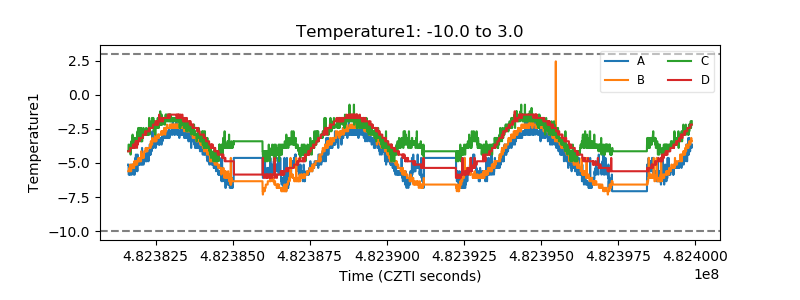 |
| Veto HV Monitor | 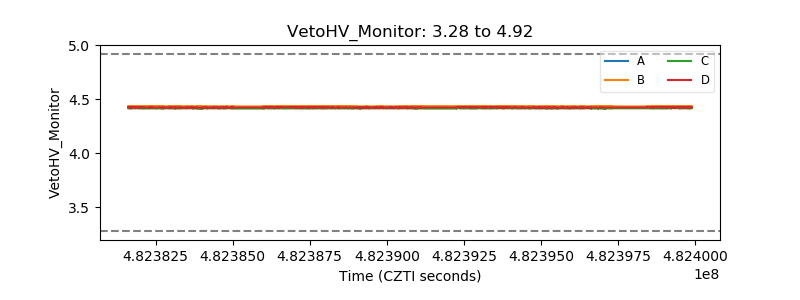 |
| Veto LLD | 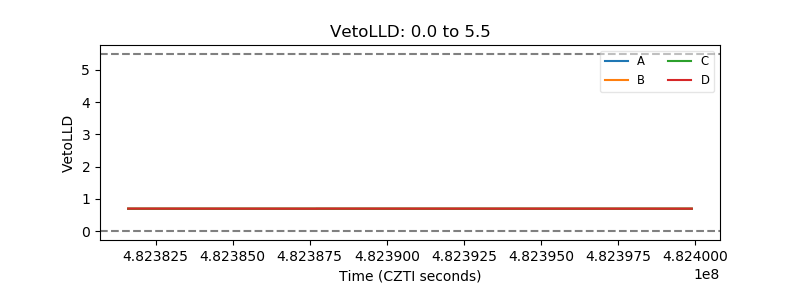 |
| Alpha Counter | 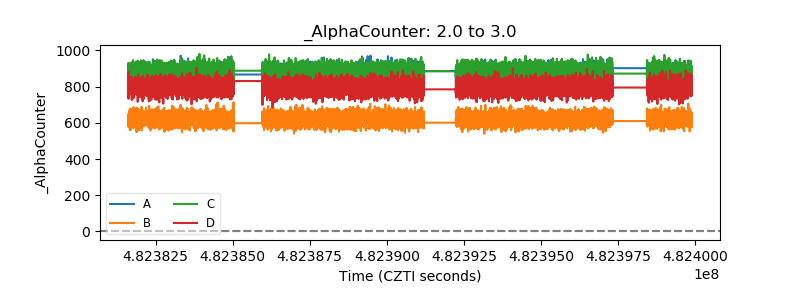 |
| _CPM_Rate | 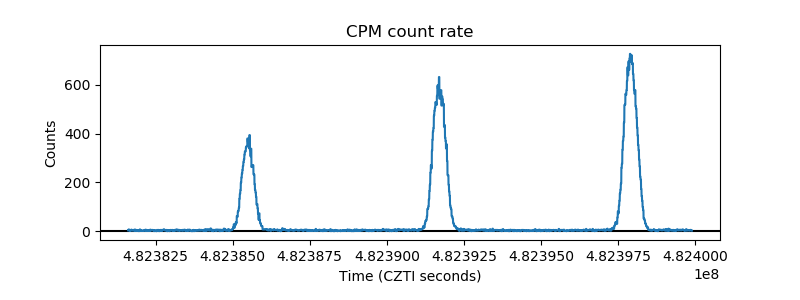 |
| CZT Counter | 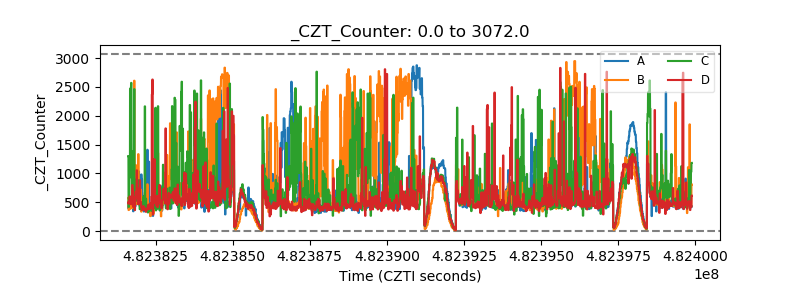 |
| +2.5 Volts monitor | 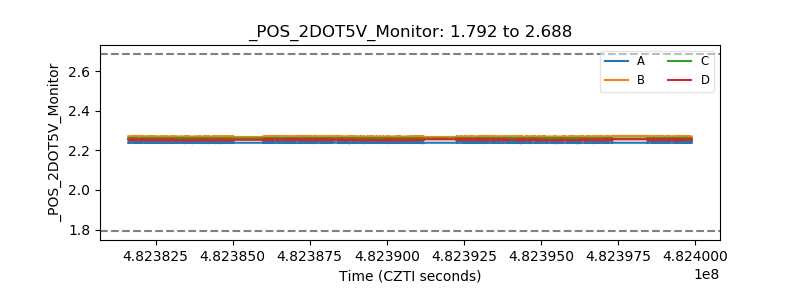 |
| +5 Volts monitor | 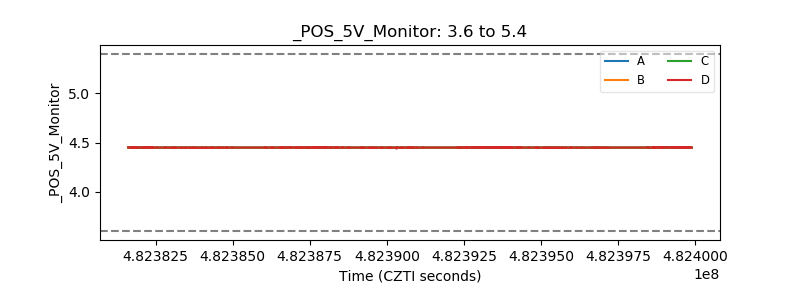 |
| _ROLL_ROT | 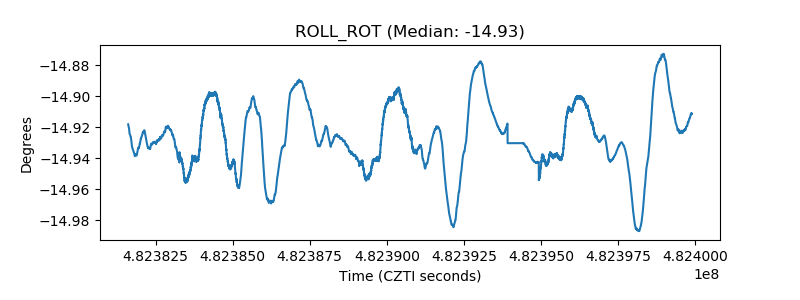 |
| _Roll_DEC | 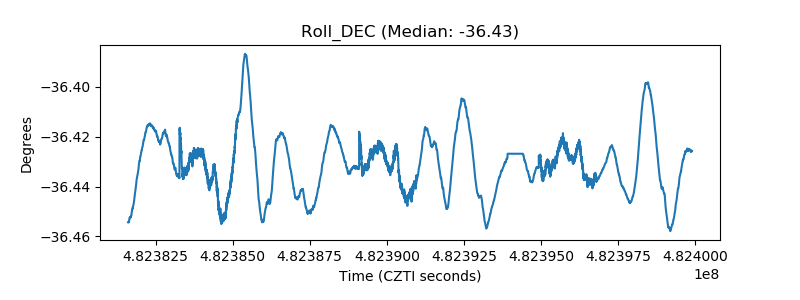 |
| _Roll_RA | 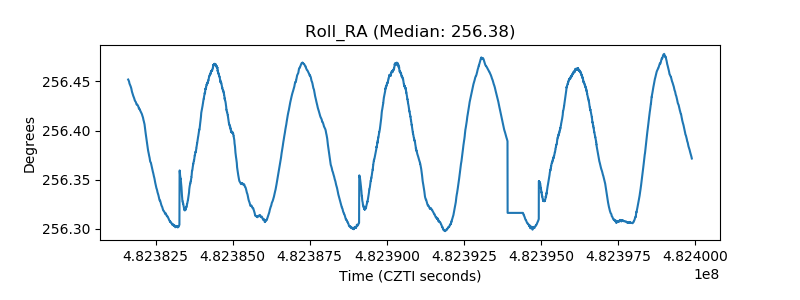 |
| Veto Counter | 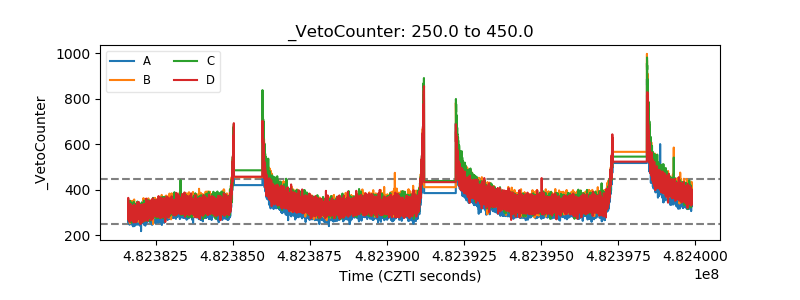 |