| Param | Original file | Final file |
|---|---|---|
| Filename | modeM0/AS1A13_037T05_9000006460_51640cztM0_level2.fits | modeM0/AS1A13_037T05_9000006460_51640cztM0_level2_quad_clean.evt |
| Size (bytes) | 454,821,120 | 97,646,400 |
| Size | 433.8 MB | 93.1 MB |
| Events in quadrant A | 3,864,405 | 637,947 |
| Events in quadrant B | 4,404,235 | 685,074 |
| Events in quadrant C | 4,377,746 | 610,038 |
| Events in quadrant D | 3,696,567 | 581,320 |
| Mode M9 | |||
|---|---|---|---|
| Quadrant | BADHDUFLAG | Total packets | Discarded packets |
| A | 0 | 11 | 0 |
| B | 0 | 11 | 0 |
| C | 0 | 11 | 0 |
| D | 0 | 11 | 0 |
| Mode M0 | |||
|---|---|---|---|
| Quadrant | BADHDUFLAG | Total packets | Discarded packets |
| A | 0 | 15700 | 2 |
| B | 0 | 17261 | 1 |
| C | 0 | 17270 | 1 |
| D | 0 | 15108 | 1 |
| Mode SS | |||
|---|---|---|---|
| Quadrant | BADHDUFLAG | Total packets | Discarded packets |
| A | 0 | 128 | 0 |
| B | 0 | 128 | 0 |
| C | 0 | 128 | 0 |
| D | 0 | 128 | 0 |
| Quadrant | Total seconds | Saturated seconds | Saturation percentage |
|---|---|---|---|
| A | 6344 | 266 | 4.192938% |
| B | 6344 | 328 | 5.170240% |
| C | 6344 | 313 | 4.933796% |
| D | 6345 | 167 | 2.631994% |
Noise dominated data is calculated using 1-second bins in cleaned event files. If a bin has >2000 counts, and if more than 50% of those come from <1% of pixels, then it is considered to be noise-dominated and hence unusable.
| Quadrant | # 1 sec bins | Bins with >0 counts | Bins with >2000 counts | High rate bins dominated by noise | Noise dominated (total time) | Noise dominated (detector-on time) | Marked lightcurve |
|---|---|---|---|---|---|---|---|
| A | 7449 | 6345 | 147 | 147 | 1.97% | 2.32% | 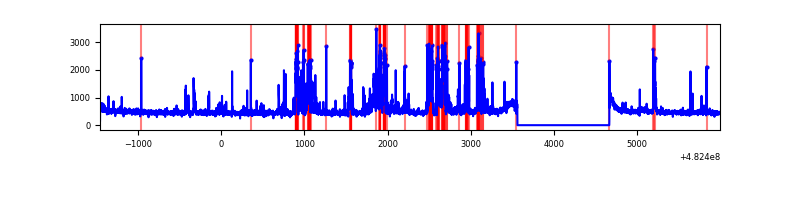 |
| B | 7449 | 6345 | 141 | 141 | 1.89% | 2.22% | 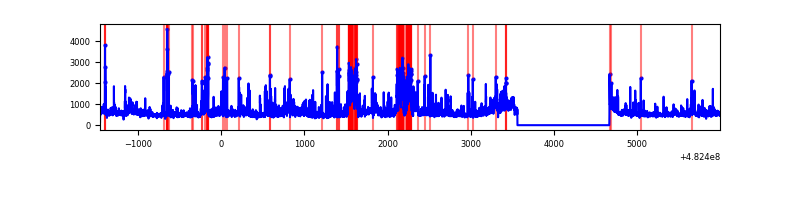 |
| C | 7449 | 6345 | 185 | 185 | 2.48% | 2.92% | 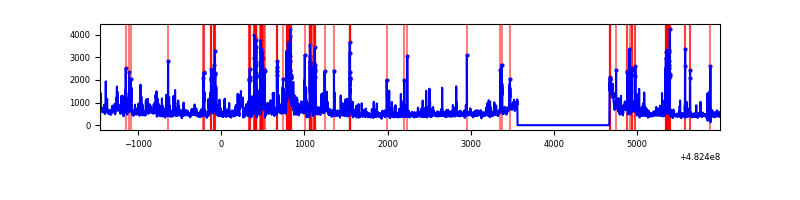 |
| D | 7450 | 6346 | 74 | 74 | 0.99% | 1.17% | 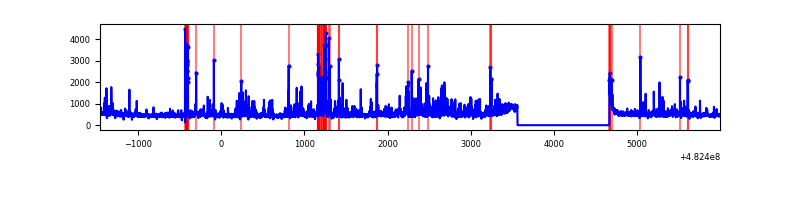 |
Top three noisy pixels from each quadrant. If the there are fewer than three noisy pixels in the level2.evt file, extra rows are filled as -1
| Pixel properties | Quadrant properties | ||||||
|---|---|---|---|---|---|---|---|
| Quadrant | DetID | PixID | Counts | Sigma | Mean | Median | Sigma |
| A | 12 | 250 | 709928 | 3967.16 | 726 | 707 | 178.8 |
| A | 13 | 248 | 64123 | 354.73 | 726 | 707 | 178.8 |
| A | 3 | 79 | 39487 | 216.92 | 726 | 707 | 178.8 |
| B | 10 | 44 | 609065 | 4025.91 | 713 | 689 | 151.1 |
| B | 10 | 41 | 150042 | 988.34 | 713 | 689 | 151.1 |
| B | 10 | 254 | 115661 | 760.82 | 713 | 689 | 151.1 |
| C | 3 | 242 | 447552 | 2337.24 | 702 | 698 | 191.2 |
| C | 10 | 19 | 304936 | 1591.3 | 702 | 698 | 191.2 |
| C | 9 | 237 | 186580 | 972.24 | 702 | 698 | 191.2 |
| D | 8 | 176 | 359518 | 1821.18 | 708 | 683 | 197.0 |
| D | 6 | 222 | 121876 | 615.08 | 708 | 683 | 197.0 |
| D | 1 | 3 | 113211 | 571.11 | 708 | 683 | 197.0 |
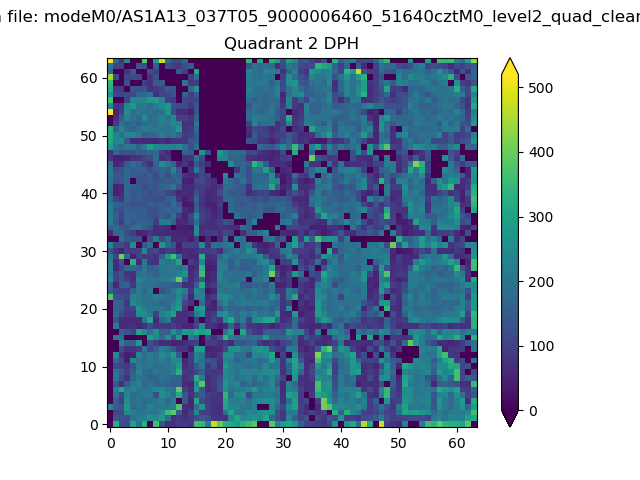
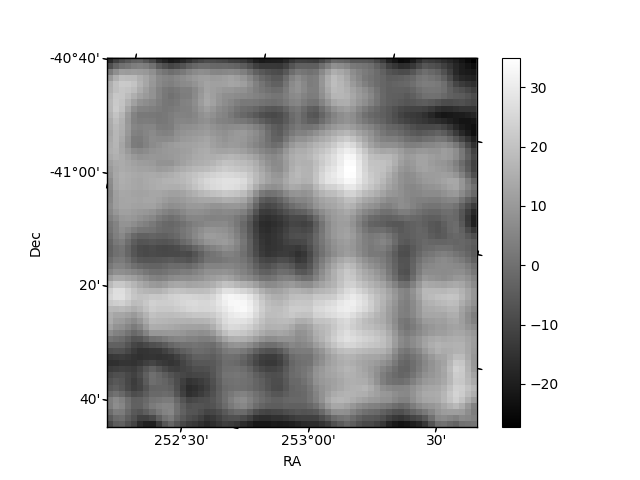
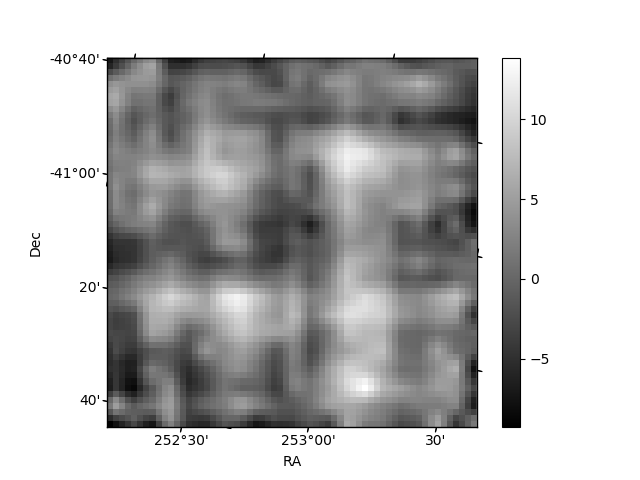
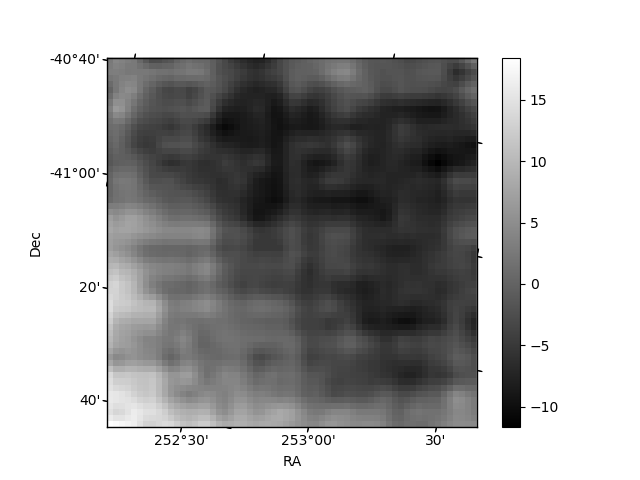
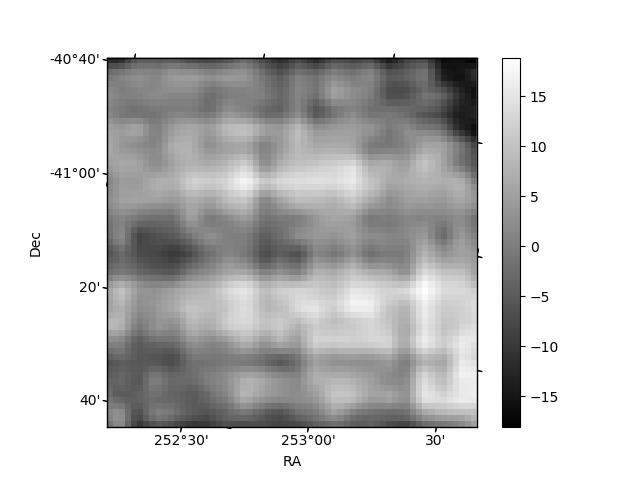
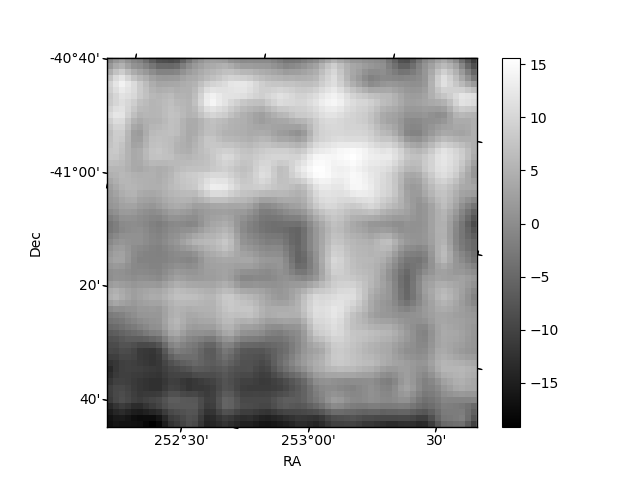
Histogram calculated using DETX and DETY for each event in the final _common_clean file
| Quadrant A | 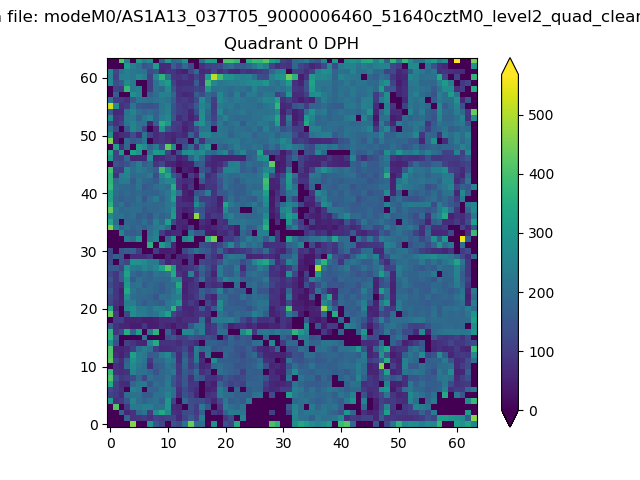 |
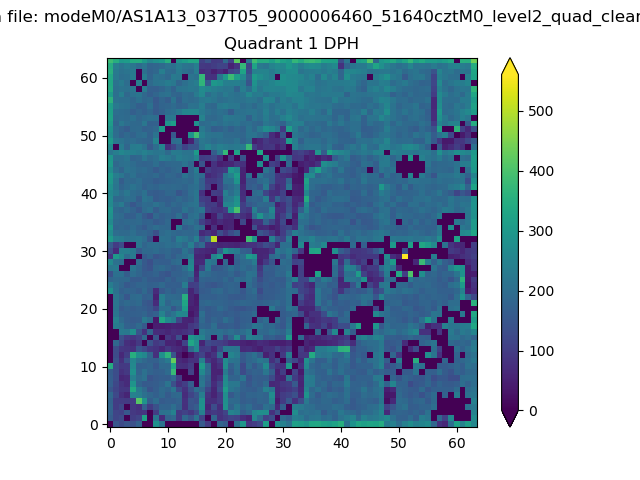 |
Quadrant B |
|---|---|---|---|
| Quadrant D | 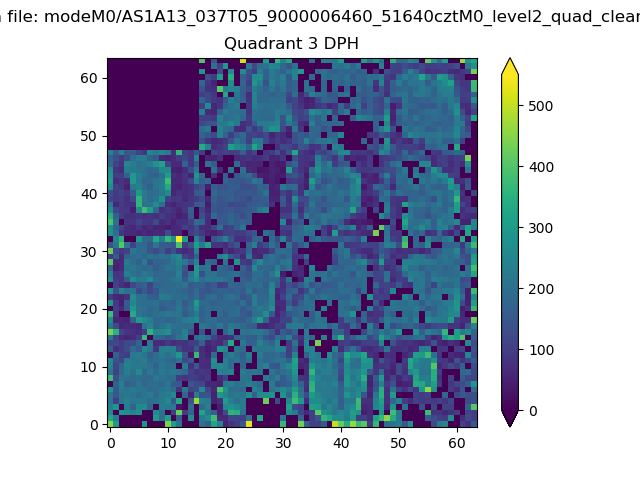 |
 |
Quadrant C |
| Plot type | Count rate plots | Images |
|---|---|---|
| Comparison with Poisson distribution Blue bars denote a histogram of data divided into 1 sec bins. Red curve is a Poisson curve with rate = median count rate of data. |
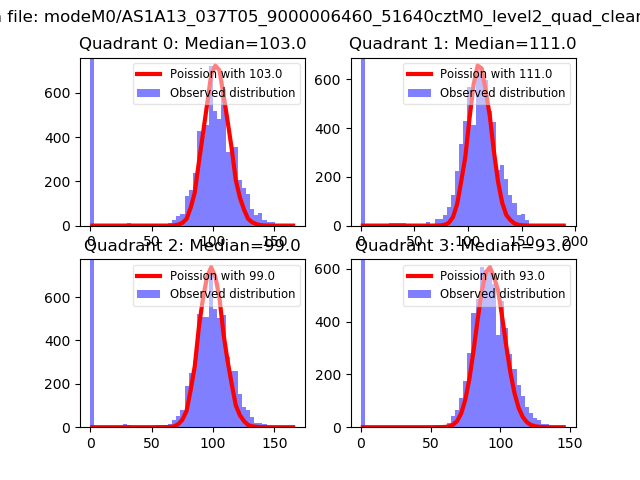 |
 |
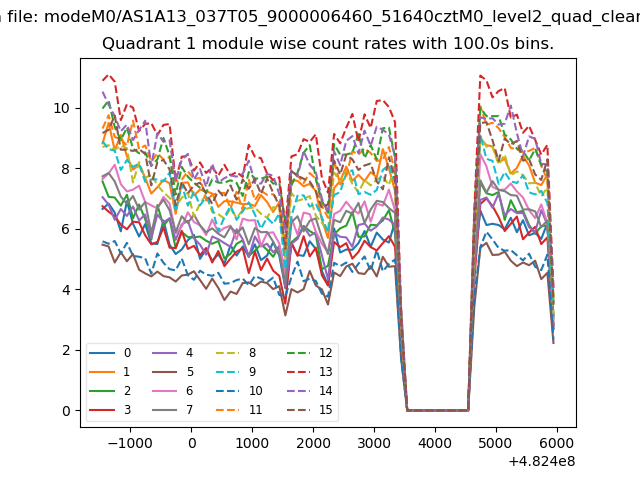
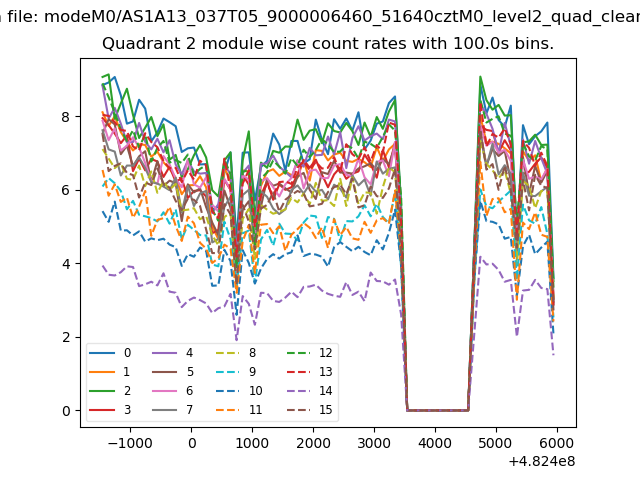
| Quadrant-wise count rates Data is divided into 100 sec bins |
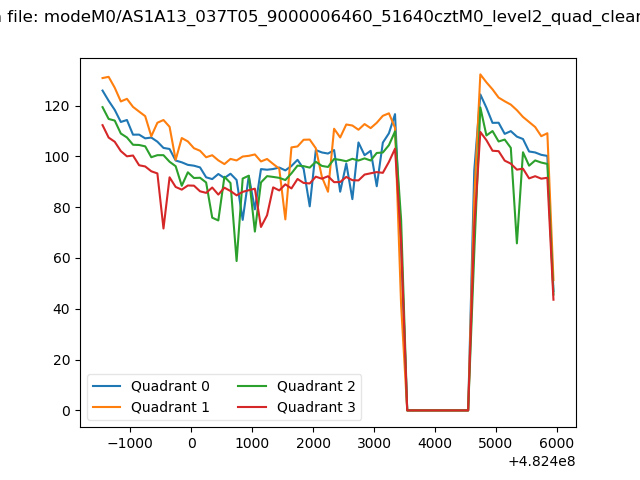 |
|
| Module-wise count rates for Quadrant A Data is divided into 100 sec bins |
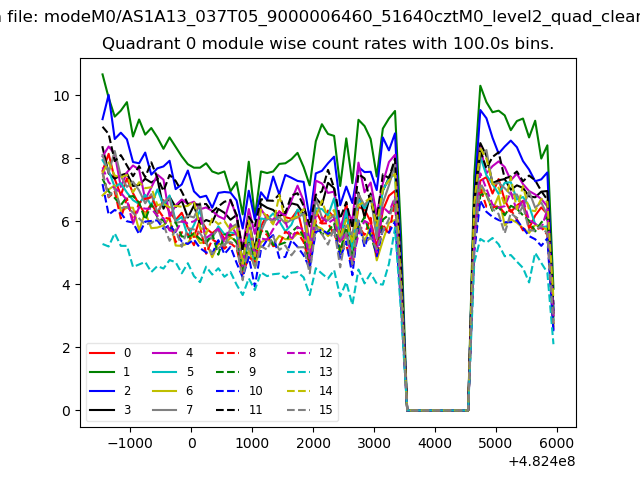 |
 |
| Module-wise count rates for Quadrant B Data is divided into 100 sec bins |
 |
 |
| Module-wise count rates for Quadrant C Data is divided into 100 sec bins |
 |
 |
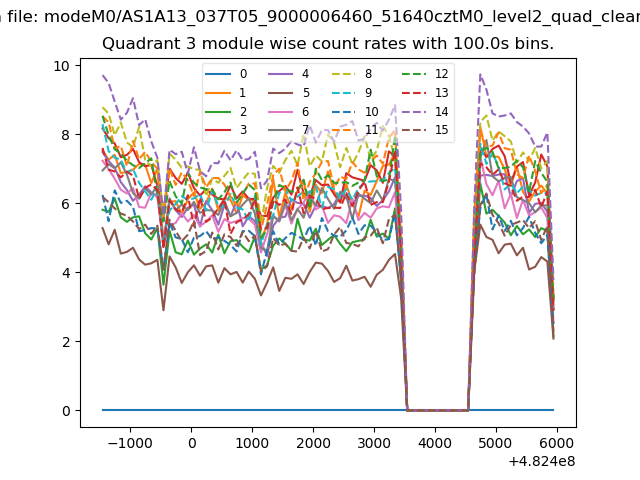
| Module-wise count rates for Quadrant D Data is divided into 100 sec bins |
 |
 |
| Parameter | Plot |
|---|---|
| CZT HV Monitor | 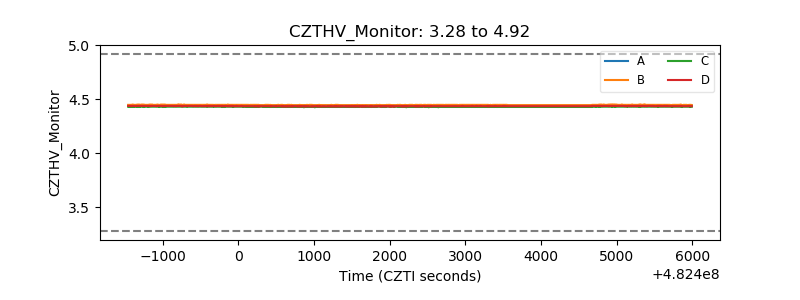 |
| D_VDD | 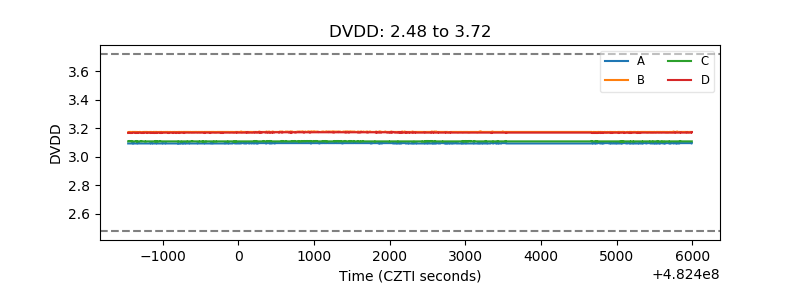 |
| Temperature 1 | 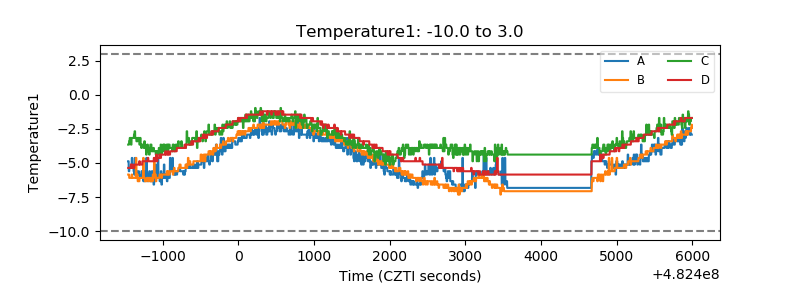 |
| Veto HV Monitor | 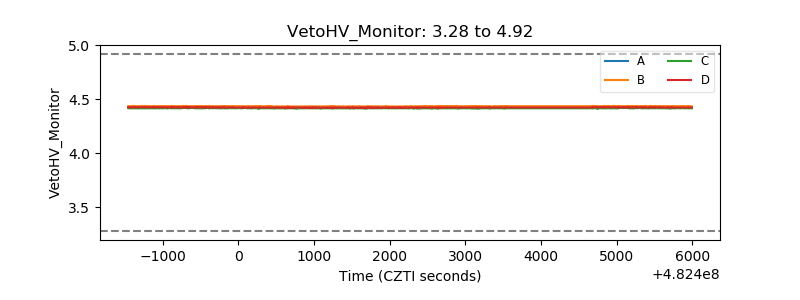 |
| Veto LLD | 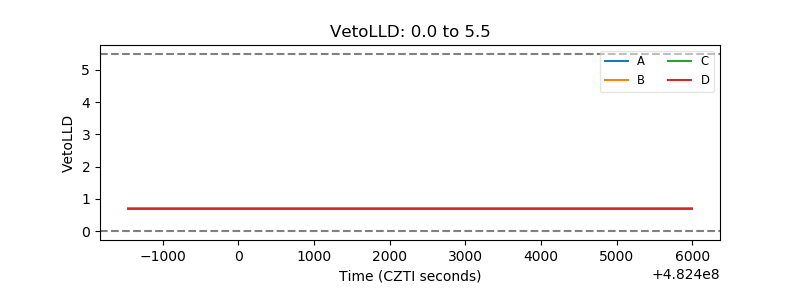 |
| Alpha Counter |  |
| _CPM_Rate | 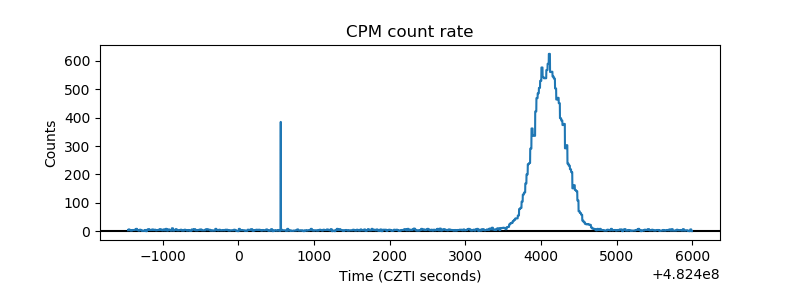 |
| CZT Counter | 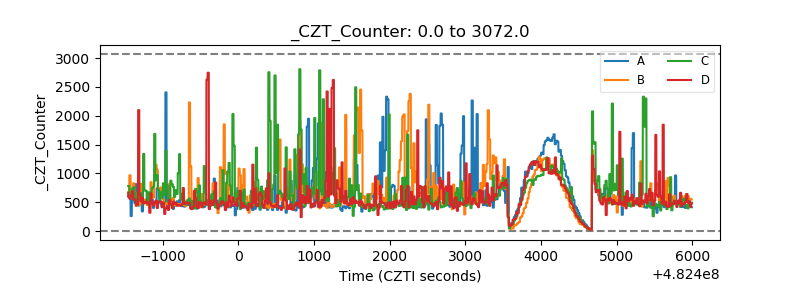 |
| +2.5 Volts monitor | 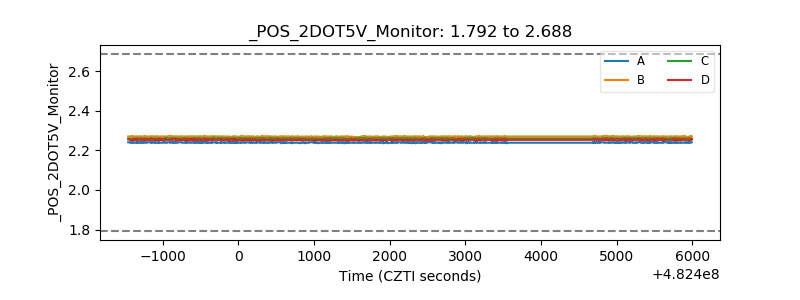 |
| +5 Volts monitor |  |
| _ROLL_ROT | 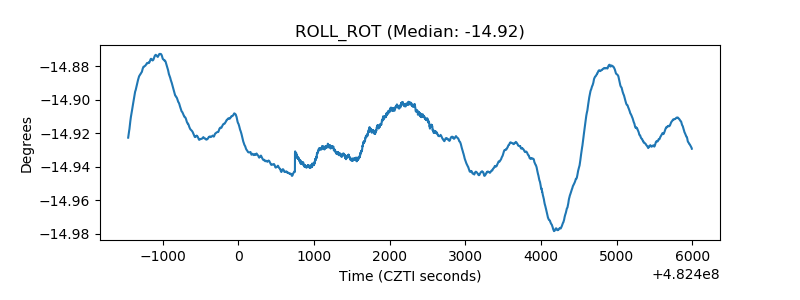 |
| _Roll_DEC | 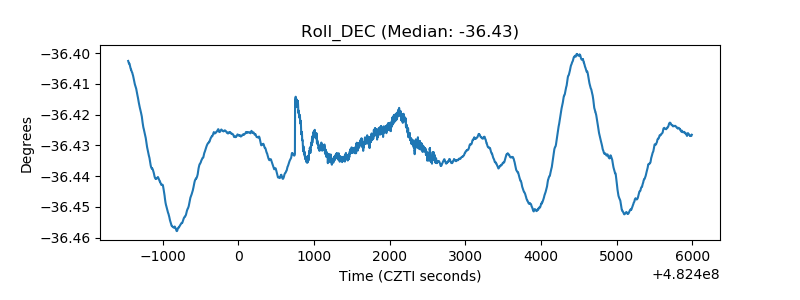 |
| _Roll_RA | 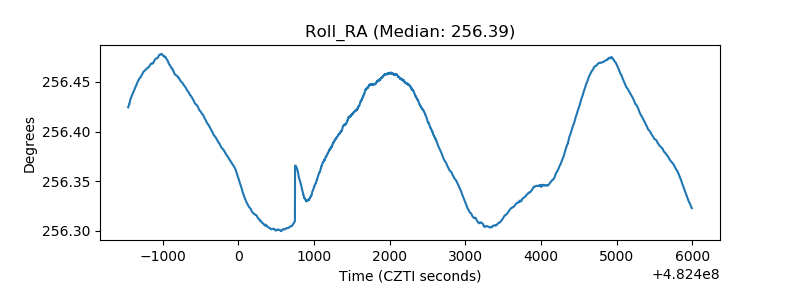 |
| Veto Counter | 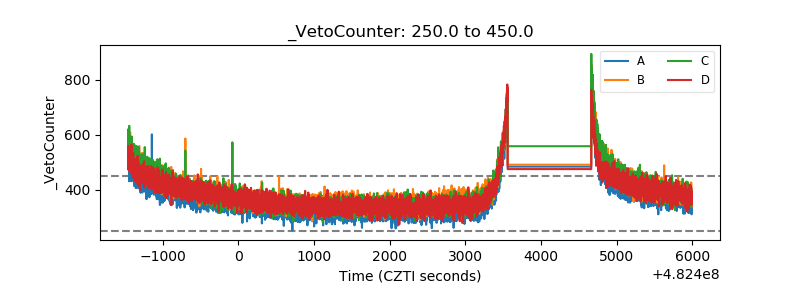 |