| Param | Original file | Final file |
|---|---|---|
| Filename | modeM0/AS1A13_037T05_9000006460_51641cztM0_level2.fits | modeM0/AS1A13_037T05_9000006460_51641cztM0_level2_quad_clean.evt |
| Size (bytes) | 481,501,440 | 103,294,080 |
| Size | 459.2 MB | 98.5 MB |
| Events in quadrant A | 4,152,771 | 675,038 |
| Events in quadrant B | 4,091,588 | 726,185 |
| Events in quadrant C | 4,672,820 | 639,785 |
| Events in quadrant D | 4,375,664 | 610,780 |
| Mode M9 | |||
|---|---|---|---|
| Quadrant | BADHDUFLAG | Total packets | Discarded packets |
| A | 0 | 11 | 0 |
| B | 0 | 11 | 0 |
| C | 0 | 11 | 0 |
| D | 0 | 11 | 0 |
| Mode M0 | |||
|---|---|---|---|
| Quadrant | BADHDUFLAG | Total packets | Discarded packets |
| A | 0 | 16981 | 2 |
| B | 0 | 16594 | 2 |
| C | 0 | 18496 | 2 |
| D | 0 | 17487 | 2 |
| Mode SS | |||
|---|---|---|---|
| Quadrant | BADHDUFLAG | Total packets | Discarded packets |
| A | 0 | 138 | 0 |
| B | 0 | 138 | 0 |
| C | 0 | 138 | 0 |
| D | 0 | 138 | 0 |
| Quadrant | Total seconds | Saturated seconds | Saturation percentage |
|---|---|---|---|
| A | 6834 | 234 | 3.424056% |
| B | 6835 | 279 | 4.081931% |
| C | 6835 | 380 | 5.559620% |
| D | 6835 | 221 | 3.233358% |
Noise dominated data is calculated using 1-second bins in cleaned event files. If a bin has >2000 counts, and if more than 50% of those come from <1% of pixels, then it is considered to be noise-dominated and hence unusable.
| Quadrant | # 1 sec bins | Bins with >0 counts | Bins with >2000 counts | High rate bins dominated by noise | Noise dominated (total time) | Noise dominated (detector-on time) | Marked lightcurve |
|---|---|---|---|---|---|---|---|
| A | 7914 | 6835 | 71 | 71 | 0.90% | 1.04% | 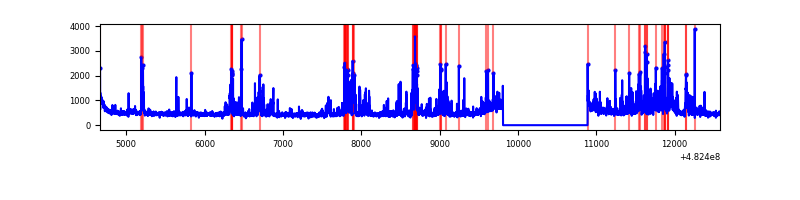 |
| B | 7915 | 6836 | 74 | 74 | 0.93% | 1.08% | 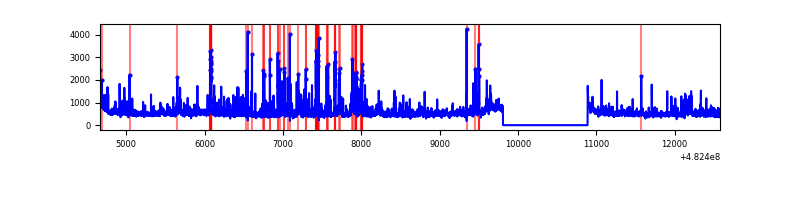 |
| C | 7915 | 6836 | 214 | 214 | 2.70% | 3.13% | 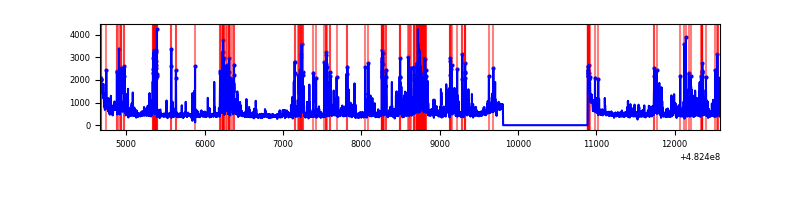 |
| D | 7915 | 6836 | 116 | 116 | 1.47% | 1.70% | 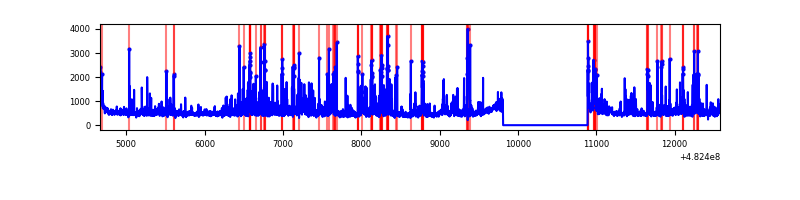 |
Top three noisy pixels from each quadrant. If the there are fewer than three noisy pixels in the level2.evt file, extra rows are filled as -1
| Pixel properties | Quadrant properties | ||||||
|---|---|---|---|---|---|---|---|
| Quadrant | DetID | PixID | Counts | Sigma | Mean | Median | Sigma |
| A | 12 | 250 | 412224 | 2141.95 | 785 | 766 | 192.1 |
| A | 3 | 14 | 199383 | 1033.95 | 785 | 766 | 192.1 |
| A | 12 | 80 | 86481 | 446.21 | 785 | 766 | 192.1 |
| B | 1 | 223 | 175312 | 1065.3 | 769 | 742 | 163.9 |
| B | 4 | 170 | 106349 | 644.46 | 769 | 742 | 163.9 |
| B | 7 | 252 | 103429 | 626.64 | 769 | 742 | 163.9 |
| C | 15 | 189 | 646556 | 3134.09 | 754 | 751 | 206.1 |
| C | 10 | 19 | 305432 | 1478.62 | 754 | 751 | 206.1 |
| C | 12 | 254 | 192717 | 931.61 | 754 | 751 | 206.1 |
| D | 8 | 176 | 432635 | 2051.87 | 760 | 734 | 210.5 |
| D | 2 | 249 | 311613 | 1476.92 | 760 | 734 | 210.5 |
| D | 6 | 222 | 176056 | 832.92 | 760 | 734 | 210.5 |
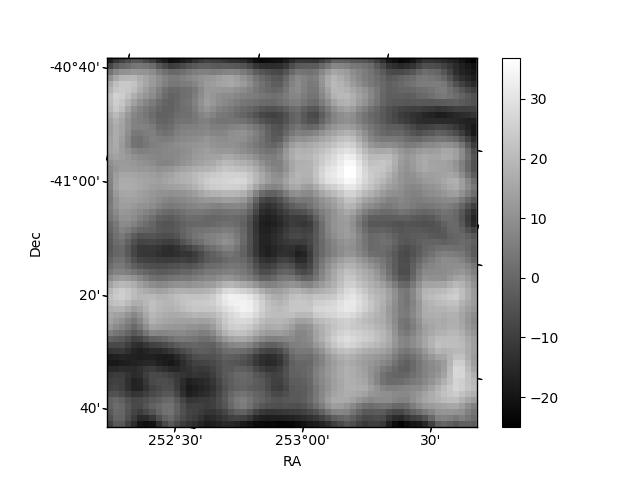
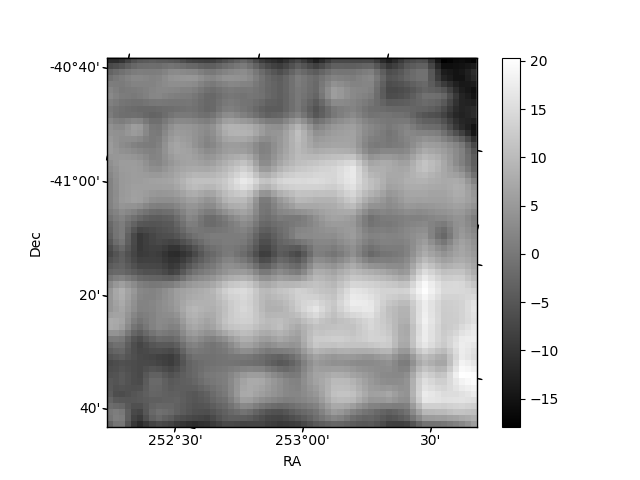
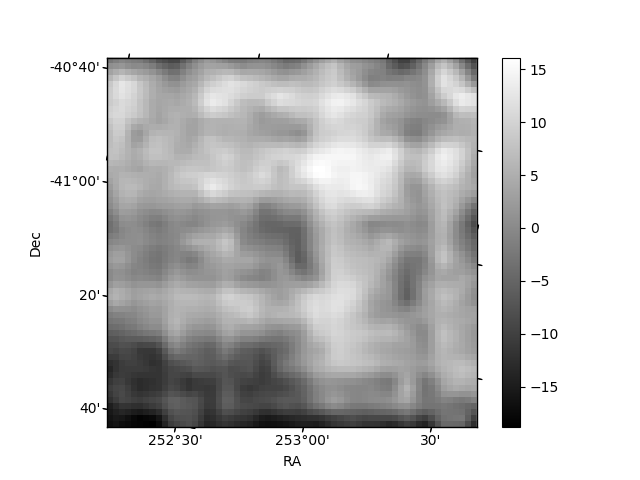
Histogram calculated using DETX and DETY for each event in the final _common_clean file
| Quadrant A | 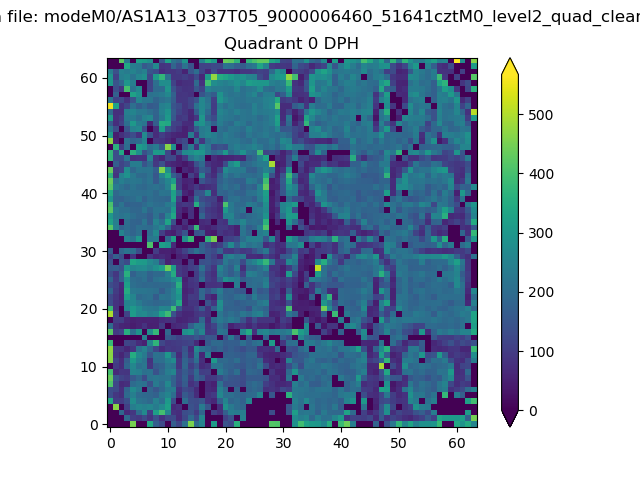 |
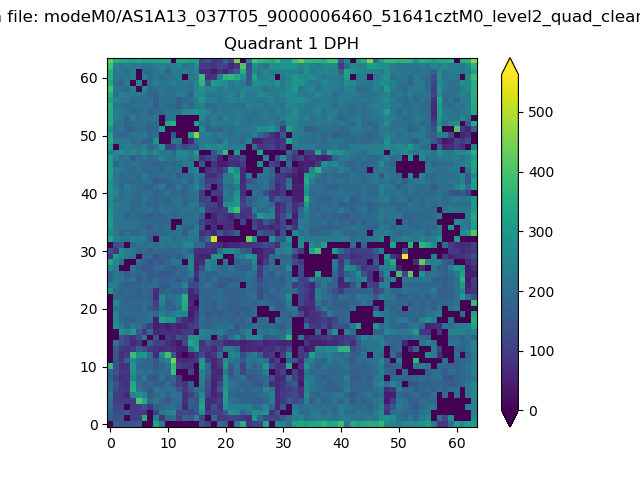 |
Quadrant B |
|---|---|---|---|
| Quadrant D | 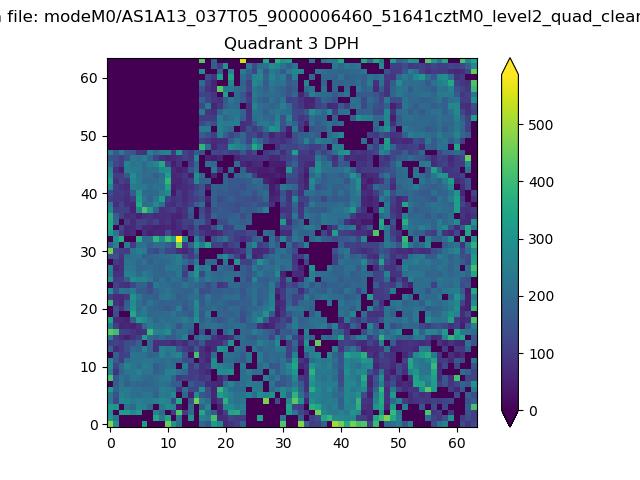 |
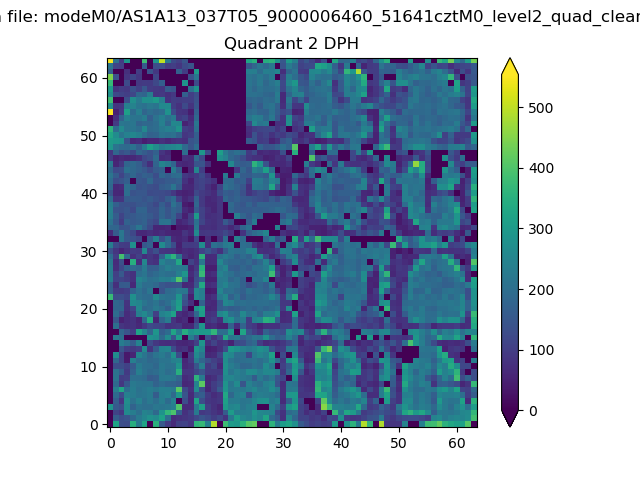 |
Quadrant C |
| Plot type | Count rate plots | Images |
|---|---|---|
| Comparison with Poisson distribution Blue bars denote a histogram of data divided into 1 sec bins. Red curve is a Poisson curve with rate = median count rate of data. |
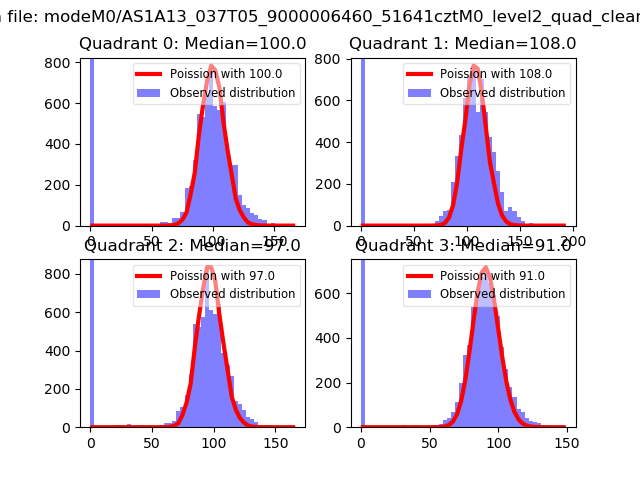 |
 |
| Quadrant-wise count rates Data is divided into 100 sec bins |
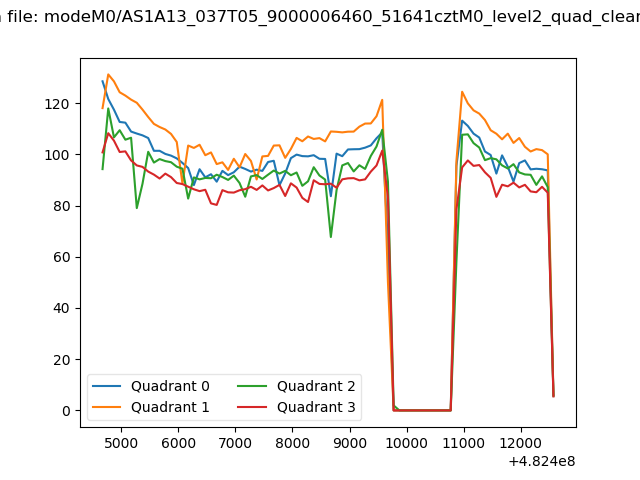 |
|
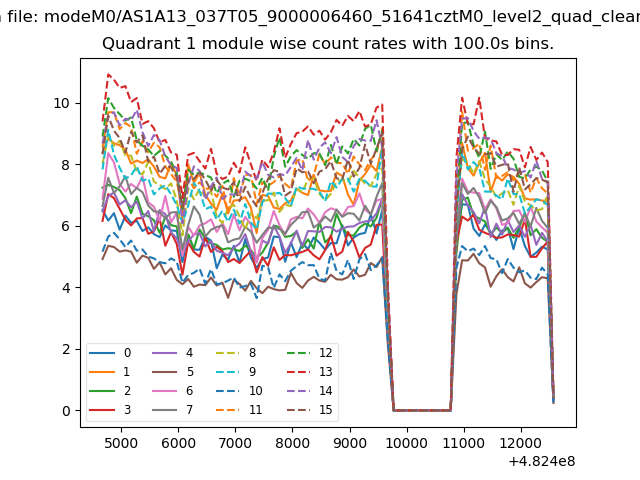
| Module-wise count rates for Quadrant A Data is divided into 100 sec bins |
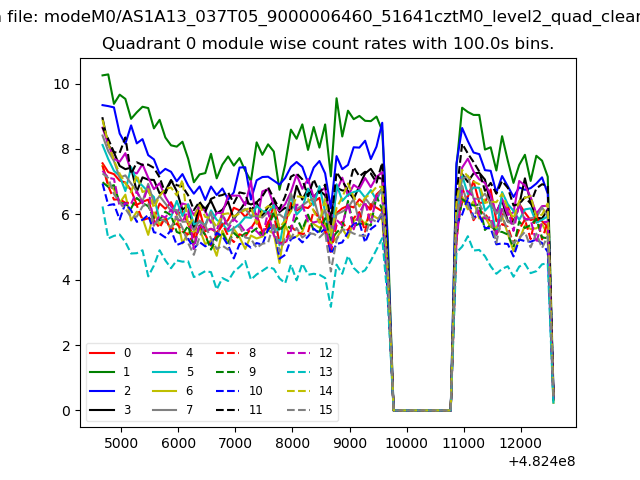 |
 |
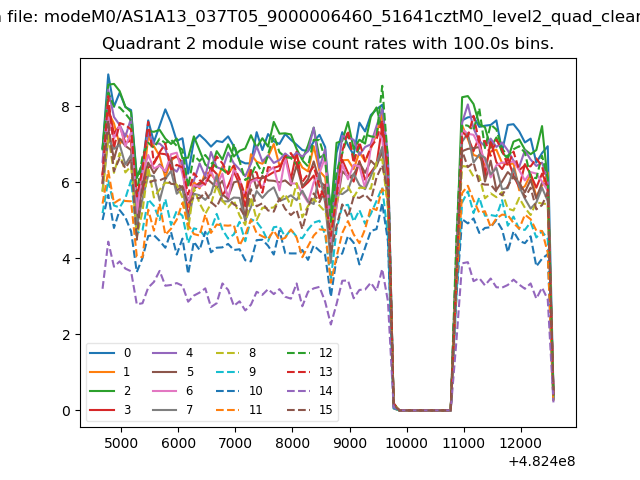
| Module-wise count rates for Quadrant B Data is divided into 100 sec bins |
 |
 |
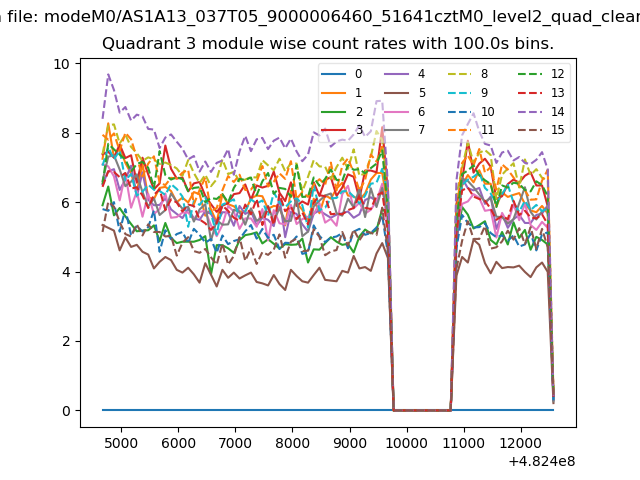
| Module-wise count rates for Quadrant C Data is divided into 100 sec bins |
 |
 |
| Module-wise count rates for Quadrant D Data is divided into 100 sec bins |
 |
 |
| Parameter | Plot |
|---|---|
| CZT HV Monitor |  |
| D_VDD | 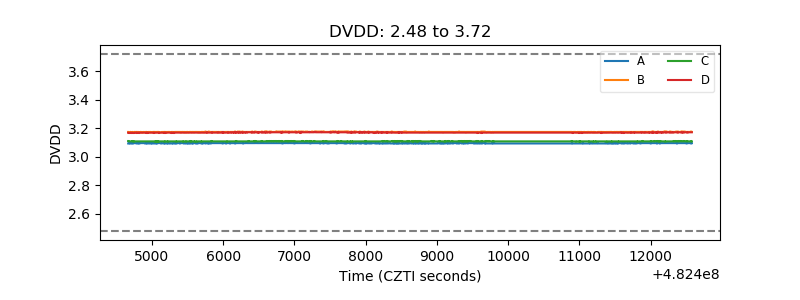 |
| Temperature 1 | 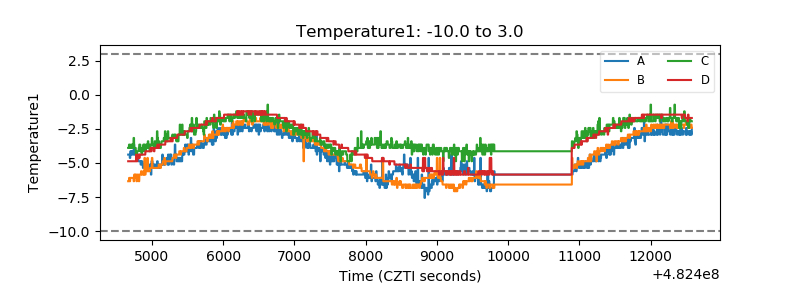 |
| Veto HV Monitor | 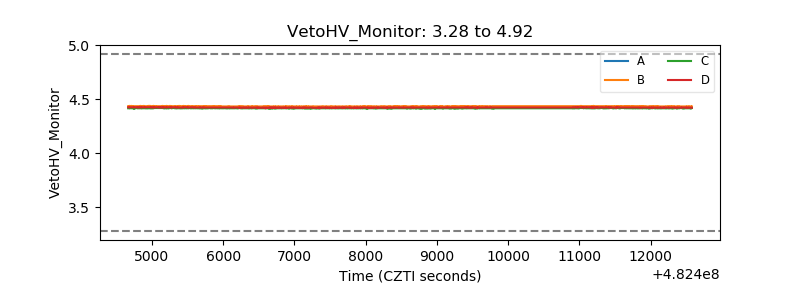 |
| Veto LLD | 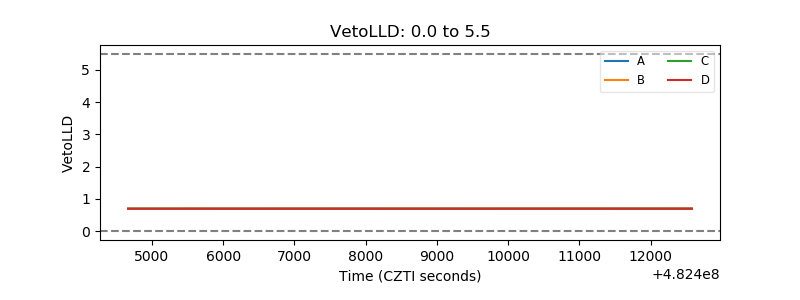 |
| Alpha Counter | 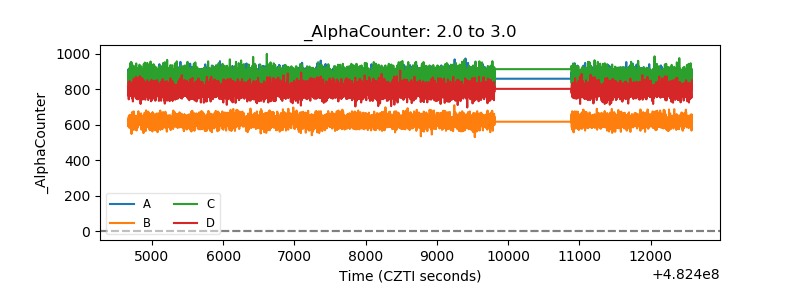 |
| _CPM_Rate | 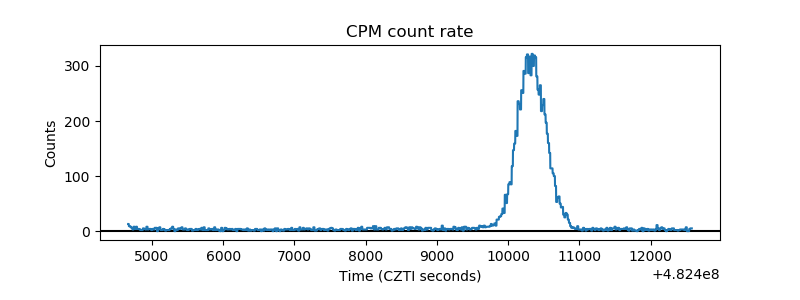 |
| CZT Counter | 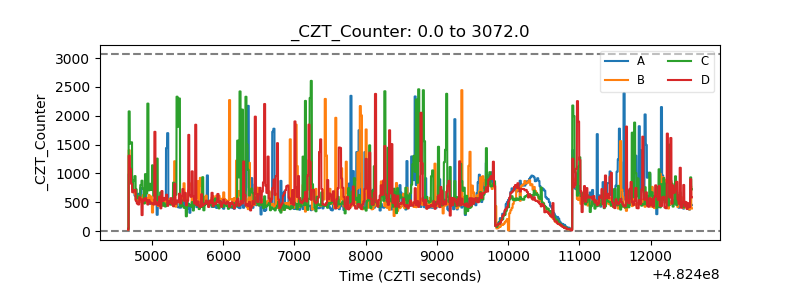 |
| +2.5 Volts monitor | 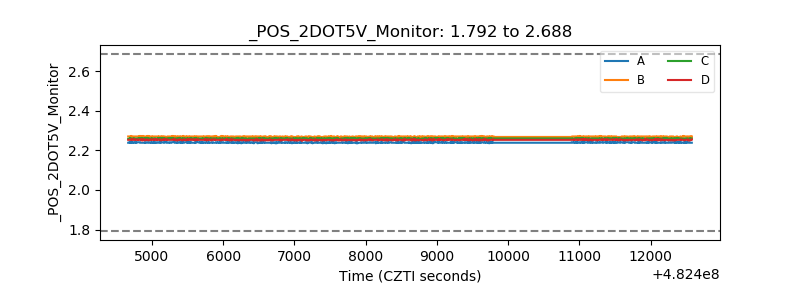 |
| +5 Volts monitor | 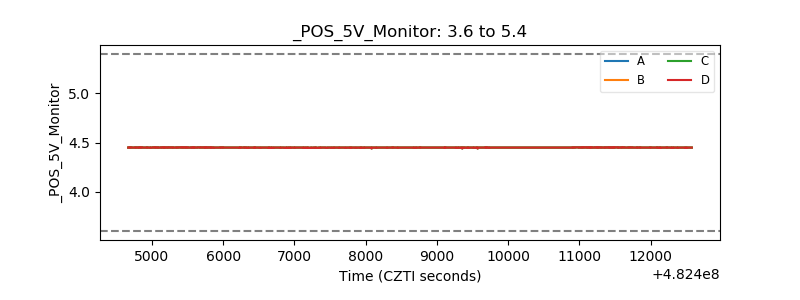 |
| _ROLL_ROT | 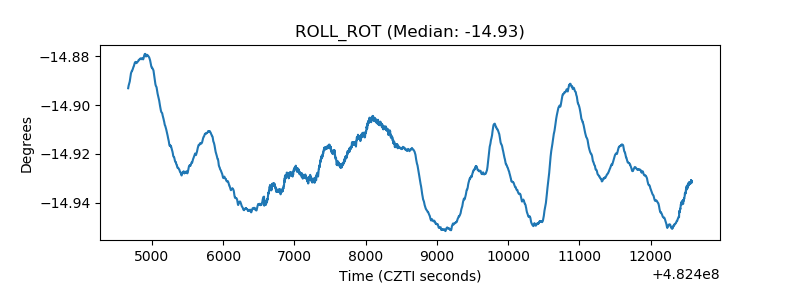 |
| _Roll_DEC | 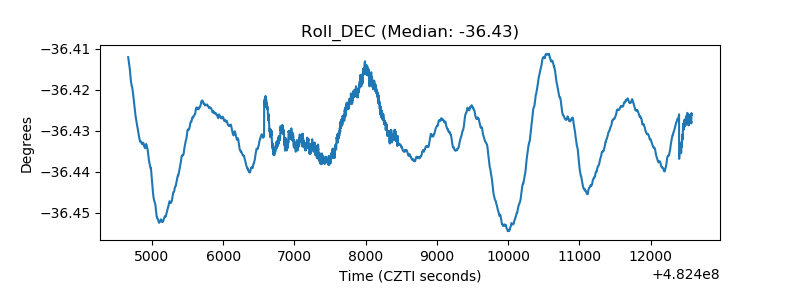 |
| _Roll_RA | 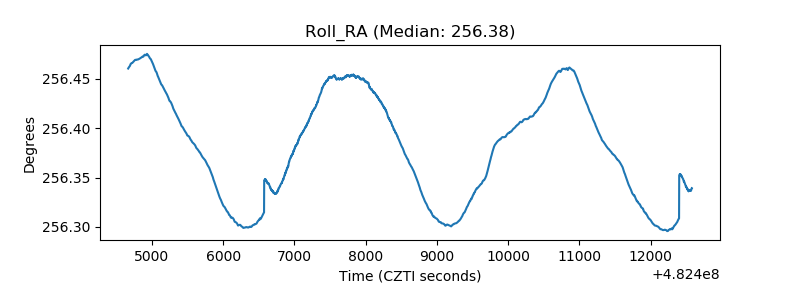 |
| Veto Counter | 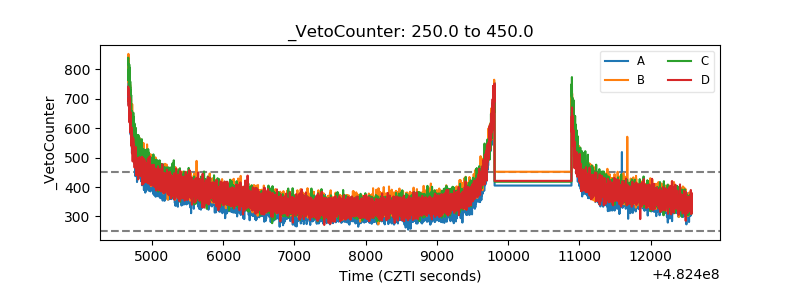 |