| Param | Original file | Final file |
|---|---|---|
| Filename | modeM0/AS1A13_037T05_9000006460_51643cztM0_level2.fits | modeM0/AS1A13_037T05_9000006460_51643cztM0_level2_quad_clean.evt |
| Size (bytes) | 542,992,320 | 103,314,240 |
| Size | 517.8 MB | 98.5 MB |
| Events in quadrant A | 5,146,882 | 660,751 |
| Events in quadrant B | 4,991,289 | 715,505 |
| Events in quadrant C | 5,153,821 | 637,704 |
| Events in quadrant D | 4,247,895 | 611,916 |
| Mode M9 | |||
|---|---|---|---|
| Quadrant | BADHDUFLAG | Total packets | Discarded packets |
| A | 0 | 6 | 0 |
| B | 0 | 6 | 0 |
| C | 0 | 6 | 0 |
| D | 0 | 6 | 0 |
| Mode M0 | |||
|---|---|---|---|
| Quadrant | BADHDUFLAG | Total packets | Discarded packets |
| A | 0 | 20260 | 1 |
| B | 0 | 19690 | 1 |
| C | 0 | 20331 | 1 |
| D | 0 | 17617 | 1 |
| Mode SS | |||
|---|---|---|---|
| Quadrant | BADHDUFLAG | Total packets | Discarded packets |
| A | 0 | 146 | 0 |
| B | 0 | 146 | 0 |
| C | 0 | 146 | 0 |
| D | 0 | 146 | 0 |
| Quadrant | Total seconds | Saturated seconds | Saturation percentage |
|---|---|---|---|
| A | 7213 | 336 | 4.658256% |
| B | 7214 | 373 | 5.170502% |
| C | 7214 | 458 | 6.348766% |
| D | 7214 | 195 | 2.703077% |
Noise dominated data is calculated using 1-second bins in cleaned event files. If a bin has >2000 counts, and if more than 50% of those come from <1% of pixels, then it is considered to be noise-dominated and hence unusable.
| Quadrant | # 1 sec bins | Bins with >0 counts | Bins with >2000 counts | High rate bins dominated by noise | Noise dominated (total time) | Noise dominated (detector-on time) | Marked lightcurve |
|---|---|---|---|---|---|---|---|
| A | 7813 | 7214 | 153 | 153 | 1.96% | 2.12% | 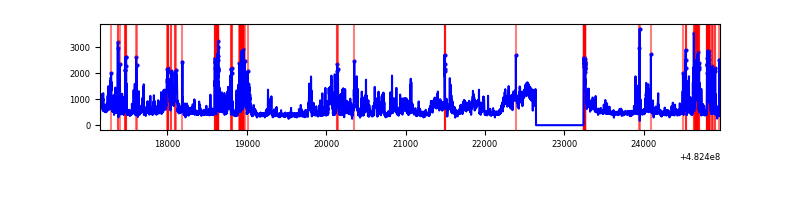 |
| B | 7814 | 7215 | 147 | 147 | 1.88% | 2.04% | 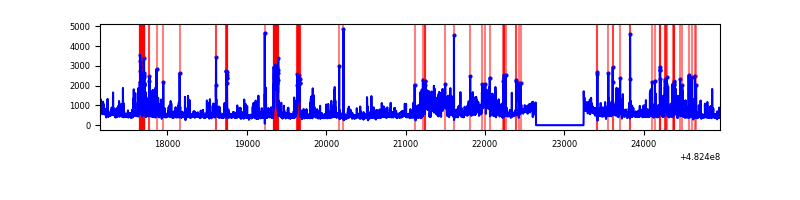 |
| C | 7814 | 7215 | 320 | 320 | 4.10% | 4.44% | 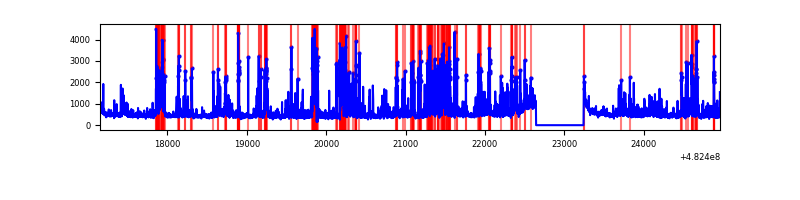 |
| D | 7814 | 7215 | 117 | 117 | 1.50% | 1.62% | 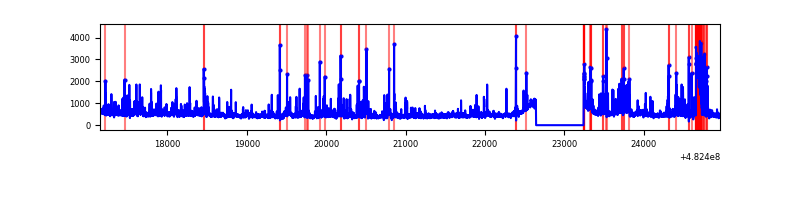 |
Top three noisy pixels from each quadrant. If the there are fewer than three noisy pixels in the level2.evt file, extra rows are filled as -1
| Pixel properties | Quadrant properties | ||||||
|---|---|---|---|---|---|---|---|
| Quadrant | DetID | PixID | Counts | Sigma | Mean | Median | Sigma |
| A | 12 | 3 | 451813 | 2320.12 | 794 | 774 | 194.4 |
| A | 4 | 175 | 335307 | 1720.82 | 794 | 774 | 194.4 |
| A | 12 | 250 | 246183 | 1262.37 | 794 | 774 | 194.4 |
| B | 5 | 172 | 520174 | 3102.78 | 788 | 761 | 167.4 |
| B | 0 | 171 | 284909 | 1697.39 | 788 | 761 | 167.4 |
| B | 5 | 185 | 214386 | 1276.12 | 788 | 761 | 167.4 |
| C | 15 | 189 | 967088 | 4609.97 | 769 | 764 | 209.6 |
| C | 10 | 19 | 502702 | 2394.56 | 769 | 764 | 209.6 |
| C | 12 | 254 | 227245 | 1080.46 | 769 | 764 | 209.6 |
| D | 8 | 176 | 686317 | 3162.06 | 776 | 747 | 216.8 |
| D | 2 | 249 | 160335 | 736.07 | 776 | 747 | 216.8 |
| D | 1 | 3 | 115122 | 527.53 | 776 | 747 | 216.8 |
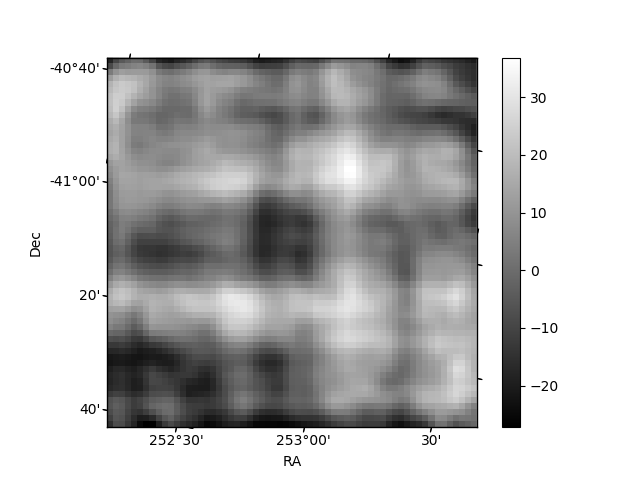
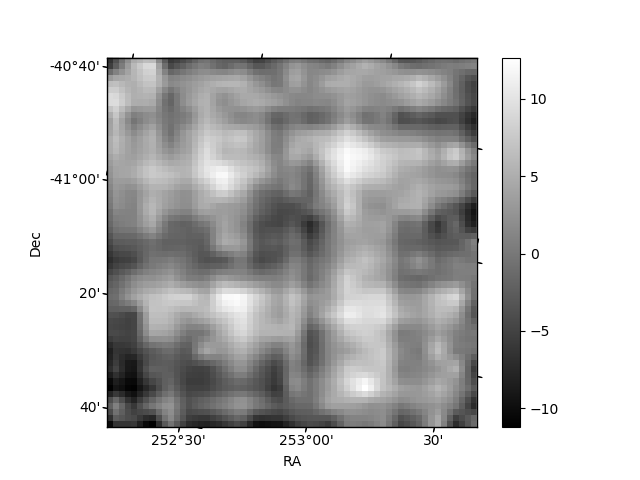
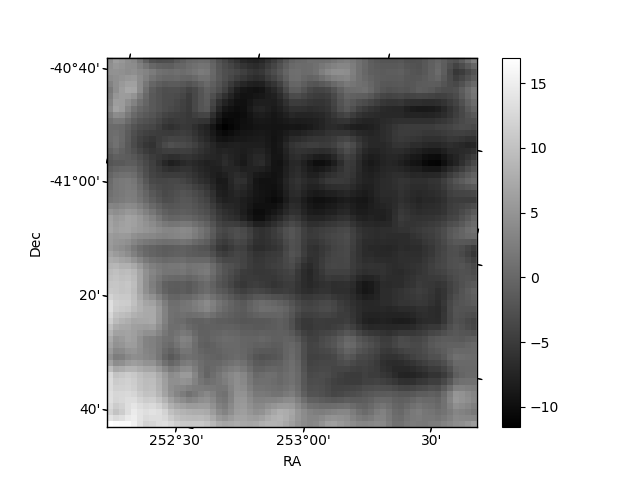
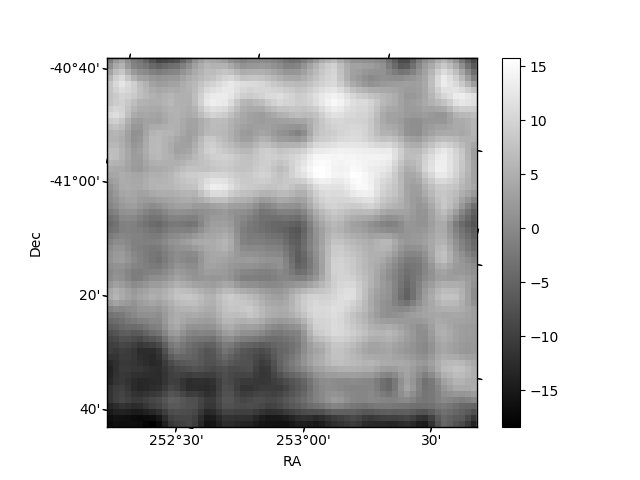
Histogram calculated using DETX and DETY for each event in the final _common_clean file
| Quadrant A | 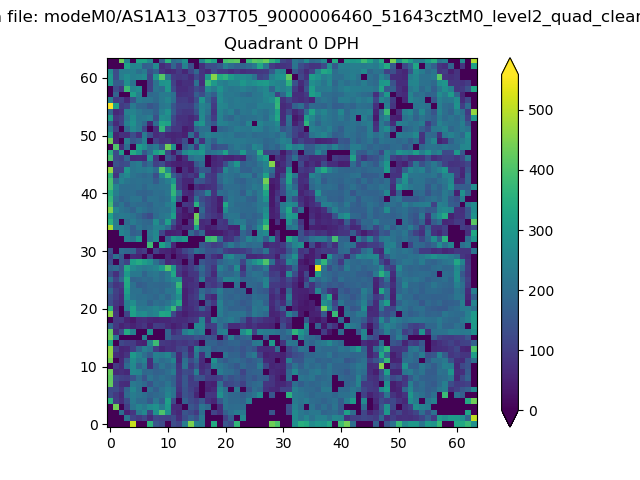 |
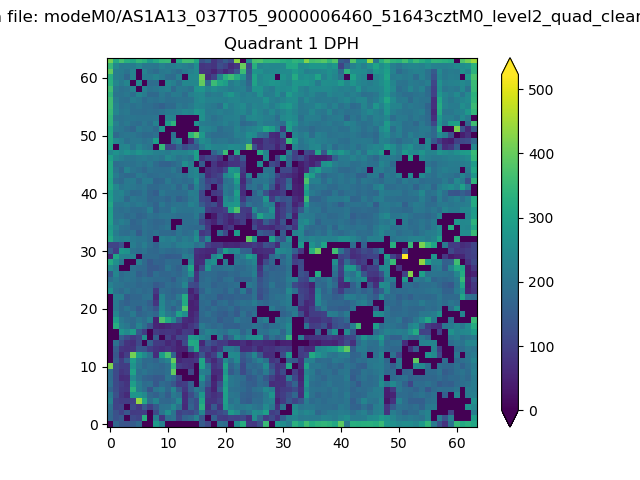 |
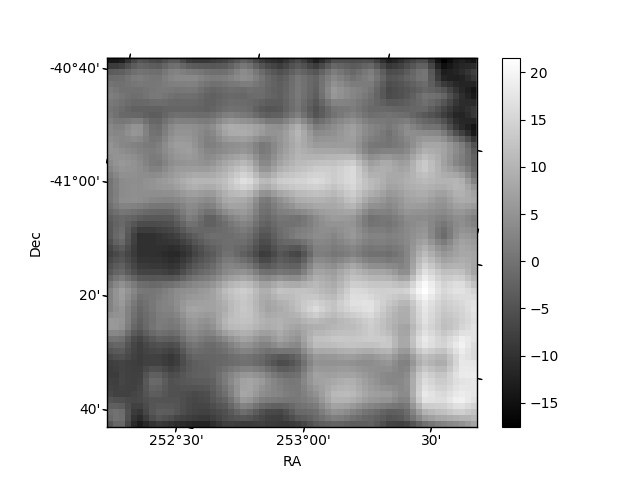
Quadrant B |
|---|---|---|---|
| Quadrant D | 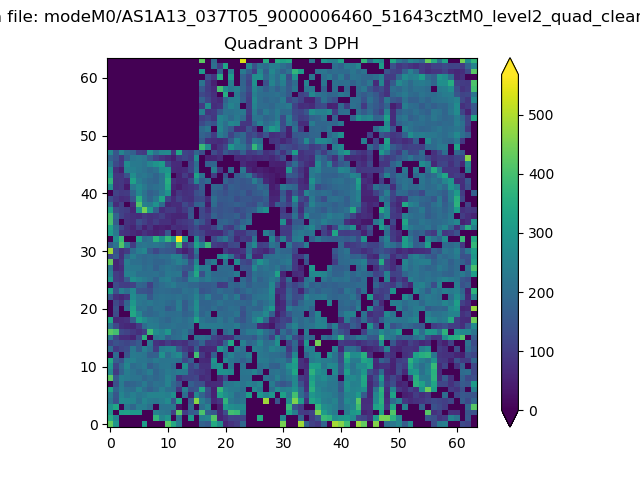 |
 |
Quadrant C |
| Plot type | Count rate plots | Images |
|---|---|---|
| Comparison with Poisson distribution Blue bars denote a histogram of data divided into 1 sec bins. Red curve is a Poisson curve with rate = median count rate of data. |
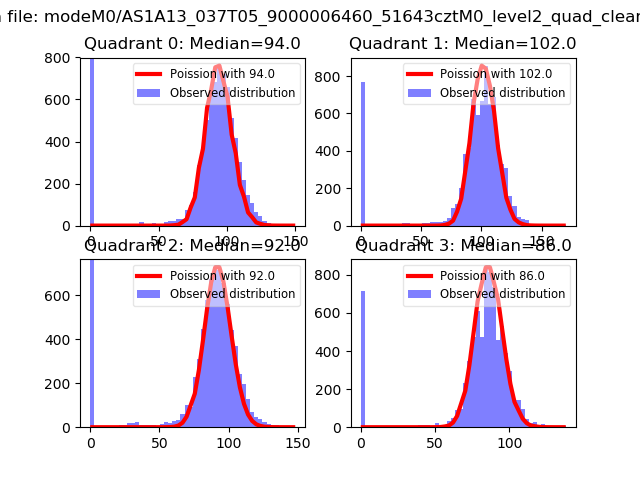 |
 |
| Quadrant-wise count rates Data is divided into 100 sec bins |
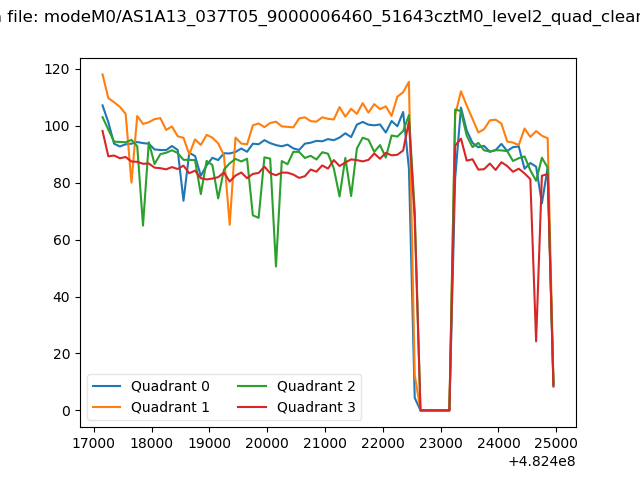 |
|
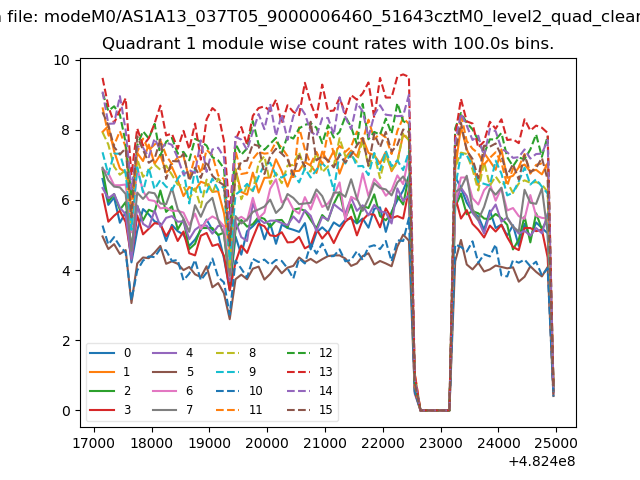
| Module-wise count rates for Quadrant A Data is divided into 100 sec bins |
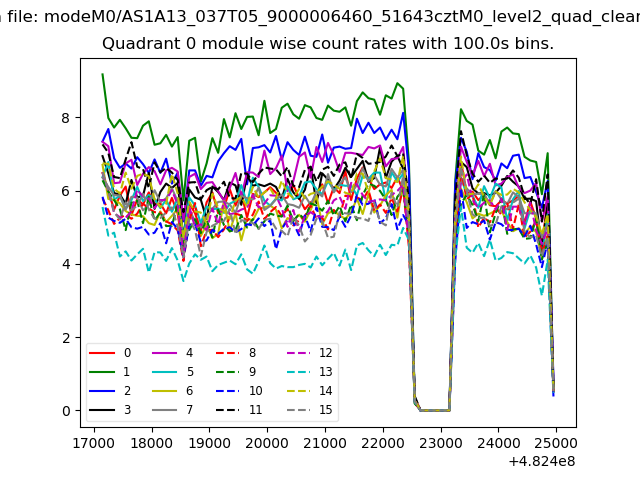 |
 |
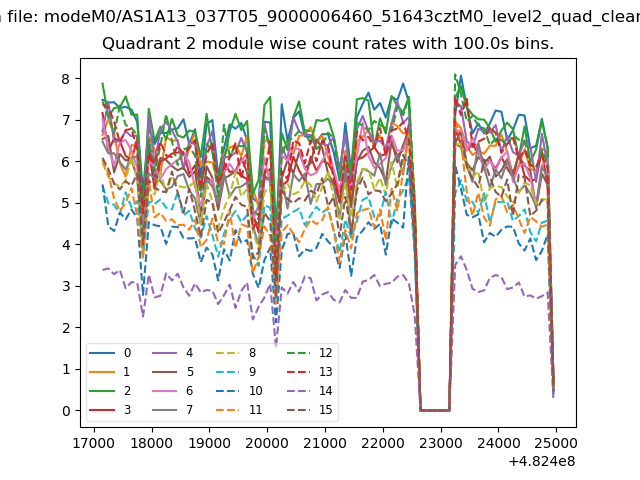
| Module-wise count rates for Quadrant B Data is divided into 100 sec bins |
 |
 |
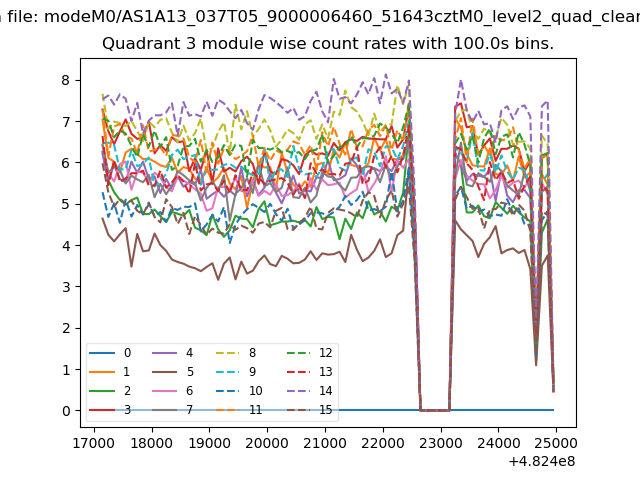
| Module-wise count rates for Quadrant C Data is divided into 100 sec bins |
 |
 |
| Module-wise count rates for Quadrant D Data is divided into 100 sec bins |
 |
 |
| Parameter | Plot |
|---|---|
| CZT HV Monitor | 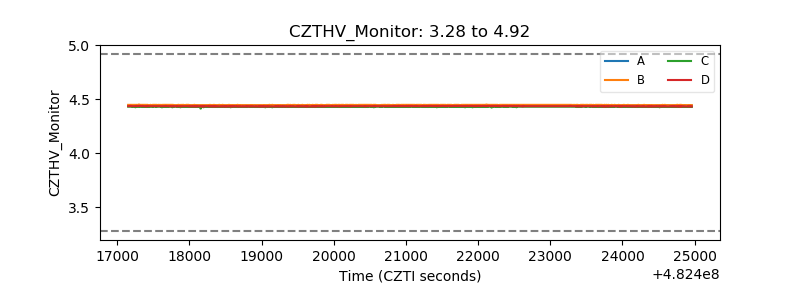 |
| D_VDD | 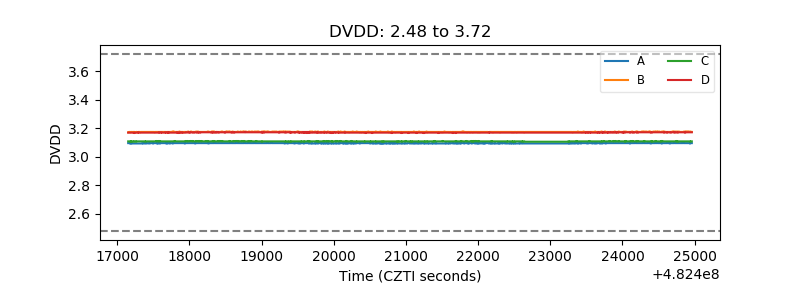 |
| Temperature 1 | 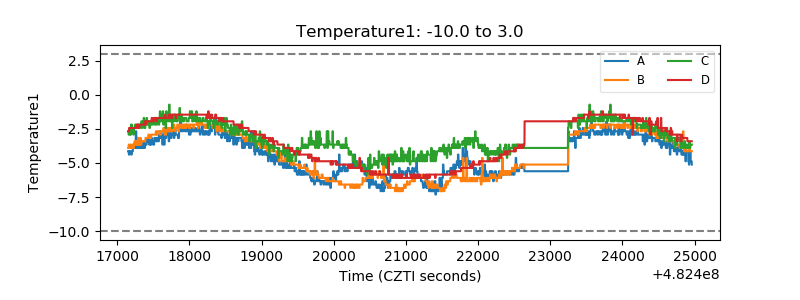 |
| Veto HV Monitor | 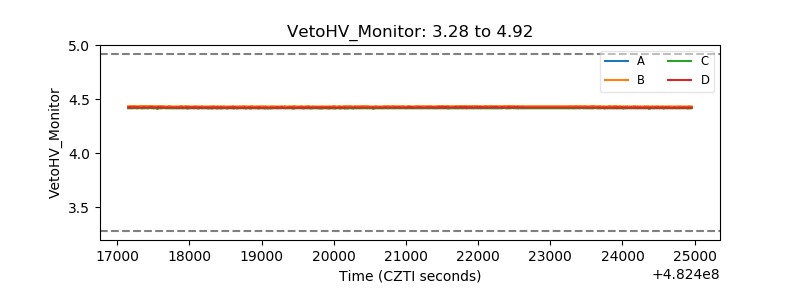 |
| Veto LLD | 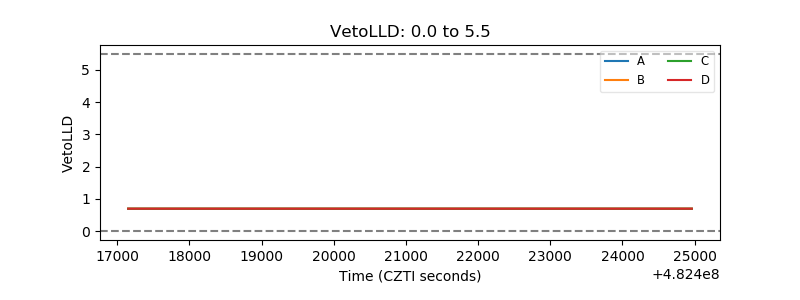 |
| Alpha Counter | 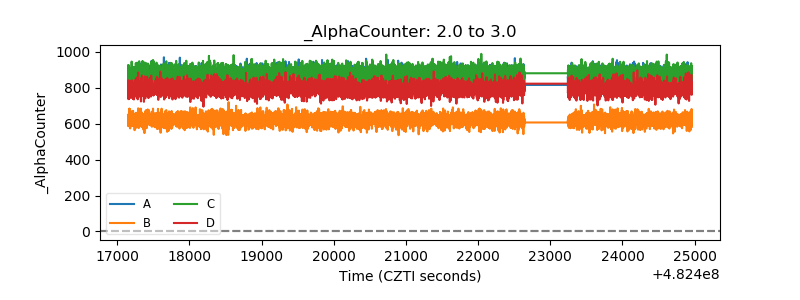 |
| _CPM_Rate | 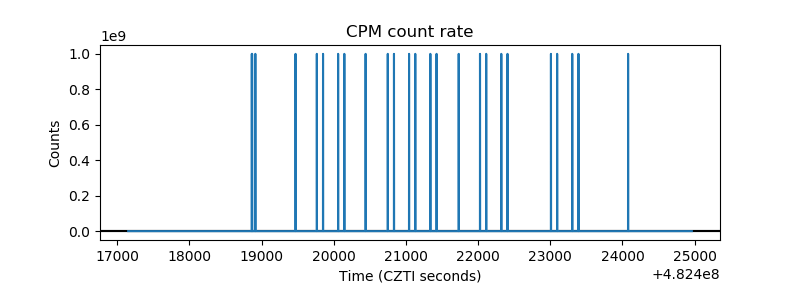 |
| CZT Counter | 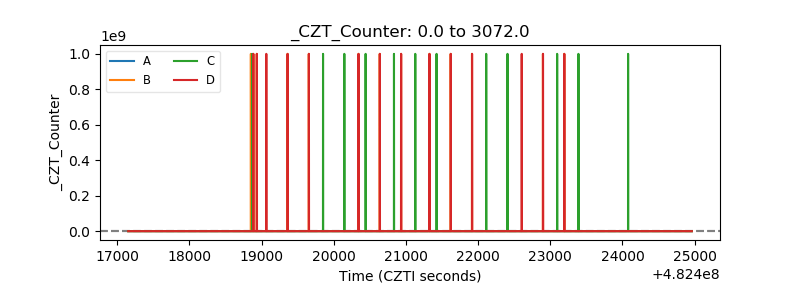 |
| +2.5 Volts monitor | 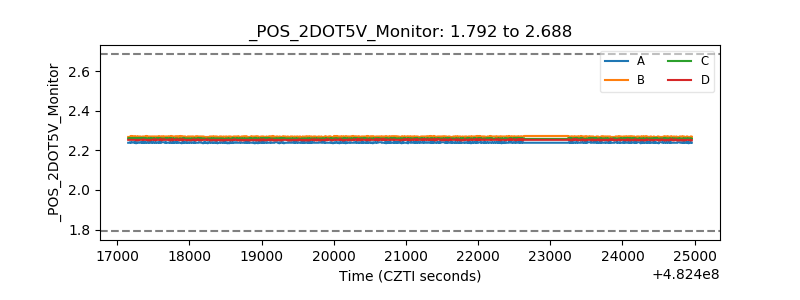 |
| +5 Volts monitor | 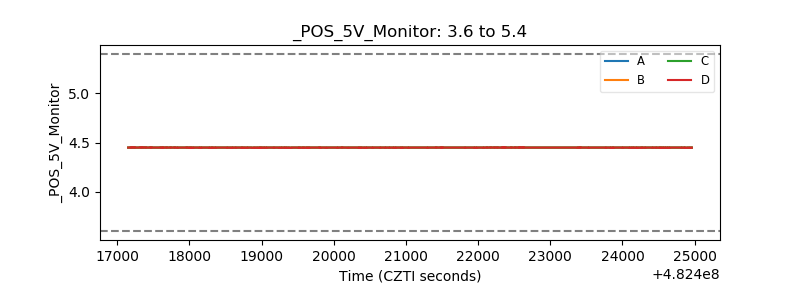 |
| _ROLL_ROT | 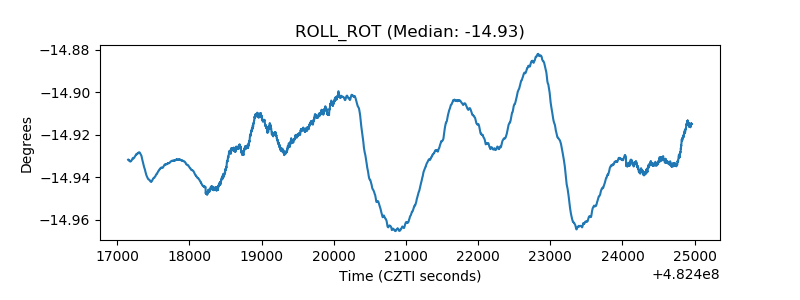 |
| _Roll_DEC | 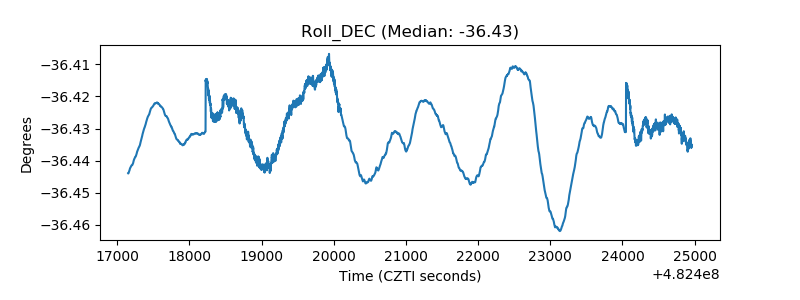 |
| _Roll_RA | 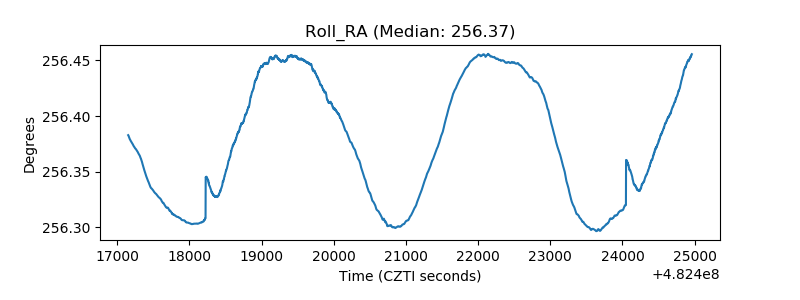 |
| Veto Counter | 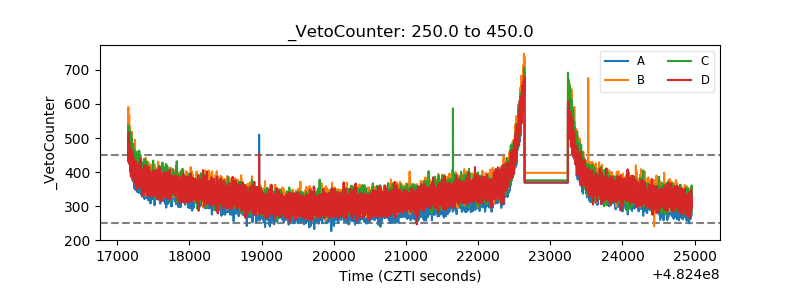 |