| Param | Original file | Final file |
|---|---|---|
| Filename | modeM0/AS1A13_037T05_9000006460_51644cztM0_level2.fits | modeM0/AS1A13_037T05_9000006460_51644cztM0_level2_quad_clean.evt |
| Size (bytes) | 555,062,400 | 108,838,080 |
| Size | 529.3 MB | 103.8 MB |
| Events in quadrant A | 5,260,426 | 693,928 |
| Events in quadrant B | 4,727,907 | 763,064 |
| Events in quadrant C | 5,311,147 | 679,264 |
| Events in quadrant D | 4,665,185 | 637,223 |
| Mode M0 | |||
|---|---|---|---|
| Quadrant | BADHDUFLAG | Total packets | Discarded packets |
| A | 0 | 21001 | 0 |
| B | 0 | 19214 | 0 |
| C | 0 | 20810 | 0 |
| D | 0 | 19206 | 0 |
| Mode SS | |||
|---|---|---|---|
| Quadrant | BADHDUFLAG | Total packets | Discarded packets |
| A | 0 | 150 | 0 |
| B | 0 | 150 | 0 |
| C | 0 | 150 | 0 |
| D | 0 | 150 | 0 |
| Quadrant | Total seconds | Saturated seconds | Saturation percentage |
|---|---|---|---|
| A | 7500 | 421 | 5.613333% |
| B | 7500 | 276 | 3.680000% |
| C | 7500 | 293 | 3.906667% |
| D | 7501 | 236 | 3.146247% |
Noise dominated data is calculated using 1-second bins in cleaned event files. If a bin has >2000 counts, and if more than 50% of those come from <1% of pixels, then it is considered to be noise-dominated and hence unusable.
| Quadrant | # 1 sec bins | Bins with >0 counts | Bins with >2000 counts | High rate bins dominated by noise | Noise dominated (total time) | Noise dominated (detector-on time) | Marked lightcurve |
|---|---|---|---|---|---|---|---|
| A | 7500 | 7500 | 210 | 210 | 2.80% | 2.80% | 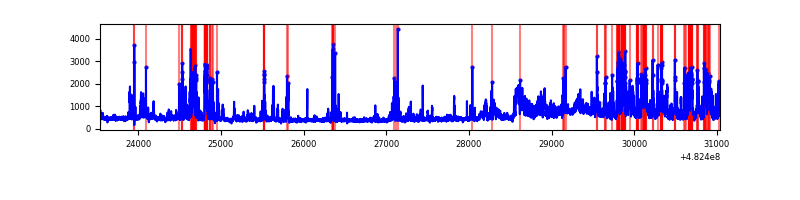 |
| B | 7500 | 7500 | 74 | 74 | 0.99% | 0.99% | 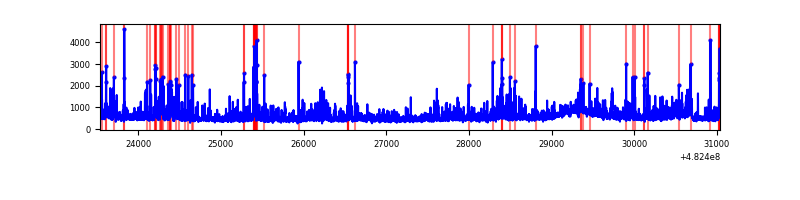 |
| C | 7500 | 7500 | 245 | 245 | 3.27% | 3.27% | 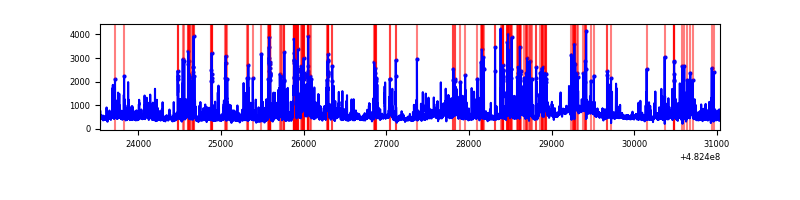 |
| D | 7501 | 7501 | 209 | 209 | 2.79% | 2.79% | 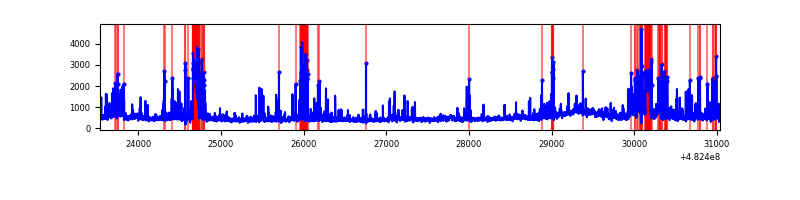 |
Top three noisy pixels from each quadrant. If the there are fewer than three noisy pixels in the level2.evt file, extra rows are filled as -1
| Pixel properties | Quadrant properties | ||||||
|---|---|---|---|---|---|---|---|
| Quadrant | DetID | PixID | Counts | Sigma | Mean | Median | Sigma |
| A | 12 | 250 | 796106 | 3912.22 | 827 | 804 | 203.3 |
| A | 4 | 175 | 248352 | 1217.73 | 827 | 804 | 203.3 |
| A | 3 | 22 | 210305 | 1030.57 | 827 | 804 | 203.3 |
| B | 0 | 171 | 285888 | 1611.47 | 825 | 798 | 176.9 |
| B | 4 | 170 | 174294 | 980.69 | 825 | 798 | 176.9 |
| B | 4 | 174 | 161123 | 906.24 | 825 | 798 | 176.9 |
| C | 15 | 189 | 682126 | 3075.53 | 805 | 797 | 221.5 |
| C | 12 | 254 | 431058 | 1942.21 | 805 | 797 | 221.5 |
| C | 5 | 250 | 196963 | 885.5 | 805 | 797 | 221.5 |
| D | 8 | 176 | 493140 | 2223.36 | 800 | 773 | 221.5 |
| D | 5 | 113 | 258149 | 1162.22 | 800 | 773 | 221.5 |
| D | 2 | 249 | 246744 | 1110.72 | 800 | 773 | 221.5 |
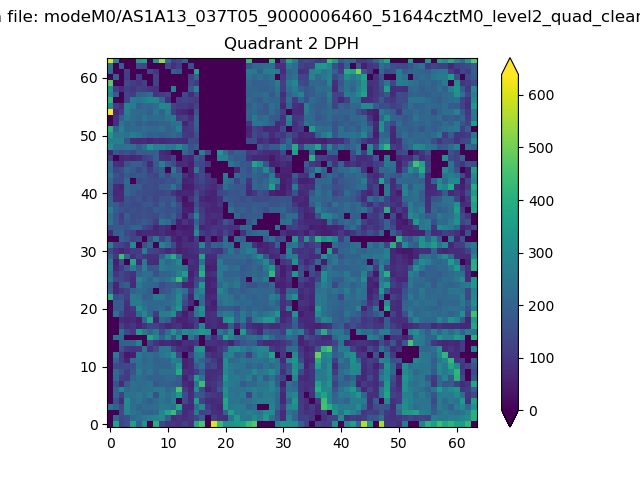
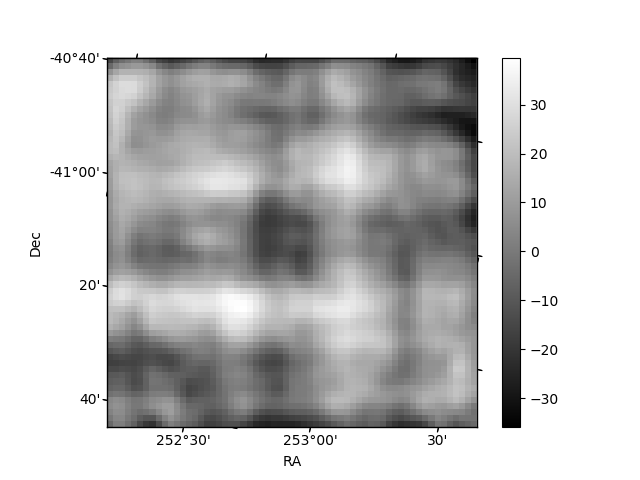
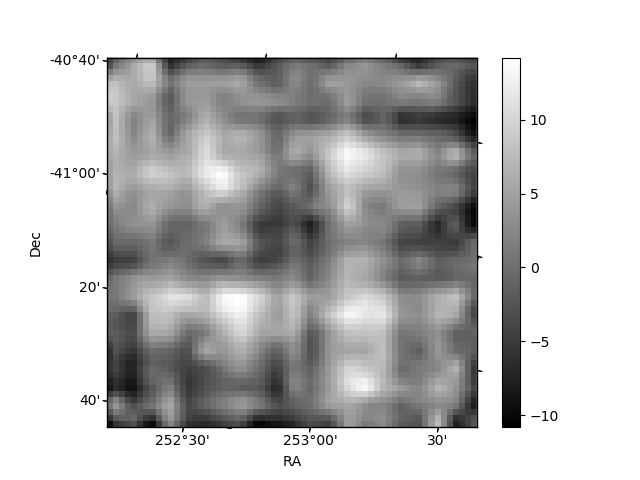
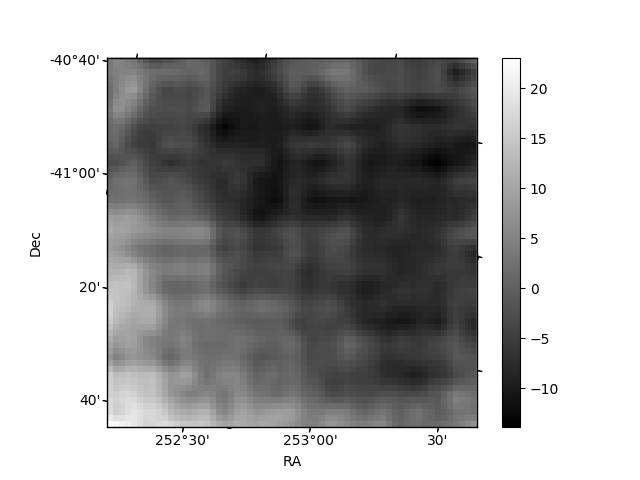
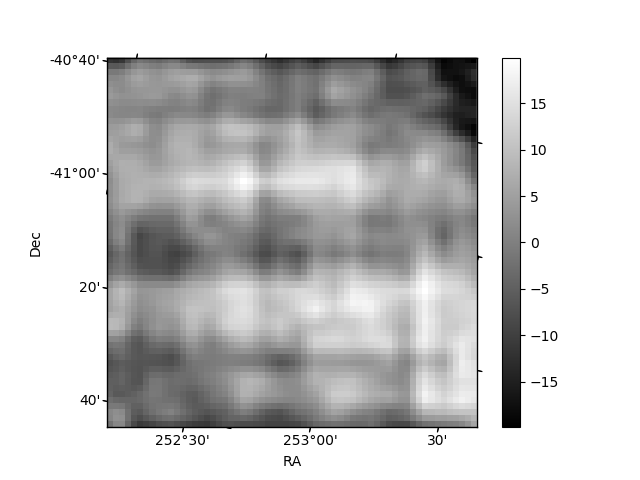
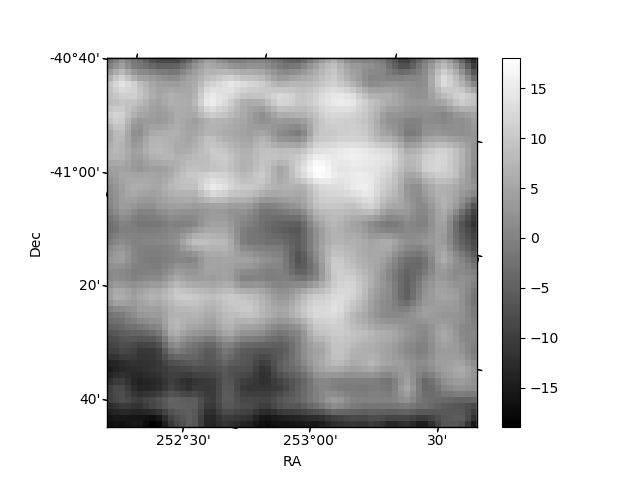
Histogram calculated using DETX and DETY for each event in the final _common_clean file
| Quadrant A | 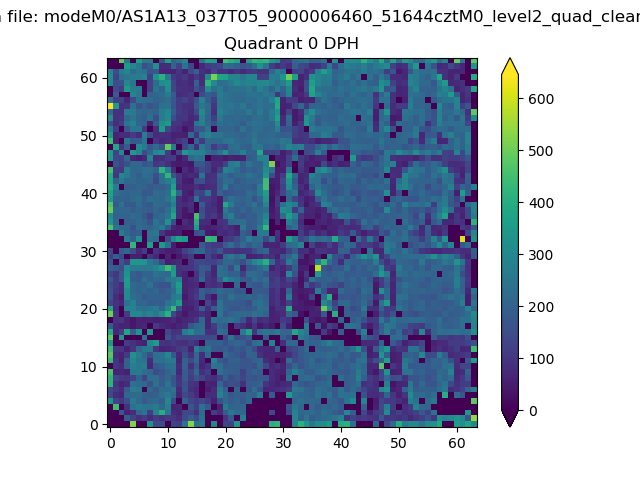 |
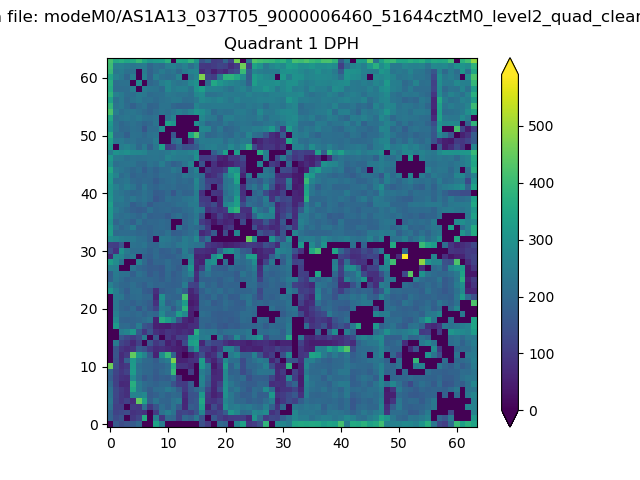 |
Quadrant B |
|---|---|---|---|
| Quadrant D | 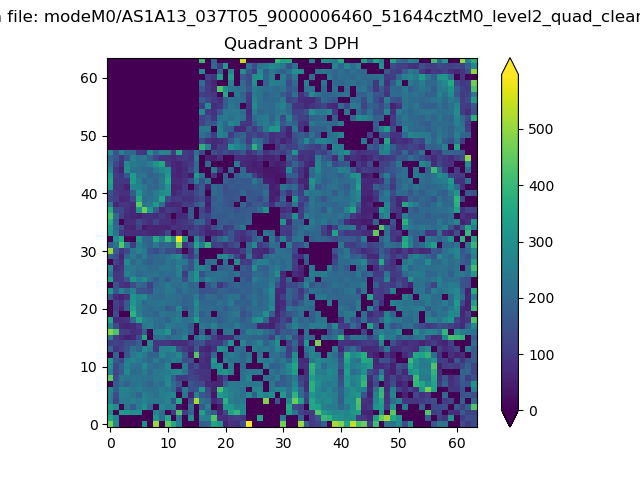 |
 |
Quadrant C |
| Plot type | Count rate plots | Images |
|---|---|---|
| Comparison with Poisson distribution Blue bars denote a histogram of data divided into 1 sec bins. Red curve is a Poisson curve with rate = median count rate of data. |
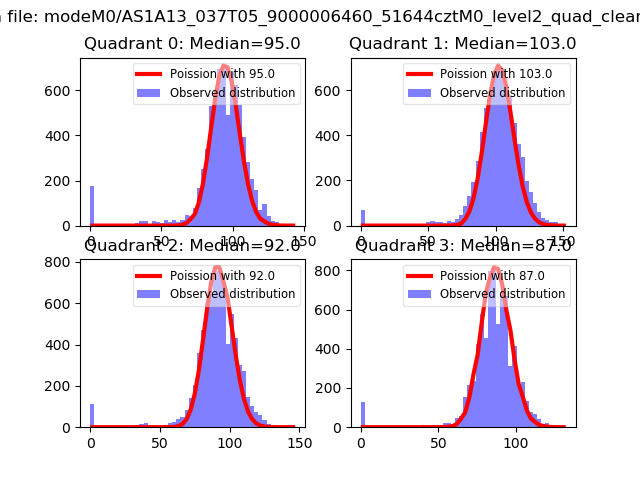 |
 |
| Quadrant-wise count rates Data is divided into 100 sec bins |
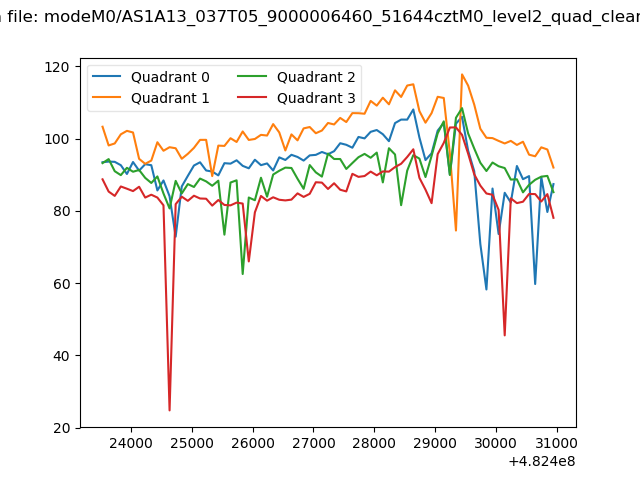 |
|
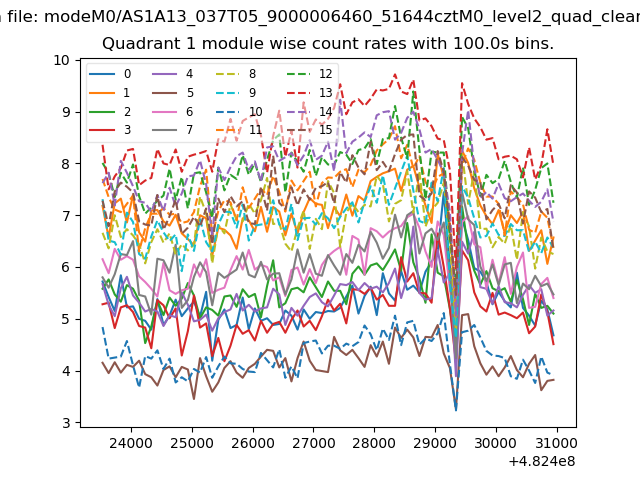
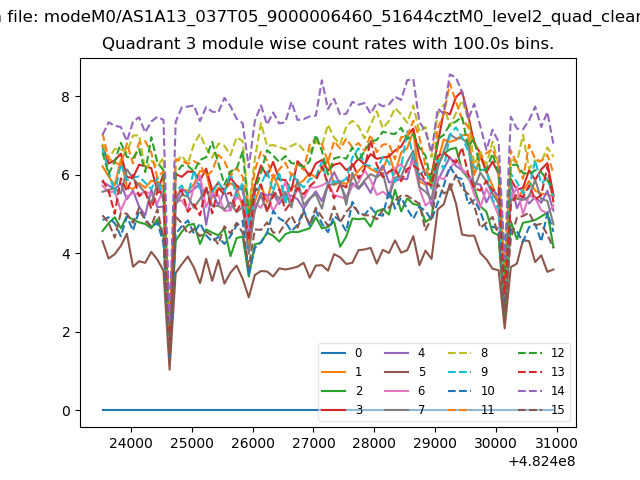
| Module-wise count rates for Quadrant A Data is divided into 100 sec bins |
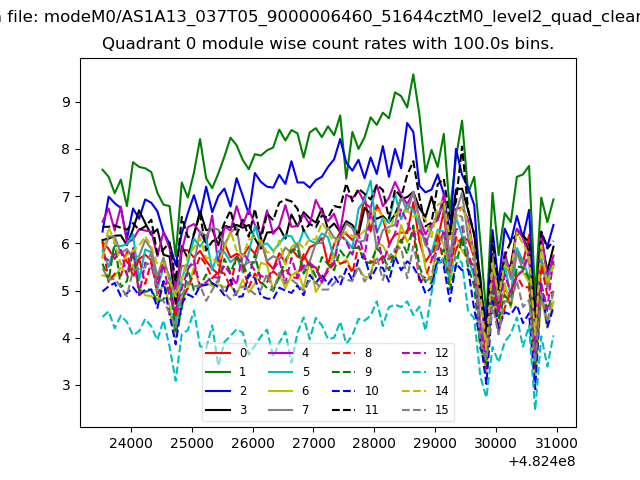 |
 |
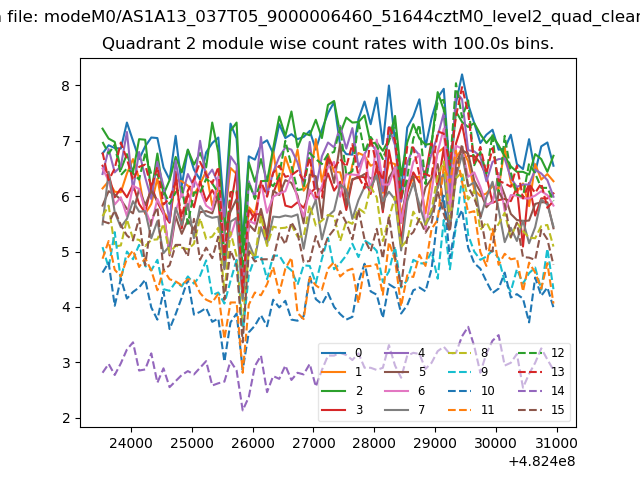
| Module-wise count rates for Quadrant B Data is divided into 100 sec bins |
 |
 |
| Module-wise count rates for Quadrant C Data is divided into 100 sec bins |
 |
 |
| Module-wise count rates for Quadrant D Data is divided into 100 sec bins |
 |
 |
| Parameter | Plot |
|---|---|
| CZT HV Monitor | 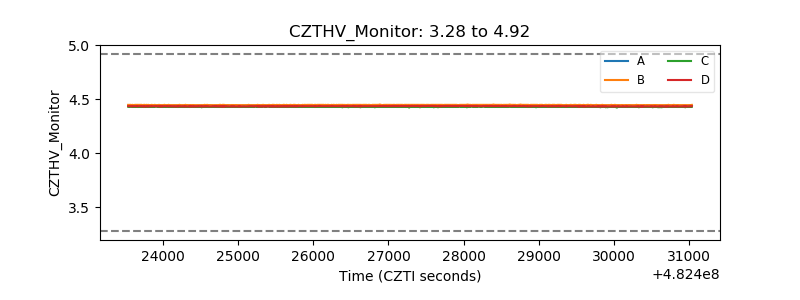 |
| D_VDD | 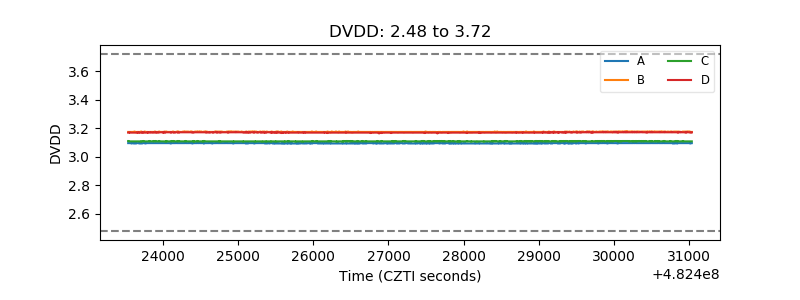 |
| Temperature 1 | 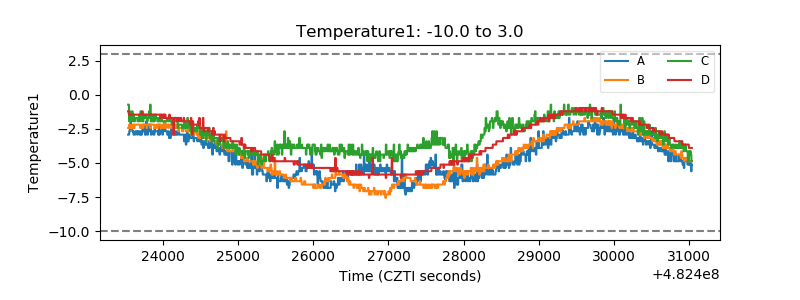 |
| Veto HV Monitor | 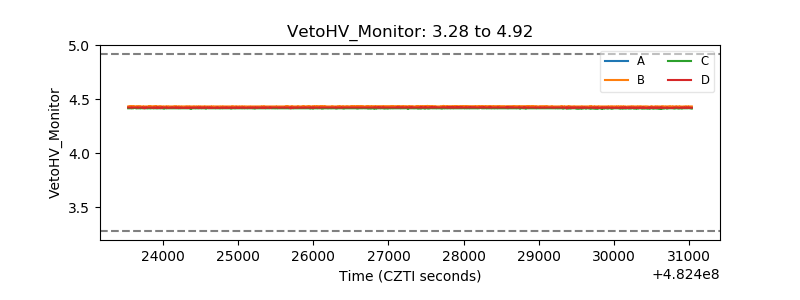 |
| Veto LLD | 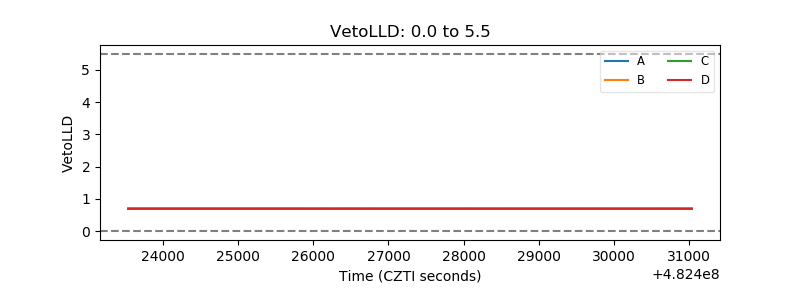 |
| Alpha Counter | 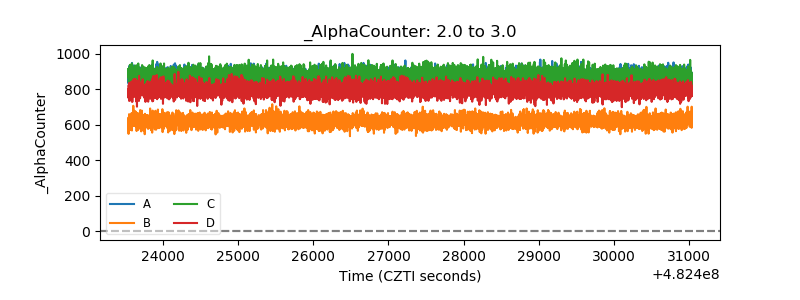 |
| _CPM_Rate | 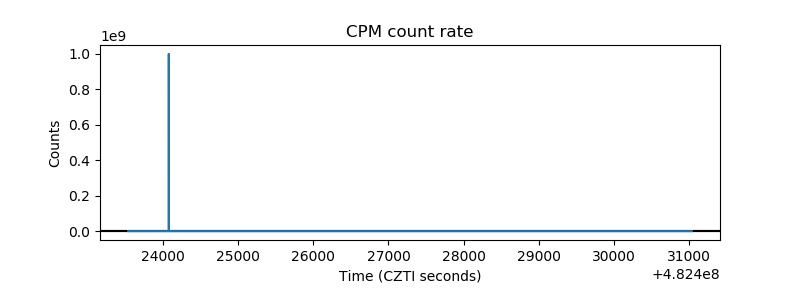 |
| CZT Counter |  |
| +2.5 Volts monitor | 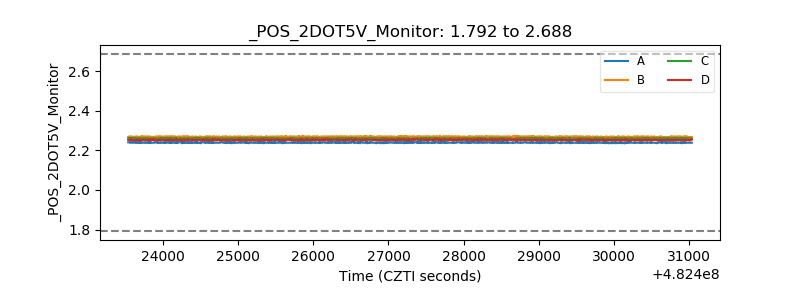 |
| +5 Volts monitor | 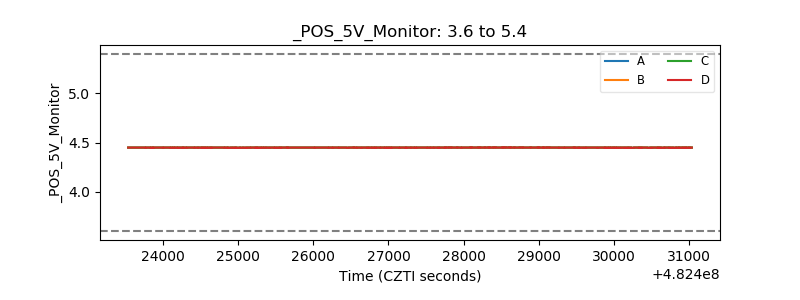 |
| _ROLL_ROT | 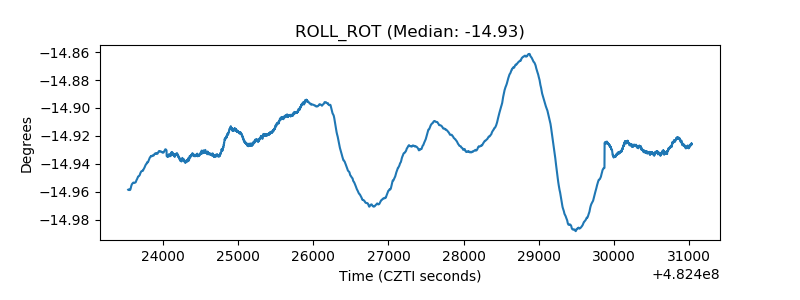 |
| _Roll_DEC | 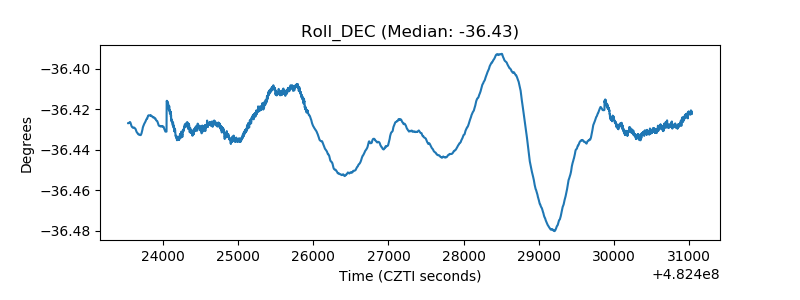 |
| _Roll_RA | 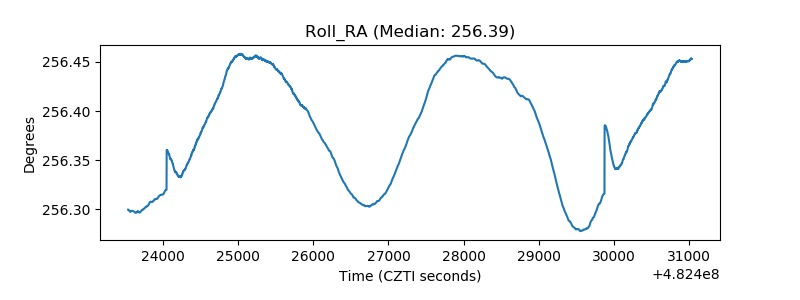 |
| Veto Counter | 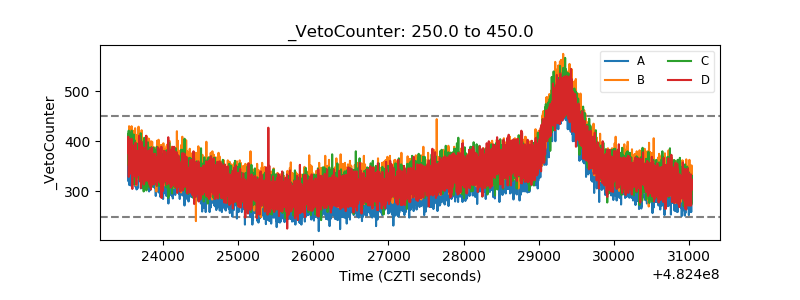 |