| Param | Original file | Final file |
|---|---|---|
| Filename | modeM0/AS1A13_037T05_9000006460_51646cztM0_level2.fits | modeM0/AS1A13_037T05_9000006460_51646cztM0_level2_quad_clean.evt |
| Size (bytes) | 651,352,320 | 102,781,440 |
| Size | 621.2 MB | 98.0 MB |
| Events in quadrant A | 7,739,446 | 602,638 |
| Events in quadrant B | 3,883,938 | 761,290 |
| Events in quadrant C | 4,285,140 | 671,360 |
| Events in quadrant D | 7,624,682 | 557,694 |
| Mode M0 | |||
|---|---|---|---|
| Quadrant | BADHDUFLAG | Total packets | Discarded packets |
| A | 0 | 28164 | 0 |
| B | 0 | 16577 | 0 |
| C | 0 | 18172 | 0 |
| D | 0 | 27897 | 0 |
| Mode SS | |||
|---|---|---|---|
| Quadrant | BADHDUFLAG | Total packets | Discarded packets |
| A | 0 | 150 | 0 |
| B | 0 | 150 | 0 |
| C | 0 | 150 | 0 |
| D | 0 | 150 | 0 |
| Quadrant | Total seconds | Saturated seconds | Saturation percentage |
|---|---|---|---|
| A | 7455 | 1309 | 17.558685% |
| B | 7454 | 41 | 0.550040% |
| C | 7454 | 146 | 1.958680% |
| D | 7454 | 1024 | 13.737591% |
Noise dominated data is calculated using 1-second bins in cleaned event files. If a bin has >2000 counts, and if more than 50% of those come from <1% of pixels, then it is considered to be noise-dominated and hence unusable.
| Quadrant | # 1 sec bins | Bins with >0 counts | Bins with >2000 counts | High rate bins dominated by noise | Noise dominated (total time) | Noise dominated (detector-on time) | Marked lightcurve |
|---|---|---|---|---|---|---|---|
| A | 7455 | 7455 | 980 | 980 | 13.15% | 13.15% | 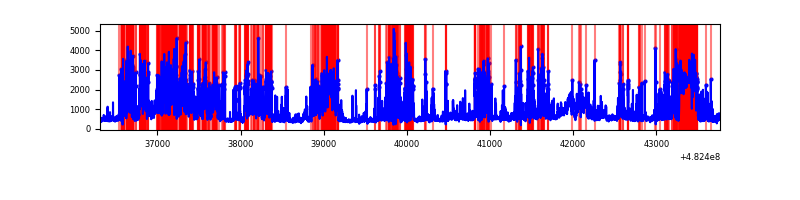 |
| B | 7454 | 7454 | 17 | 17 | 0.23% | 0.23% | 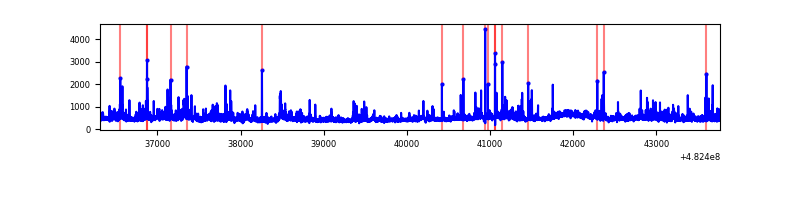 |
| C | 7454 | 7454 | 116 | 116 | 1.56% | 1.56% | 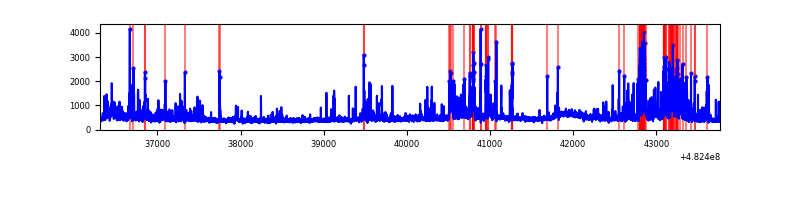 |
| D | 7454 | 7454 | 944 | 944 | 12.66% | 12.66% | 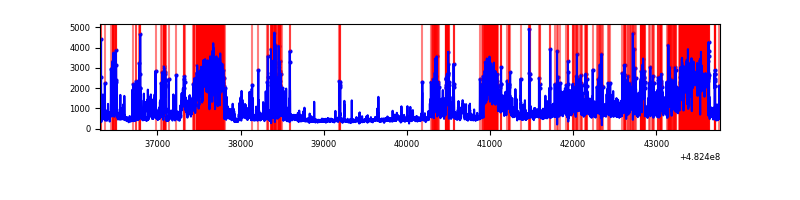 |
Top three noisy pixels from each quadrant. If the there are fewer than three noisy pixels in the level2.evt file, extra rows are filled as -1
| Pixel properties | Quadrant properties | ||||||
|---|---|---|---|---|---|---|---|
| Quadrant | DetID | PixID | Counts | Sigma | Mean | Median | Sigma |
| A | 12 | 250 | 1673066 | 8981.15 | 743 | 726 | 186.2 |
| A | 7 | 64 | 1128392 | 6056.03 | 743 | 726 | 186.2 |
| A | 15 | 174 | 870015 | 4668.44 | 743 | 726 | 186.2 |
| B | 10 | 44 | 94087 | 545.72 | 795 | 768 | 171.0 |
| B | 0 | 171 | 92542 | 536.69 | 795 | 768 | 171.0 |
| B | 8 | 128 | 50162 | 288.85 | 795 | 768 | 171.0 |
| C | 15 | 148 | 306251 | 1429.07 | 776 | 769 | 213.8 |
| C | 12 | 254 | 205867 | 959.46 | 776 | 769 | 213.8 |
| C | 0 | 209 | 140538 | 653.85 | 776 | 769 | 213.8 |
| D | 7 | 60 | 1854174 | 9045.53 | 724 | 699 | 204.9 |
| D | 3 | 12 | 773944 | 3773.67 | 724 | 699 | 204.9 |
| D | 8 | 176 | 401166 | 1954.4 | 724 | 699 | 204.9 |
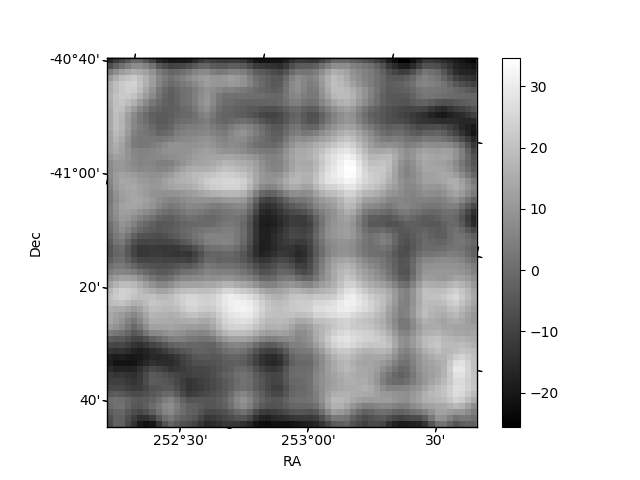
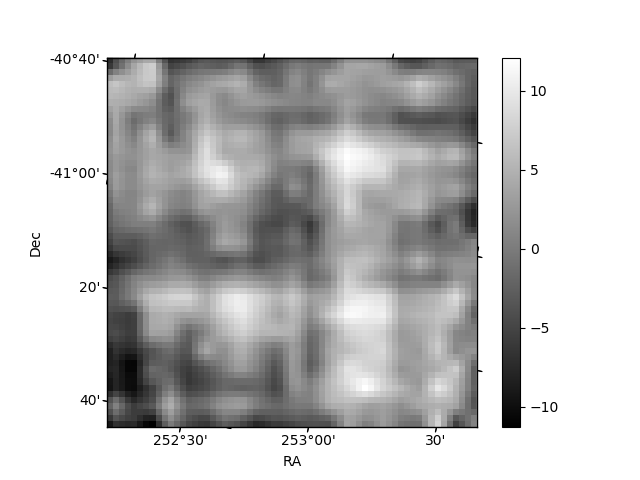
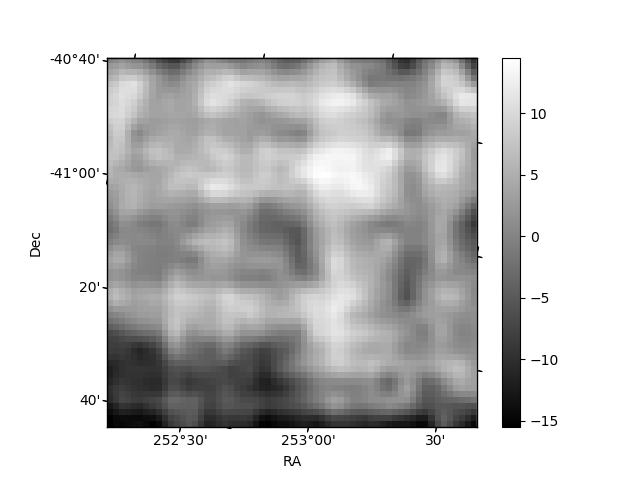
Histogram calculated using DETX and DETY for each event in the final _common_clean file
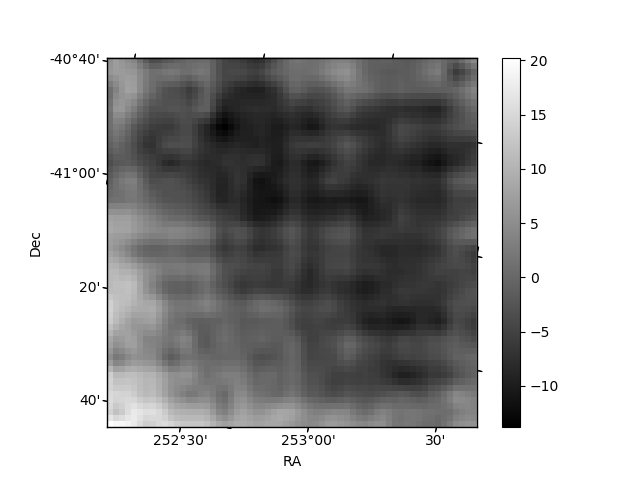
| Quadrant A | 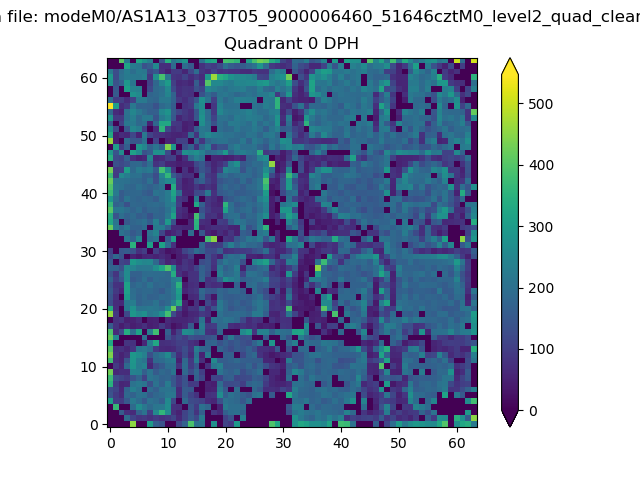 |
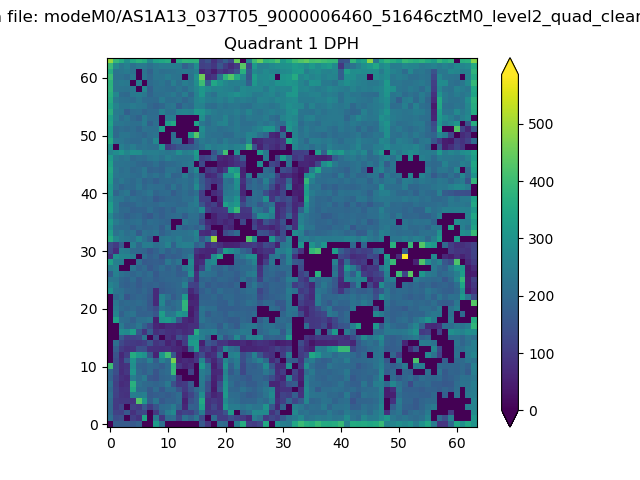 |
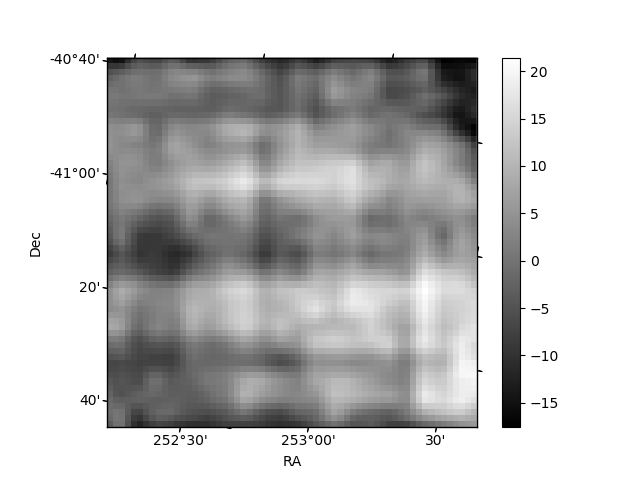
Quadrant B |
|---|---|---|---|
| Quadrant D | 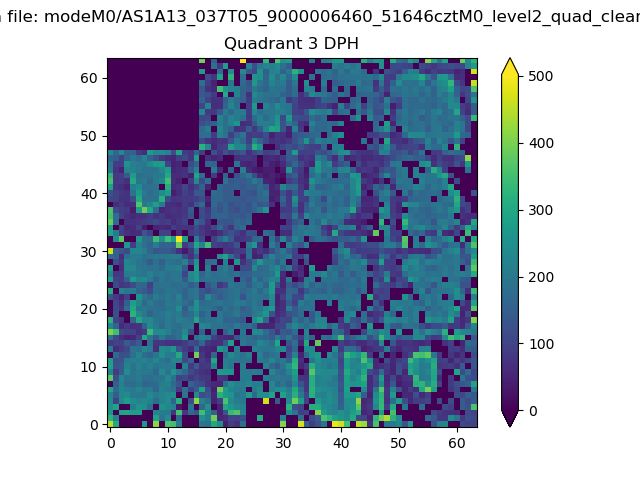 |
 |
Quadrant C |
| Plot type | Count rate plots | Images |
|---|---|---|
| Comparison with Poisson distribution Blue bars denote a histogram of data divided into 1 sec bins. Red curve is a Poisson curve with rate = median count rate of data. |
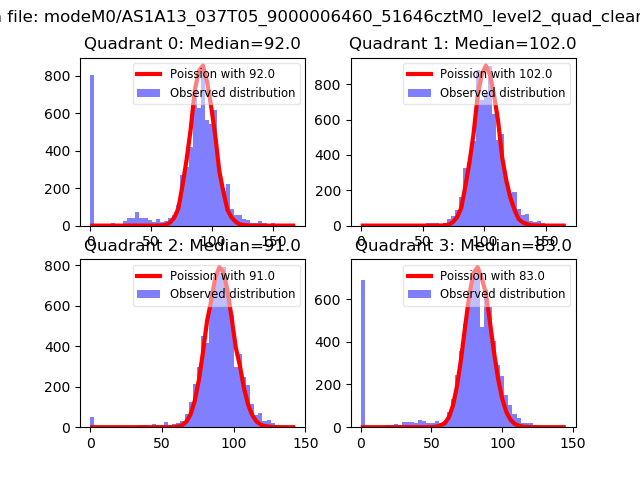 |
 |
| Quadrant-wise count rates Data is divided into 100 sec bins |
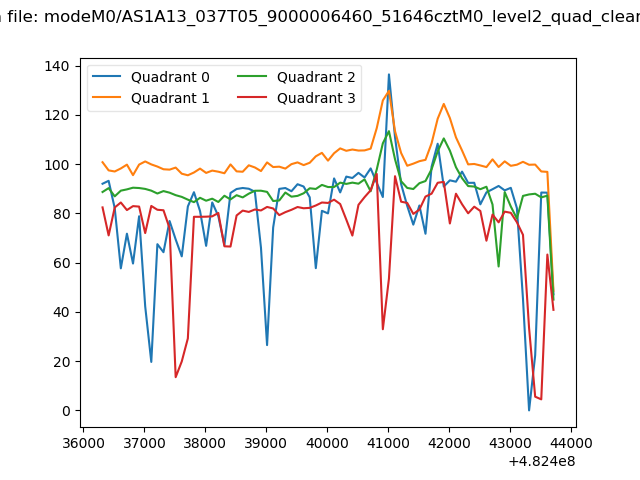 |
|
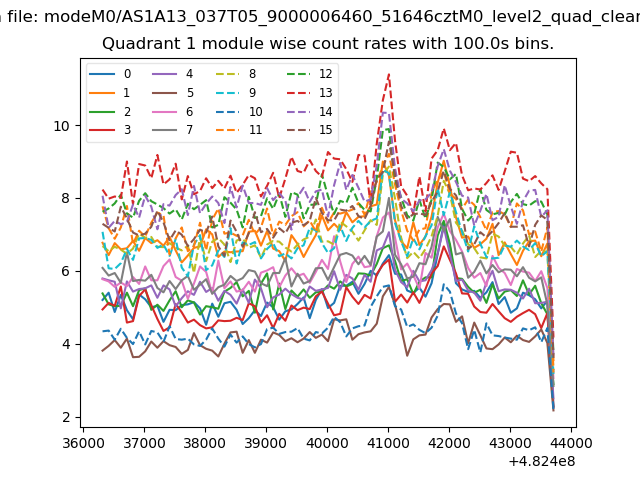
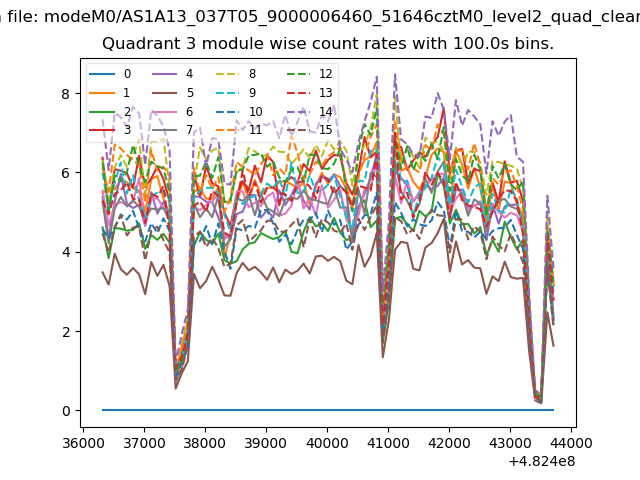
| Module-wise count rates for Quadrant A Data is divided into 100 sec bins |
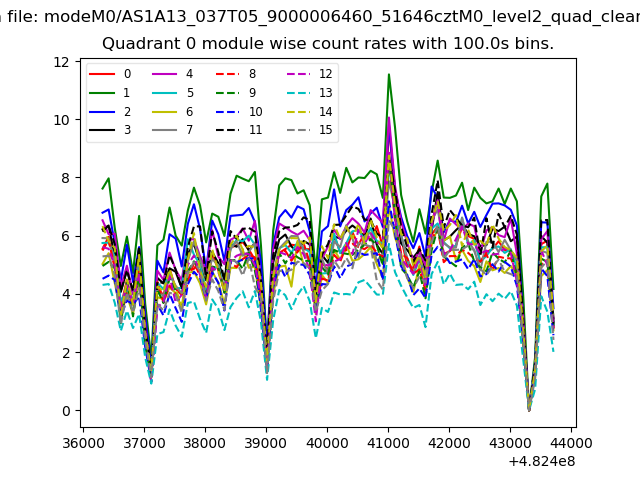 |
 |
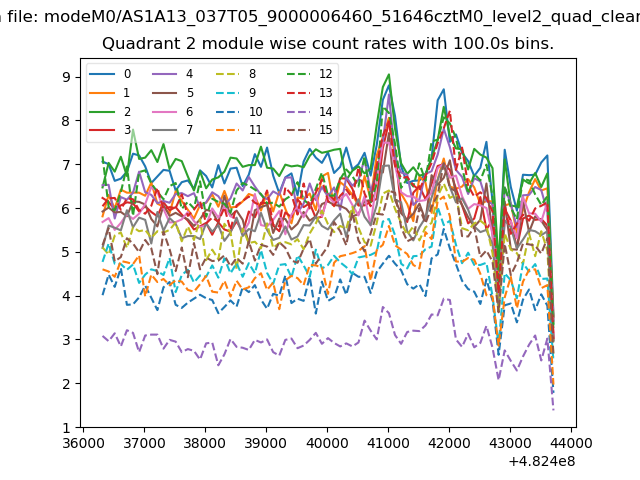
| Module-wise count rates for Quadrant B Data is divided into 100 sec bins |
 |
 |
| Module-wise count rates for Quadrant C Data is divided into 100 sec bins |
 |
 |
| Module-wise count rates for Quadrant D Data is divided into 100 sec bins |
 |
 |
| Parameter | Plot |
|---|---|
| CZT HV Monitor | 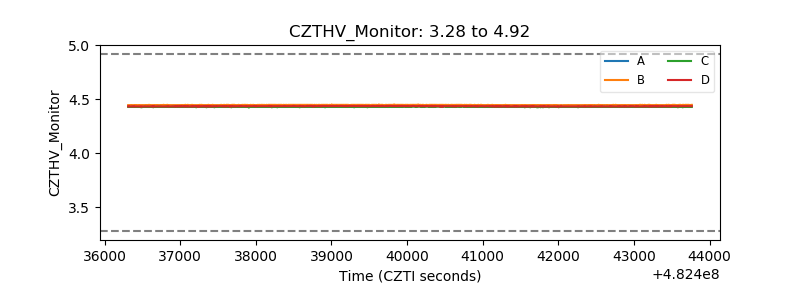 |
| D_VDD | 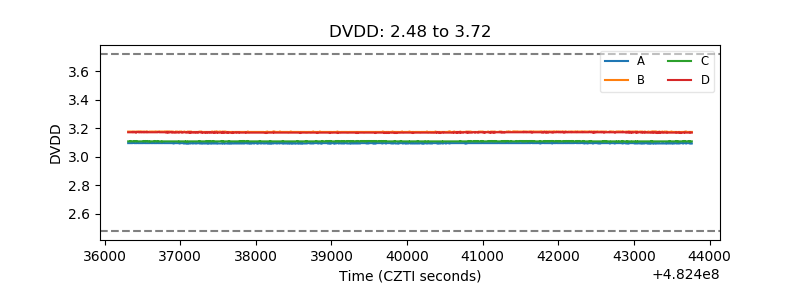 |
| Temperature 1 | 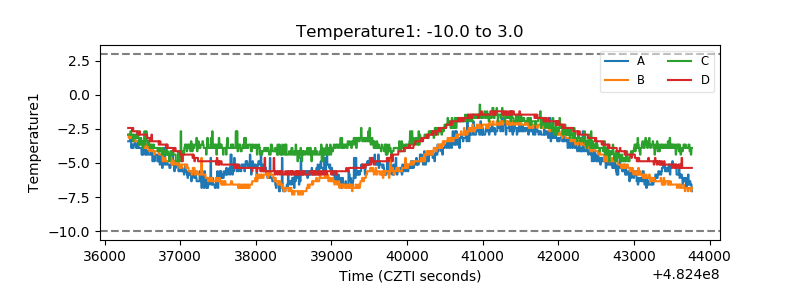 |
| Veto HV Monitor | 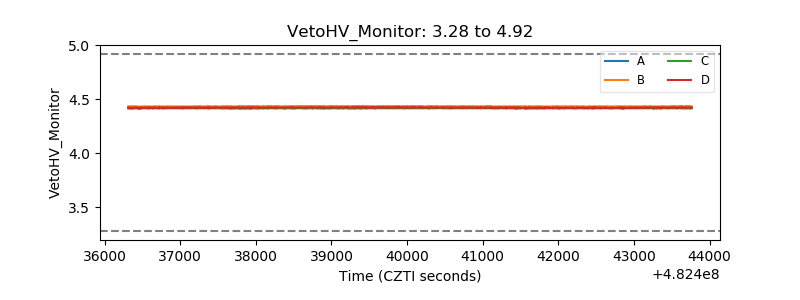 |
| Veto LLD |  |
| Alpha Counter | 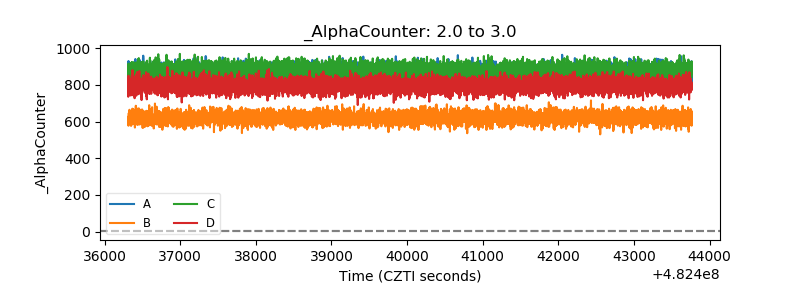 |
| _CPM_Rate | 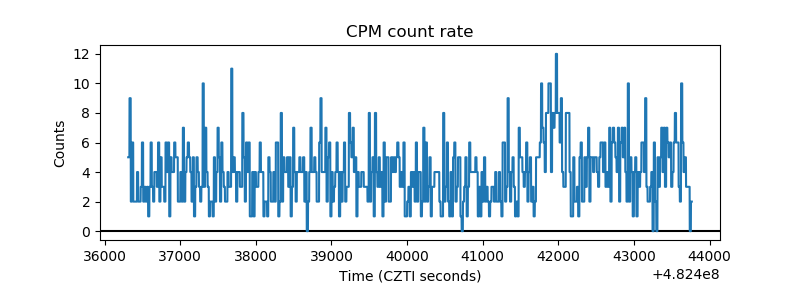 |
| CZT Counter | 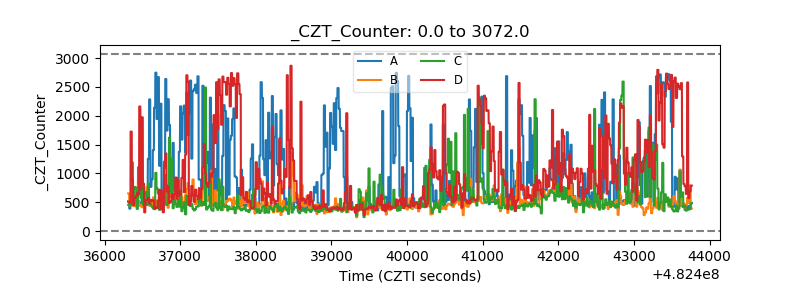 |
| +2.5 Volts monitor | 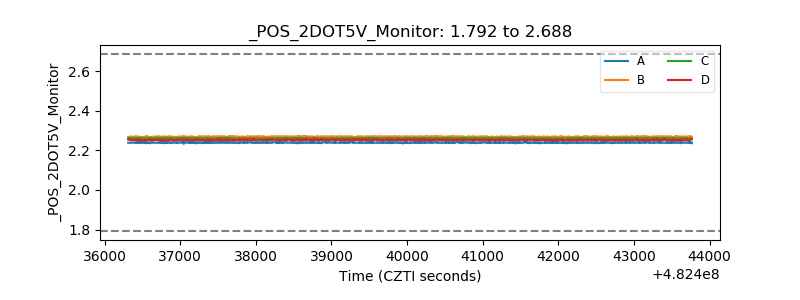 |
| +5 Volts monitor | 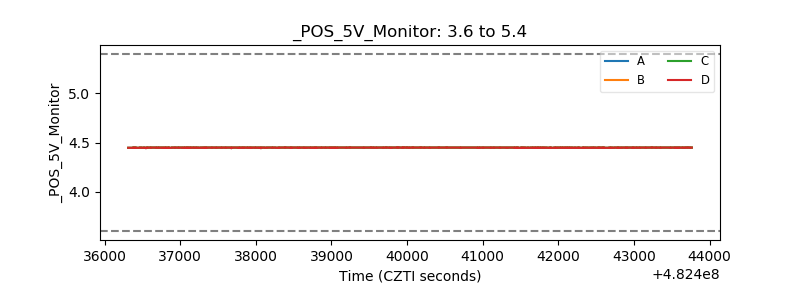 |
| _ROLL_ROT | 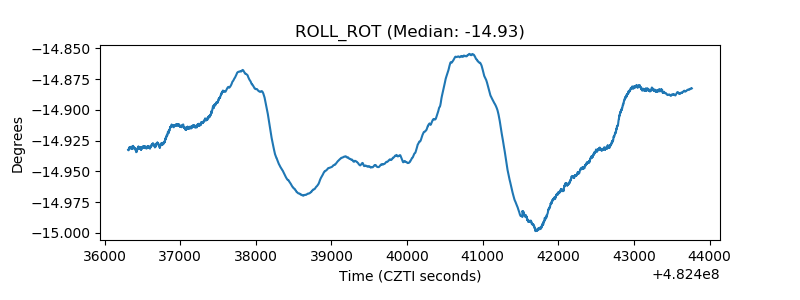 |
| _Roll_DEC | 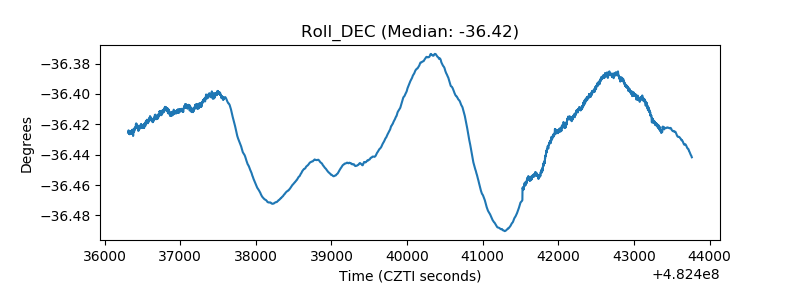 |
| _Roll_RA | 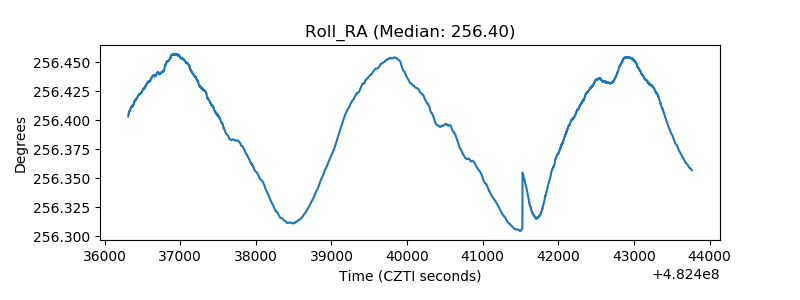 |
| Veto Counter | 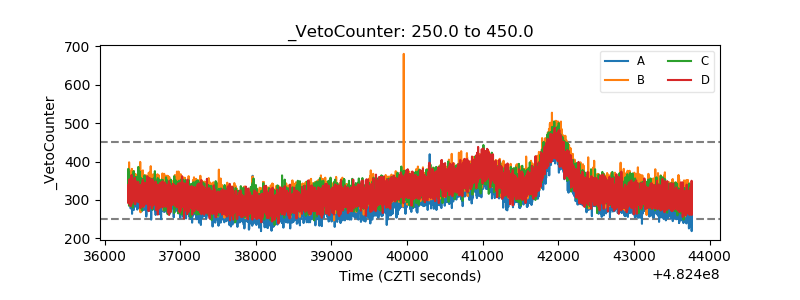 |