| Param | Original file | Final file |
|---|---|---|
| Filename | modeM0/AS1A13_037T05_9000006460_51654cztM0_level2.fits | modeM0/AS1A13_037T05_9000006460_51654cztM0_level2_quad_clean.evt |
| Size (bytes) | 589,651,200 | 86,578,560 |
| Size | 562.3 MB | 82.6 MB |
| Events in quadrant A | 5,895,265 | 546,718 |
| Events in quadrant B | 8,036,311 | 537,313 |
| Events in quadrant C | 4,007,351 | 569,162 |
| Events in quadrant D | 3,423,327 | 550,012 |
| Mode M9 | |||
|---|---|---|---|
| Quadrant | BADHDUFLAG | Total packets | Discarded packets |
| A | 0 | 12 | 0 |
| B | 0 | 12 | 0 |
| C | 0 | 12 | 0 |
| D | 0 | 12 | 0 |
| Mode M0 | |||
|---|---|---|---|
| Quadrant | BADHDUFLAG | Total packets | Discarded packets |
| A | 0 | 21584 | 1 |
| B | 0 | 28069 | 1 |
| C | 0 | 16044 | 1 |
| D | 0 | 14267 | 1 |
| Mode SS | |||
|---|---|---|---|
| Quadrant | BADHDUFLAG | Total packets | Discarded packets |
| A | 0 | 120 | 0 |
| B | 0 | 120 | 0 |
| C | 0 | 120 | 0 |
| D | 0 | 120 | 0 |
| Quadrant | Total seconds | Saturated seconds | Saturation percentage |
|---|---|---|---|
| A | 5994 | 785 | 13.096430% |
| B | 5995 | 1476 | 24.620517% |
| C | 5995 | 397 | 6.622185% |
| D | 5995 | 131 | 2.185154% |
Noise dominated data is calculated using 1-second bins in cleaned event files. If a bin has >2000 counts, and if more than 50% of those come from <1% of pixels, then it is considered to be noise-dominated and hence unusable.
| Quadrant | # 1 sec bins | Bins with >0 counts | Bins with >2000 counts | High rate bins dominated by noise | Noise dominated (total time) | Noise dominated (detector-on time) | Marked lightcurve |
|---|---|---|---|---|---|---|---|
| A | 7144 | 5995 | 620 | 620 | 8.68% | 10.34% | 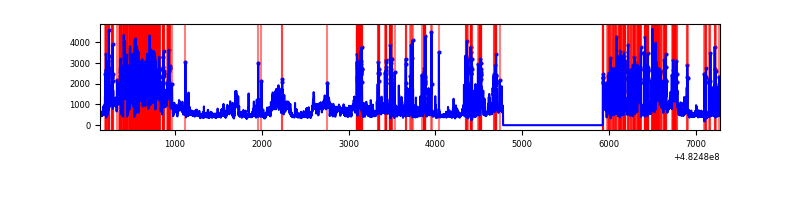 |
| B | 7145 | 5995 | 1096 | 1096 | 15.34% | 18.28% | 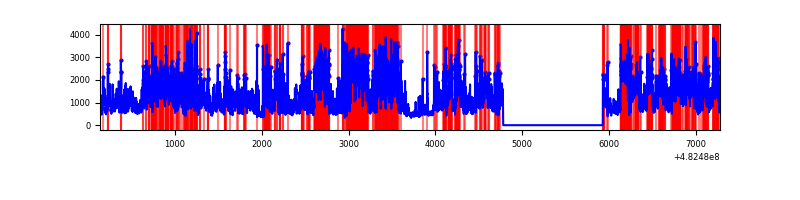 |
| C | 7145 | 5996 | 248 | 248 | 3.47% | 4.14% | 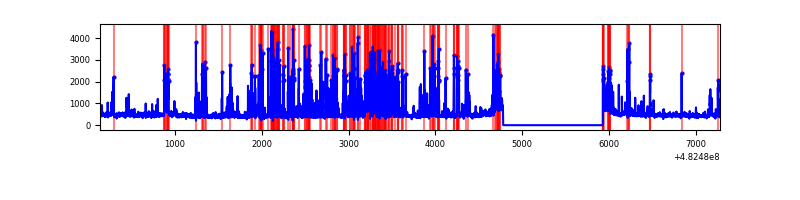 |
| D | 7145 | 5996 | 89 | 89 | 1.25% | 1.48% | 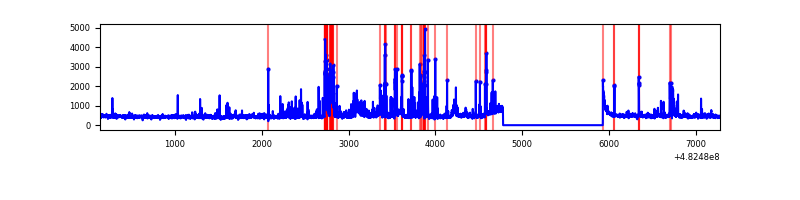 |
Top three noisy pixels from each quadrant. If the there are fewer than three noisy pixels in the level2.evt file, extra rows are filled as -1
| Pixel properties | Quadrant properties | ||||||
|---|---|---|---|---|---|---|---|
| Quadrant | DetID | PixID | Counts | Sigma | Mean | Median | Sigma |
| A | 7 | 64 | 1848619 | 11788.99 | 636 | 624 | 156.8 |
| A | 4 | 175 | 653792 | 4166.78 | 636 | 624 | 156.8 |
| A | 12 | 3 | 548609 | 3495.78 | 636 | 624 | 156.8 |
| B | 10 | 44 | 3356631 | 25798.63 | 609 | 590 | 130.1 |
| B | 5 | 172 | 1121990 | 8620.45 | 609 | 590 | 130.1 |
| B | 0 | 171 | 319961 | 2455.08 | 609 | 590 | 130.1 |
| C | 15 | 189 | 722276 | 4030.99 | 646 | 641 | 179.0 |
| C | 12 | 254 | 324635 | 1809.8 | 646 | 641 | 179.0 |
| C | 0 | 209 | 199735 | 1112.12 | 646 | 641 | 179.0 |
| D | 3 | 12 | 490631 | 2707.63 | 652 | 630 | 181.0 |
| D | 1 | 3 | 134493 | 739.69 | 652 | 630 | 181.0 |
| D | 8 | 176 | 92302 | 506.56 | 652 | 630 | 181.0 |
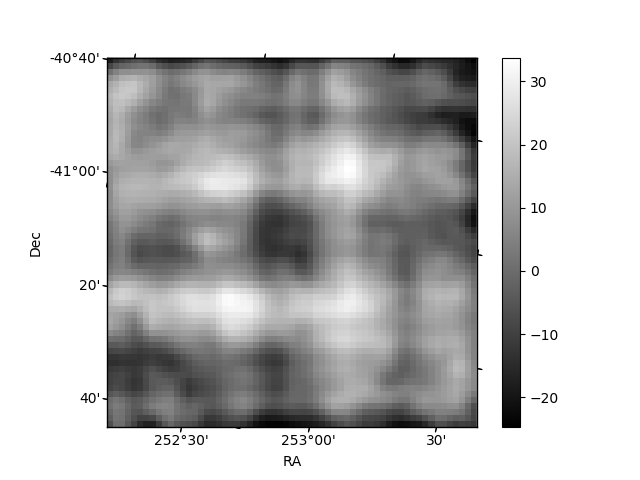
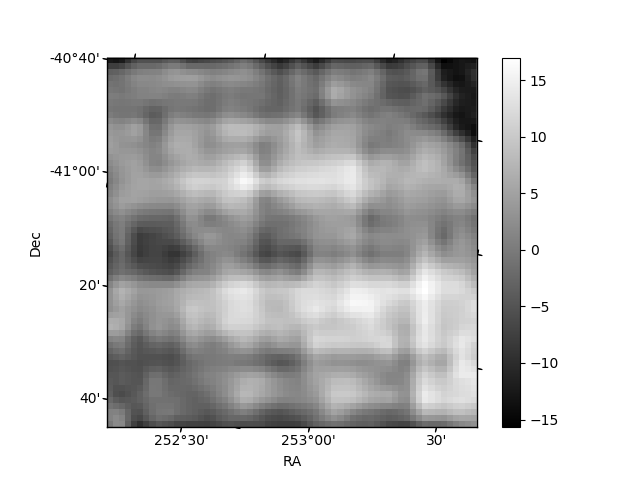
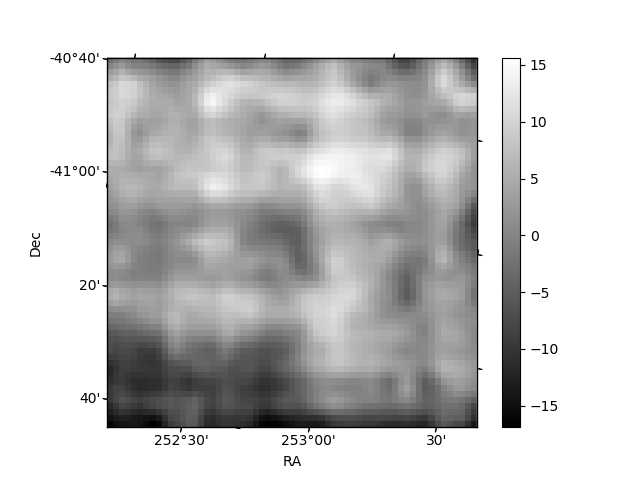
Histogram calculated using DETX and DETY for each event in the final _common_clean file
| Quadrant A | 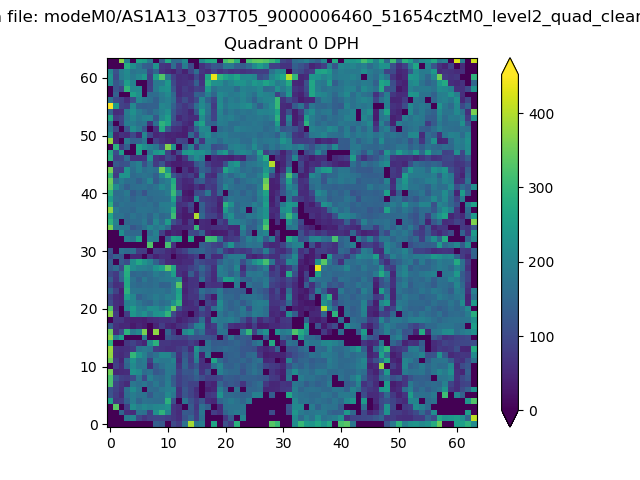 |
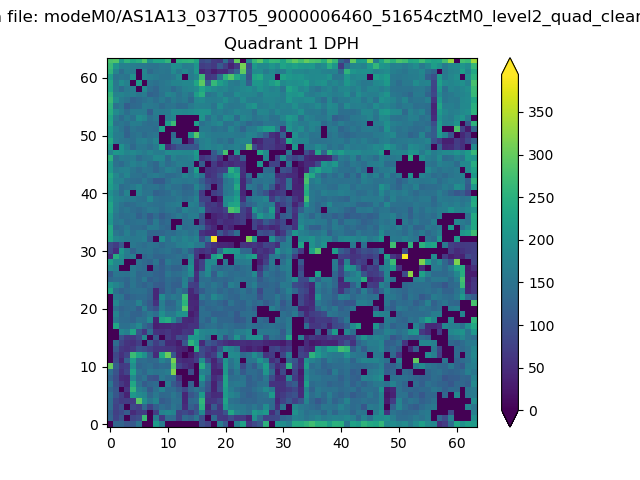 |
Quadrant B |
|---|---|---|---|
| Quadrant D | 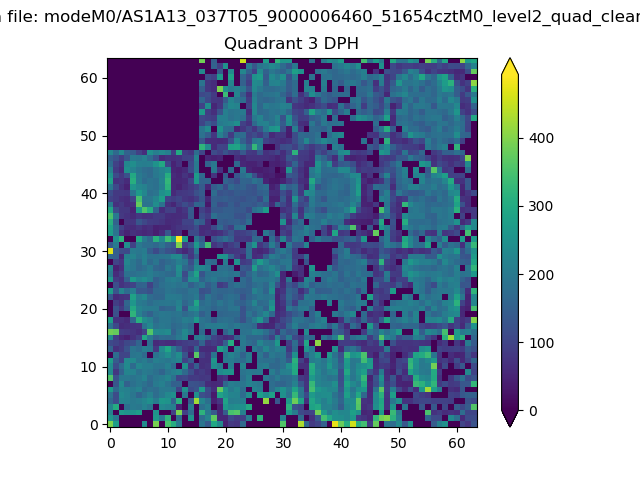 |
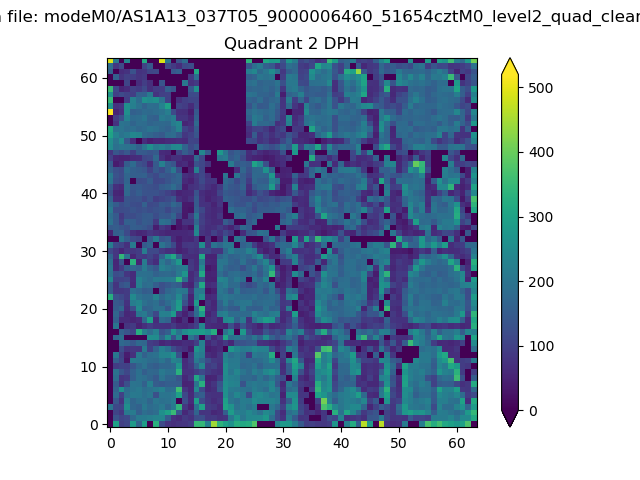 |
Quadrant C |
| Plot type | Count rate plots | Images |
|---|---|---|
| Comparison with Poisson distribution Blue bars denote a histogram of data divided into 1 sec bins. Red curve is a Poisson curve with rate = median count rate of data. |
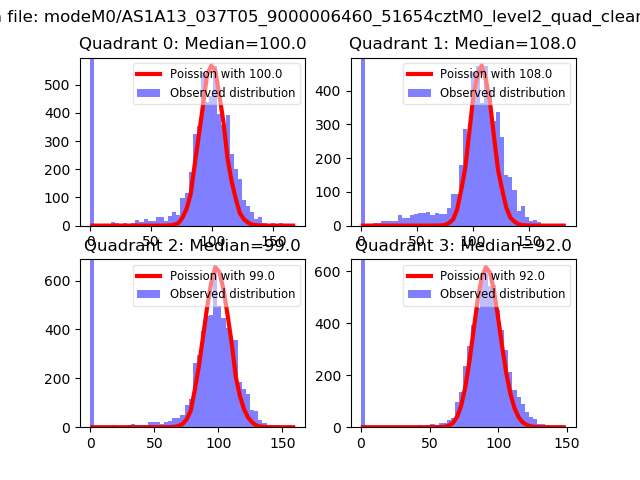 |
 |
| Quadrant-wise count rates Data is divided into 100 sec bins |
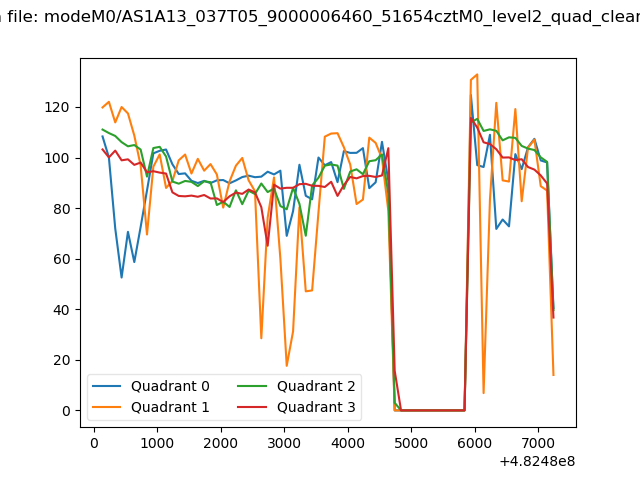 |
|
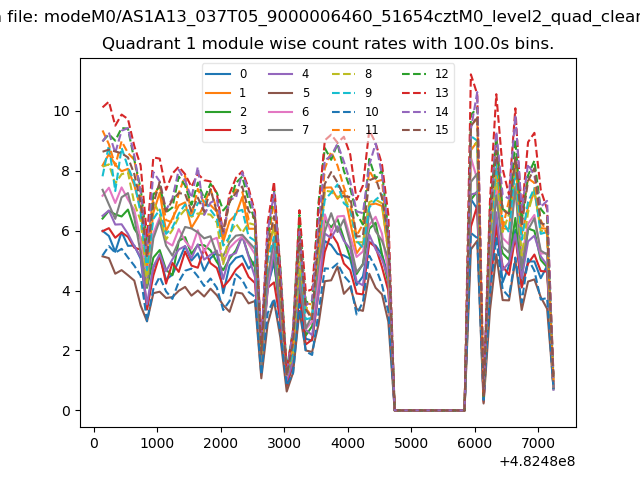
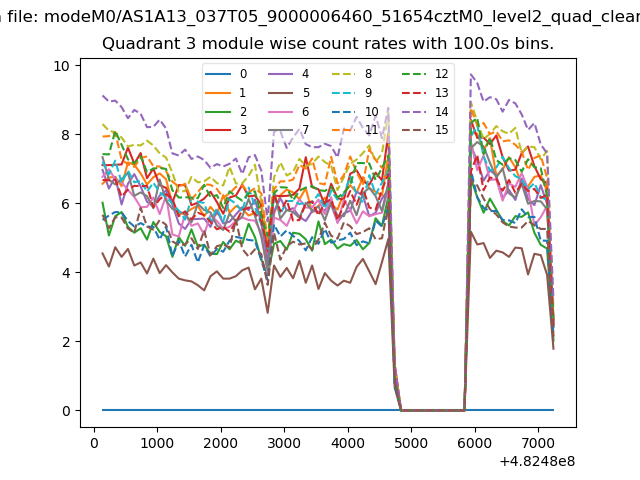
| Module-wise count rates for Quadrant A Data is divided into 100 sec bins |
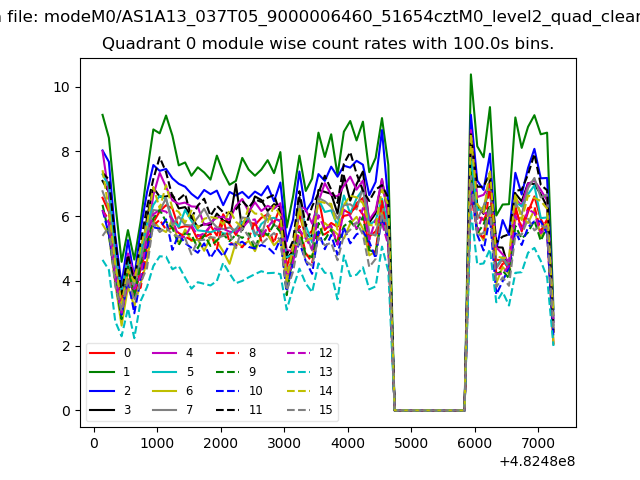 |
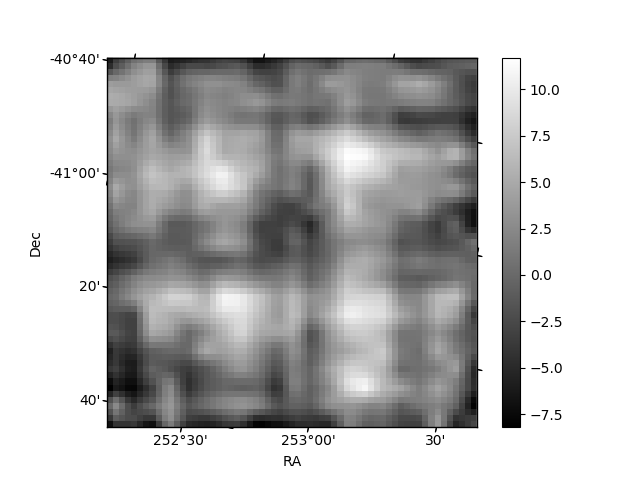 |
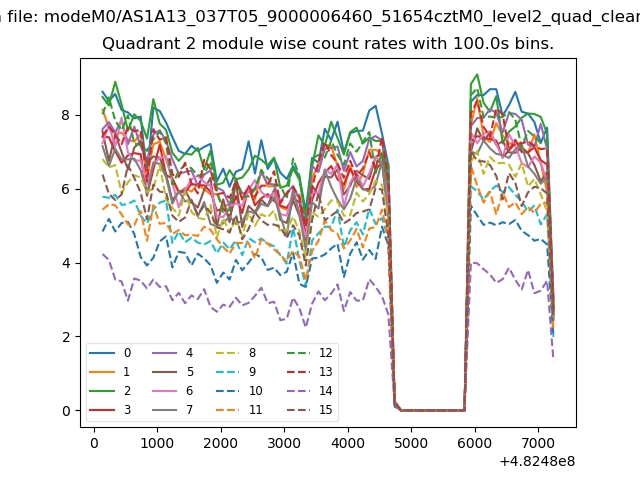
| Module-wise count rates for Quadrant B Data is divided into 100 sec bins |
 |
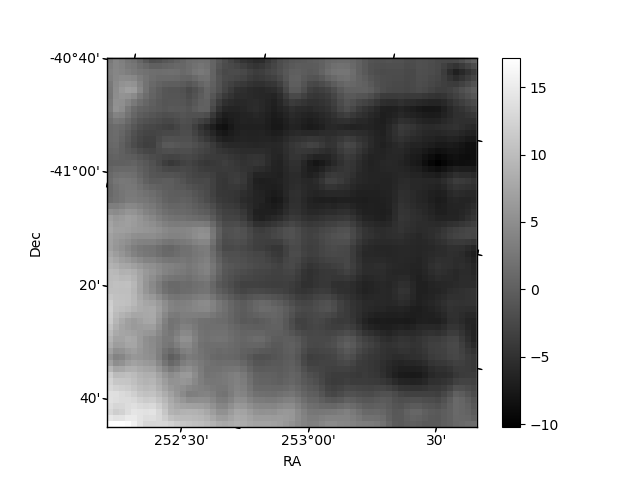 |
| Module-wise count rates for Quadrant C Data is divided into 100 sec bins |
 |
 |
| Module-wise count rates for Quadrant D Data is divided into 100 sec bins |
 |
 |
| Parameter | Plot |
|---|---|
| CZT HV Monitor | 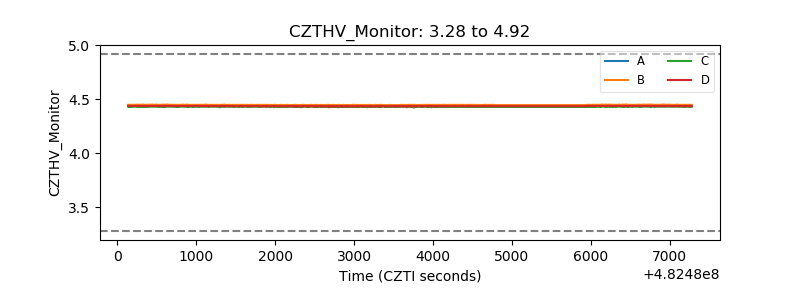 |
| D_VDD | 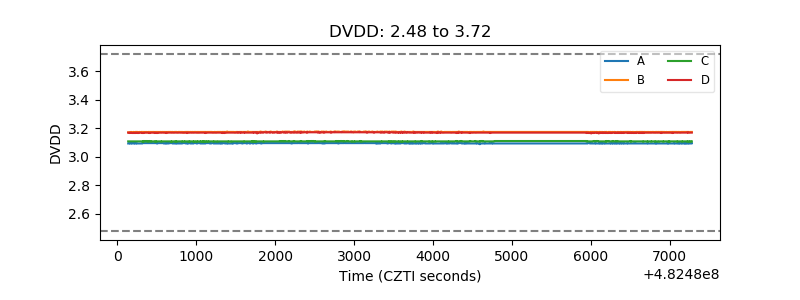 |
| Temperature 1 | 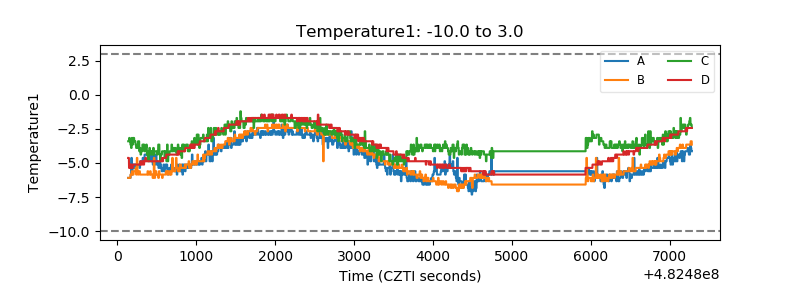 |
| Veto HV Monitor | 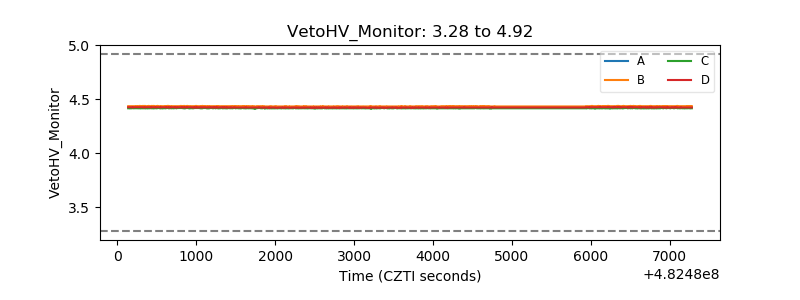 |
| Veto LLD | 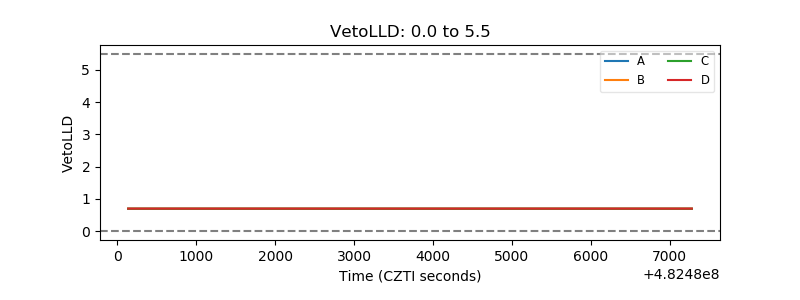 |
| Alpha Counter | 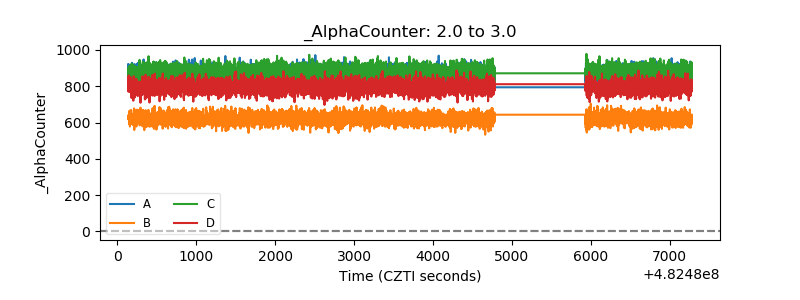 |
| _CPM_Rate |  |
| CZT Counter | 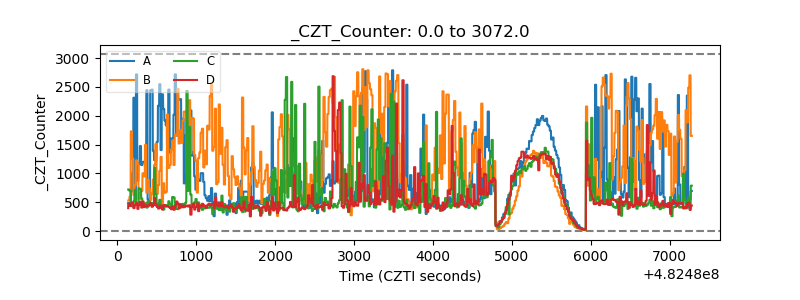 |
| +2.5 Volts monitor | 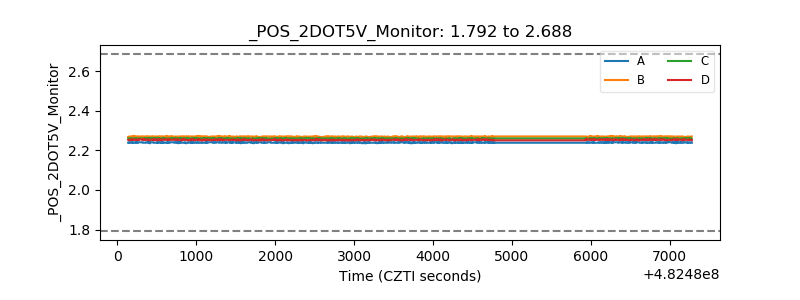 |
| +5 Volts monitor | 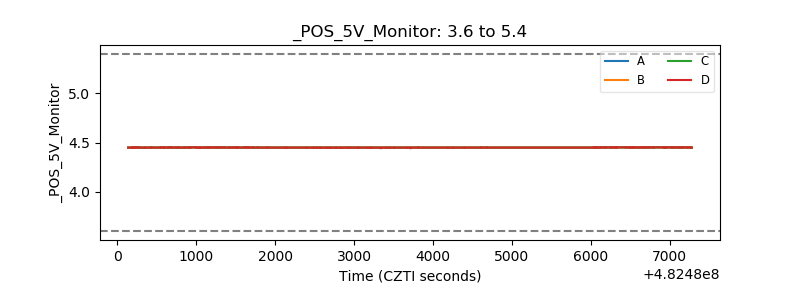 |
| _ROLL_ROT | 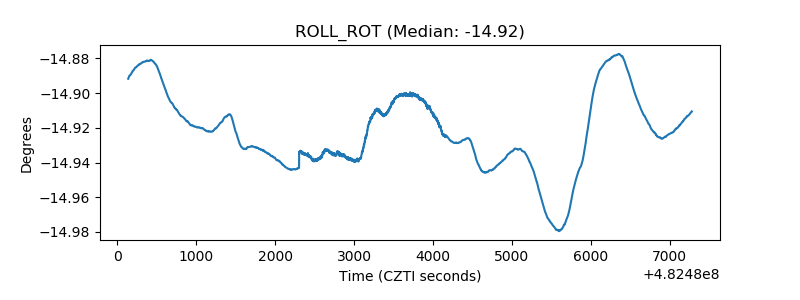 |
| _Roll_DEC | 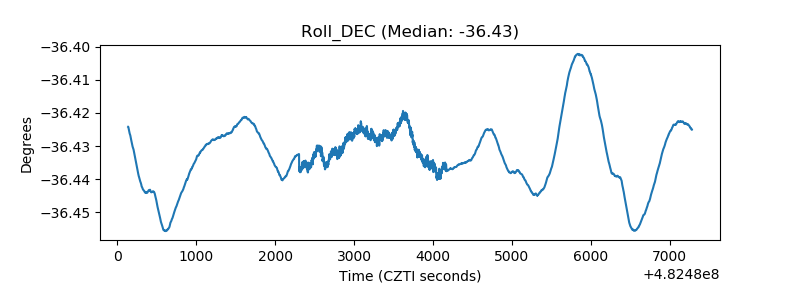 |
| _Roll_RA | 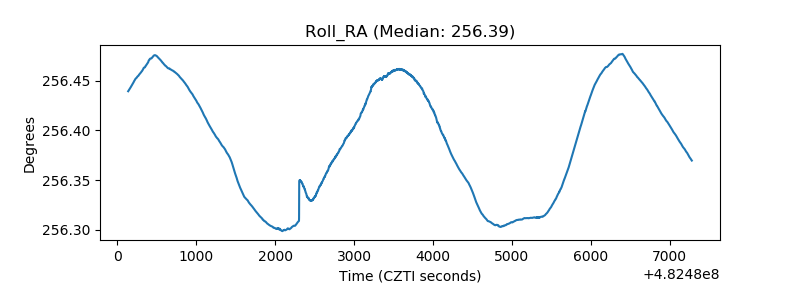 |
| Veto Counter | 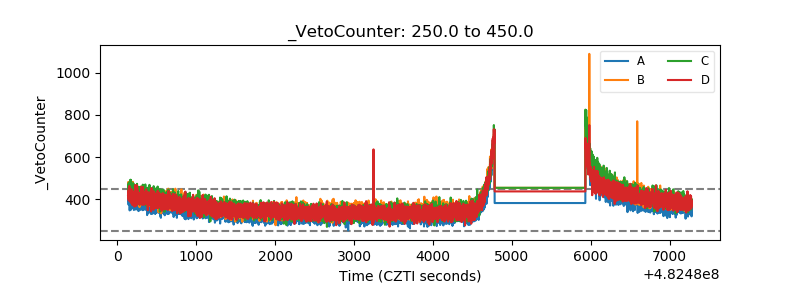 |