| Param | Original file | Final file |
|---|---|---|
| Filename | modeM0/AS1A13_037T05_9000006460_51655cztM0_level2.fits | modeM0/AS1A13_037T05_9000006460_51655cztM0_level2_quad_clean.evt |
| Size (bytes) | 535,345,920 | 89,467,200 |
| Size | 510.5 MB | 85.3 MB |
| Events in quadrant A | 4,832,055 | 576,915 |
| Events in quadrant B | 7,170,633 | 559,536 |
| Events in quadrant C | 3,926,417 | 582,391 |
| Events in quadrant D | 3,404,455 | 556,169 |
| Mode M9 | |||
|---|---|---|---|
| Quadrant | BADHDUFLAG | Total packets | Discarded packets |
| A | 0 | 11 | 0 |
| B | 0 | 11 | 0 |
| C | 0 | 11 | 0 |
| D | 0 | 11 | 0 |
| Mode M0 | |||
|---|---|---|---|
| Quadrant | BADHDUFLAG | Total packets | Discarded packets |
| A | 0 | 18557 | 1 |
| B | 0 | 25518 | 1 |
| C | 0 | 16031 | 1 |
| D | 0 | 14421 | 1 |
| Mode SS | |||
|---|---|---|---|
| Quadrant | BADHDUFLAG | Total packets | Discarded packets |
| A | 0 | 126 | 0 |
| B | 0 | 126 | 0 |
| C | 0 | 126 | 0 |
| D | 0 | 126 | 0 |
| Quadrant | Total seconds | Saturated seconds | Saturation percentage |
|---|---|---|---|
| A | 6219 | 632 | 10.162406% |
| B | 6219 | 1402 | 22.543817% |
| C | 6219 | 347 | 5.579675% |
| D | 6219 | 167 | 2.685319% |
Noise dominated data is calculated using 1-second bins in cleaned event files. If a bin has >2000 counts, and if more than 50% of those come from <1% of pixels, then it is considered to be noise-dominated and hence unusable.
| Quadrant | # 1 sec bins | Bins with >0 counts | Bins with >2000 counts | High rate bins dominated by noise | Noise dominated (total time) | Noise dominated (detector-on time) | Marked lightcurve |
|---|---|---|---|---|---|---|---|
| A | 7324 | 6220 | 450 | 450 | 6.14% | 7.23% | 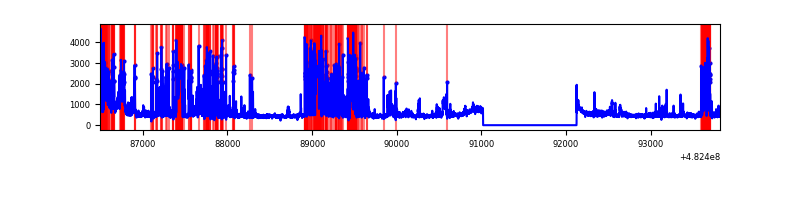 |
| B | 7324 | 6219 | 1025 | 1025 | 14.00% | 16.48% | 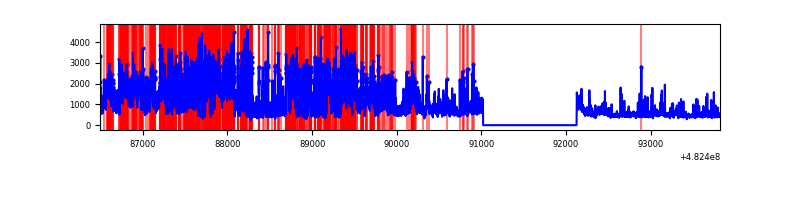 |
| C | 7324 | 6219 | 195 | 195 | 2.66% | 3.14% | 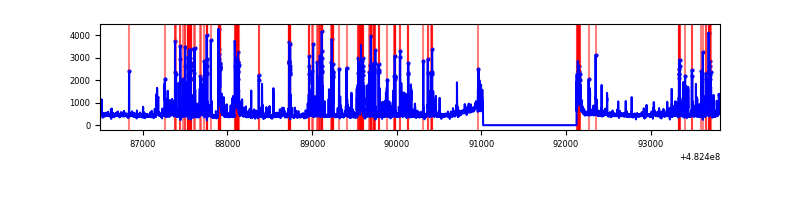 |
| D | 7324 | 6220 | 79 | 79 | 1.08% | 1.27% | 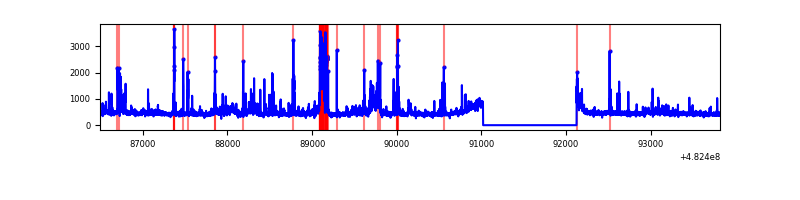 |
Top three noisy pixels from each quadrant. If the there are fewer than three noisy pixels in the level2.evt file, extra rows are filled as -1
| Pixel properties | Quadrant properties | ||||||
|---|---|---|---|---|---|---|---|
| Quadrant | DetID | PixID | Counts | Sigma | Mean | Median | Sigma |
| A | 7 | 64 | 1438061 | 8660.97 | 674 | 659 | 166.0 |
| A | 12 | 3 | 208044 | 1249.59 | 674 | 659 | 166.0 |
| A | 13 | 248 | 154109 | 924.6 | 674 | 659 | 166.0 |
| B | 10 | 44 | 3103796 | 22745.95 | 643 | 622 | 136.4 |
| B | 1 | 223 | 345547 | 2528.27 | 643 | 622 | 136.4 |
| B | 5 | 172 | 307161 | 2246.9 | 643 | 622 | 136.4 |
| C | 15 | 189 | 589961 | 3244.71 | 670 | 665 | 181.6 |
| C | 12 | 254 | 231429 | 1270.6 | 670 | 665 | 181.6 |
| C | 0 | 209 | 145337 | 796.57 | 670 | 665 | 181.6 |
| D | 3 | 12 | 186179 | 991.59 | 678 | 654 | 187.1 |
| D | 0 | 146 | 144813 | 770.5 | 678 | 654 | 187.1 |
| D | 8 | 176 | 132917 | 706.92 | 678 | 654 | 187.1 |
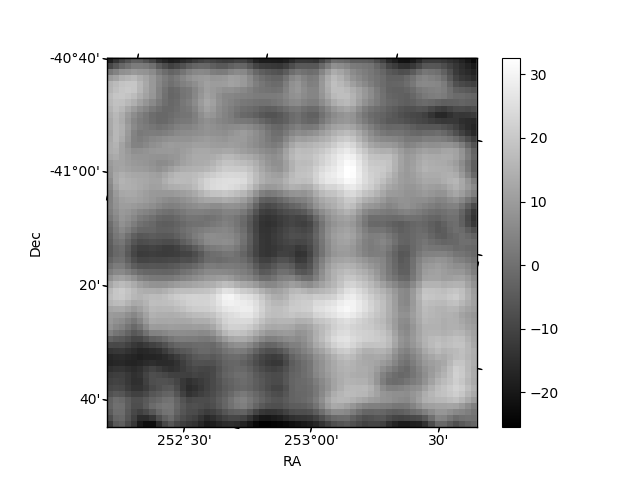
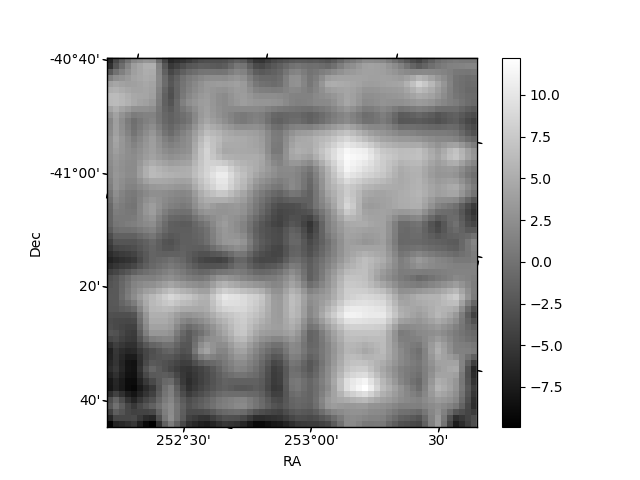
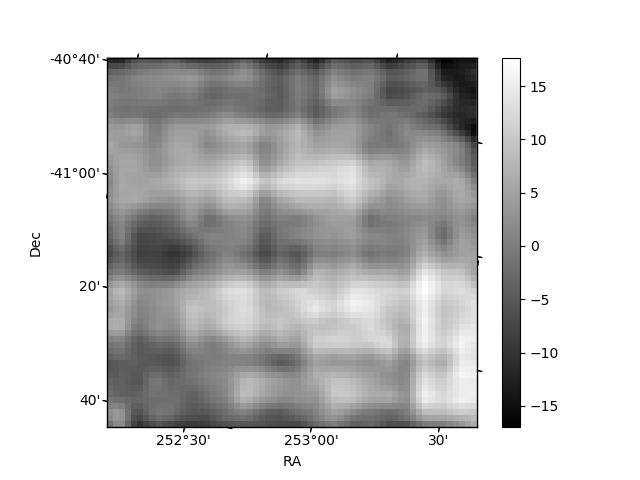
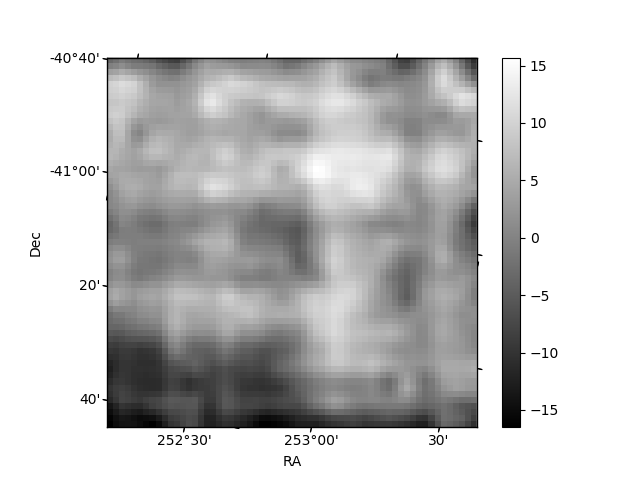
Histogram calculated using DETX and DETY for each event in the final _common_clean file
| Quadrant A | 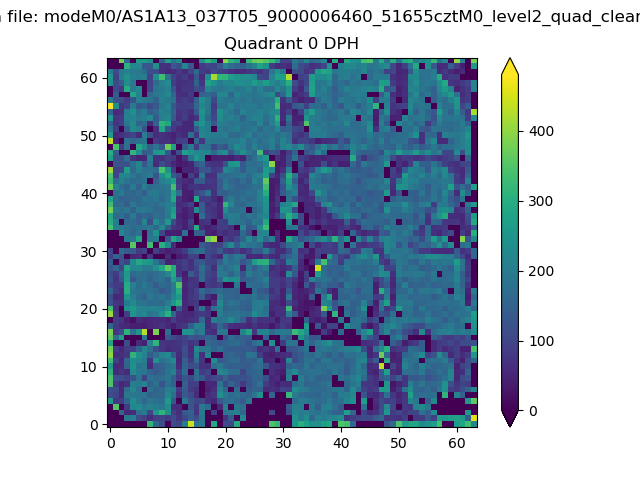 |
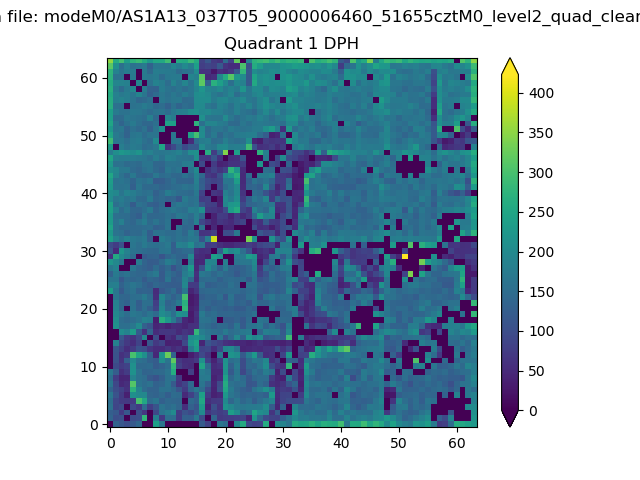 |
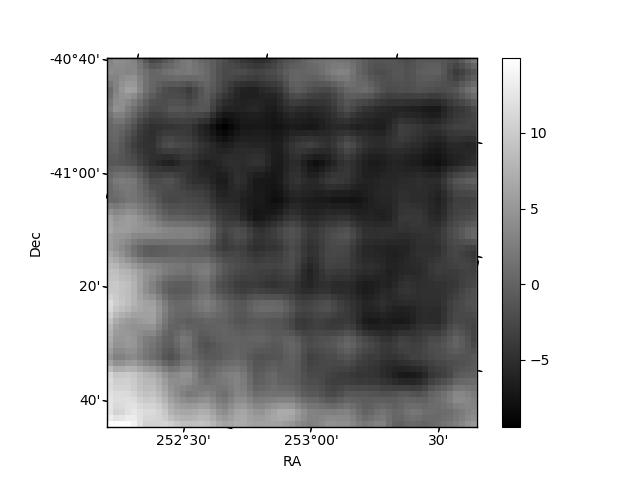
Quadrant B |
|---|---|---|---|
| Quadrant D | 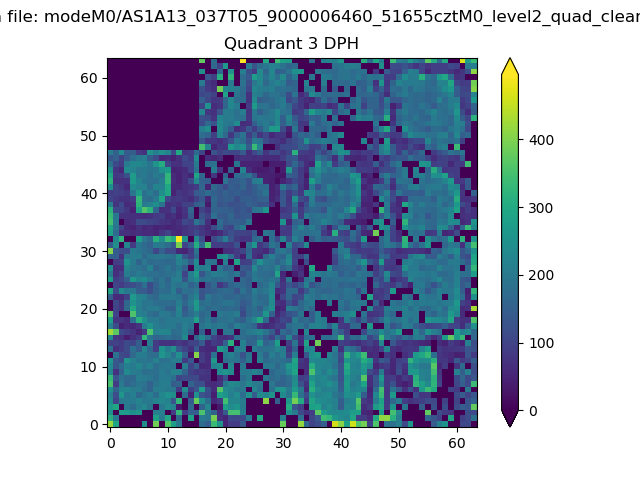 |
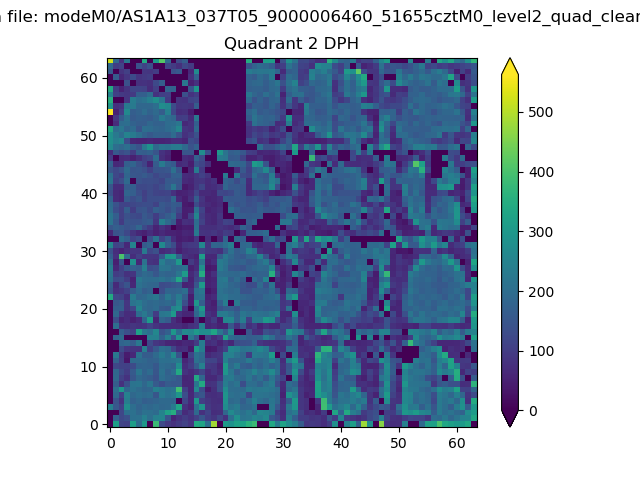 |
Quadrant C |
| Plot type | Count rate plots | Images |
|---|---|---|
| Comparison with Poisson distribution Blue bars denote a histogram of data divided into 1 sec bins. Red curve is a Poisson curve with rate = median count rate of data. |
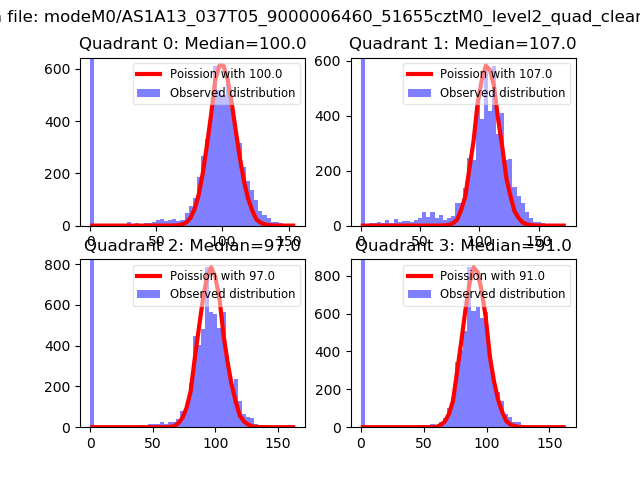 |
 |
| Quadrant-wise count rates Data is divided into 100 sec bins |
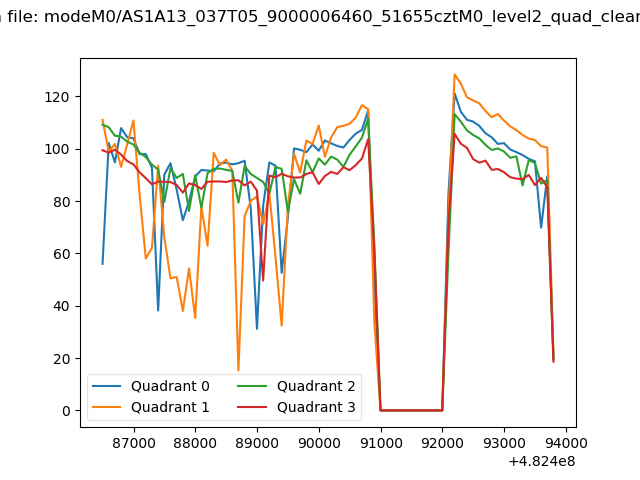 |
|
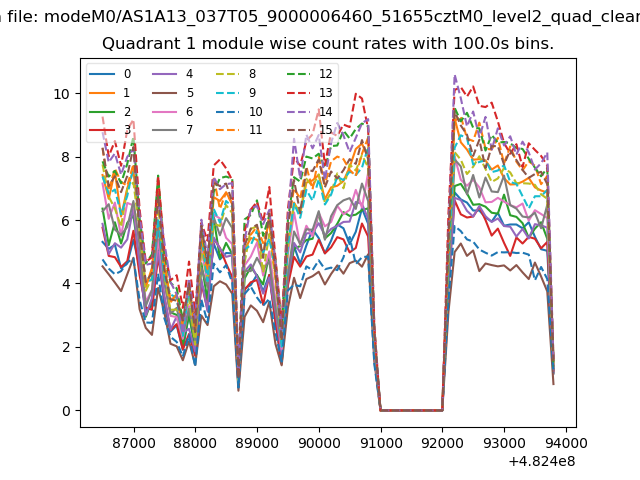
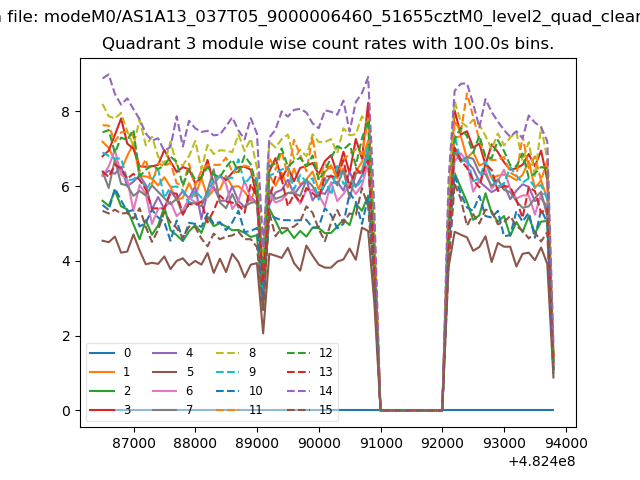
| Module-wise count rates for Quadrant A Data is divided into 100 sec bins |
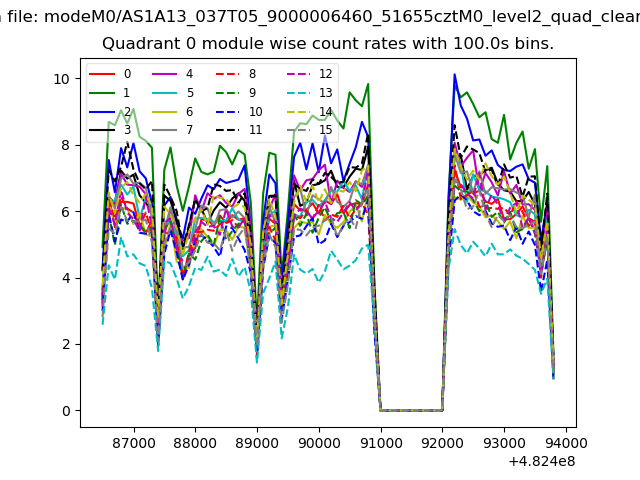 |
 |
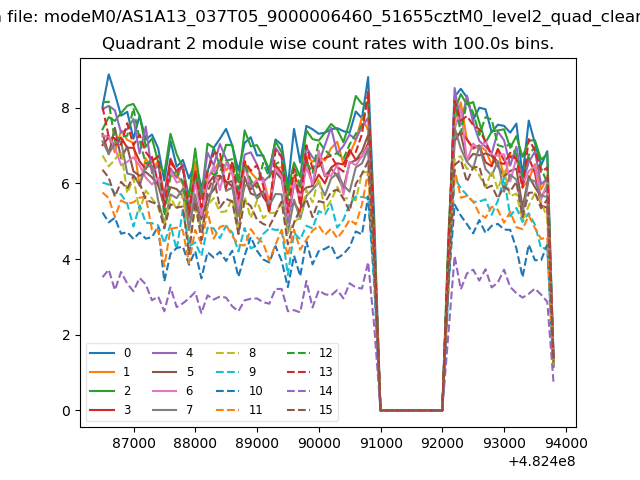
| Module-wise count rates for Quadrant B Data is divided into 100 sec bins |
 |
 |
| Module-wise count rates for Quadrant C Data is divided into 100 sec bins |
 |
 |
| Module-wise count rates for Quadrant D Data is divided into 100 sec bins |
 |
 |
| Parameter | Plot |
|---|---|
| CZT HV Monitor | 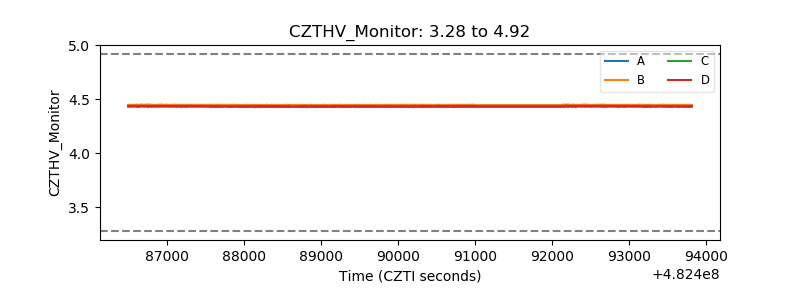 |
| D_VDD | 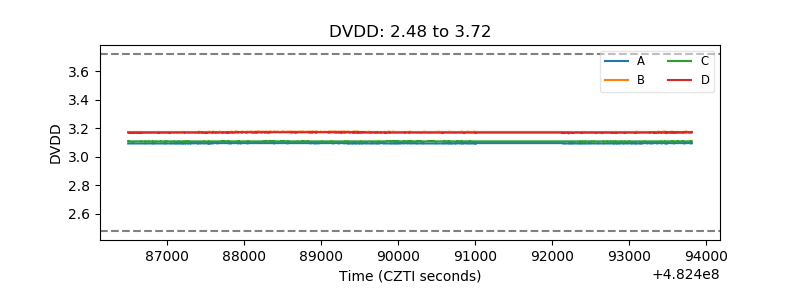 |
| Temperature 1 | 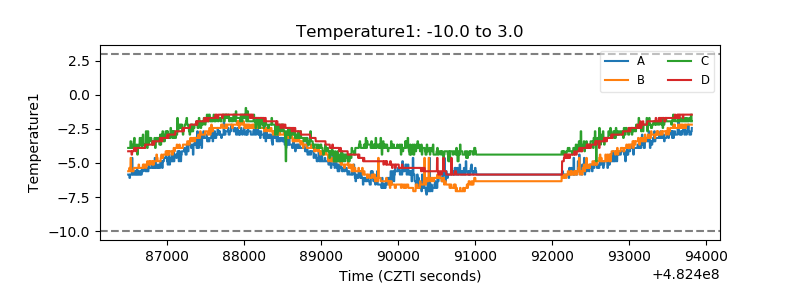 |
| Veto HV Monitor | 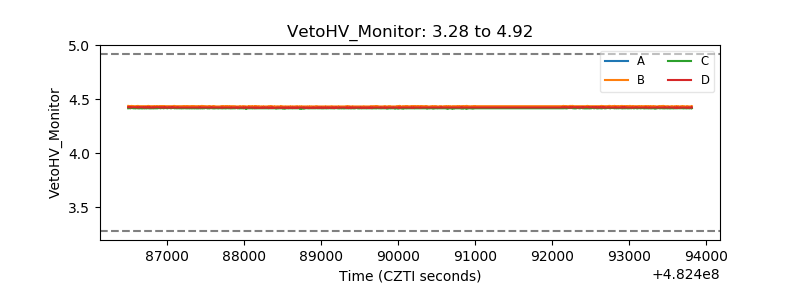 |
| Veto LLD | 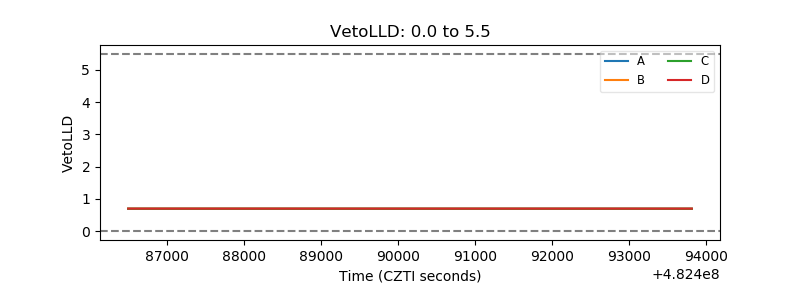 |
| Alpha Counter | 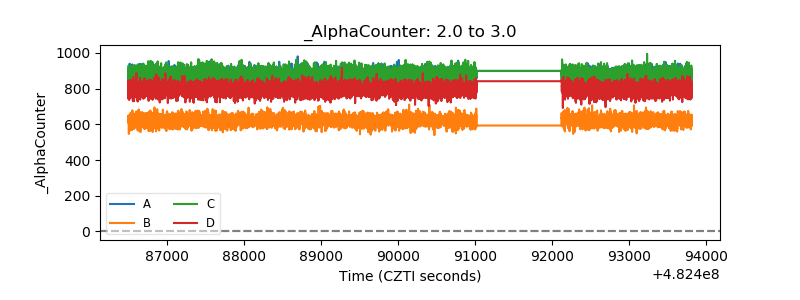 |
| _CPM_Rate | 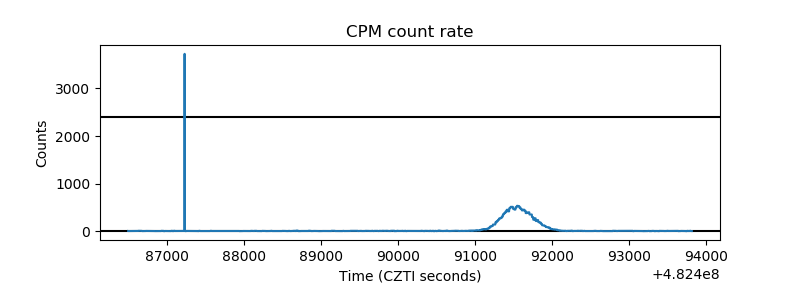 |
| CZT Counter | 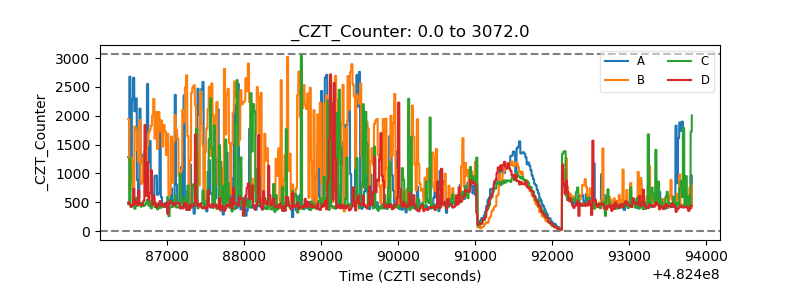 |
| +2.5 Volts monitor | 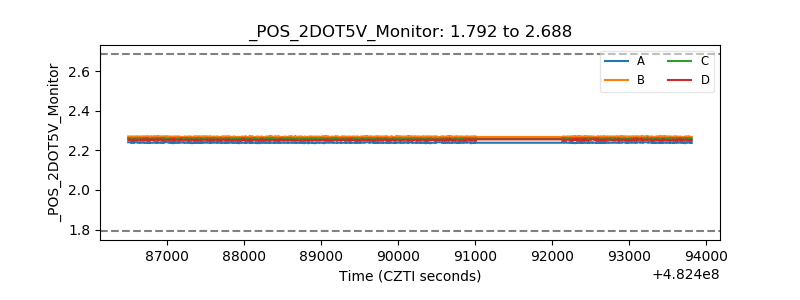 |
| +5 Volts monitor | 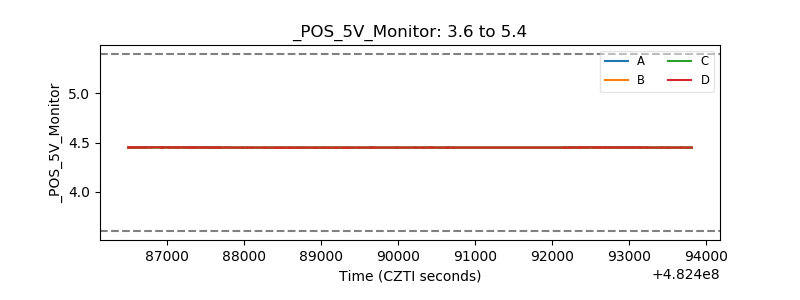 |
| _ROLL_ROT | 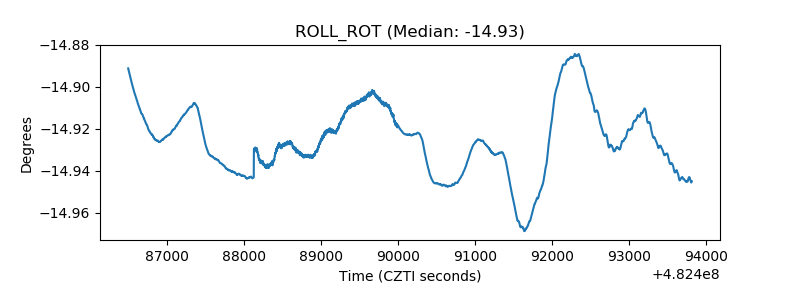 |
| _Roll_DEC | 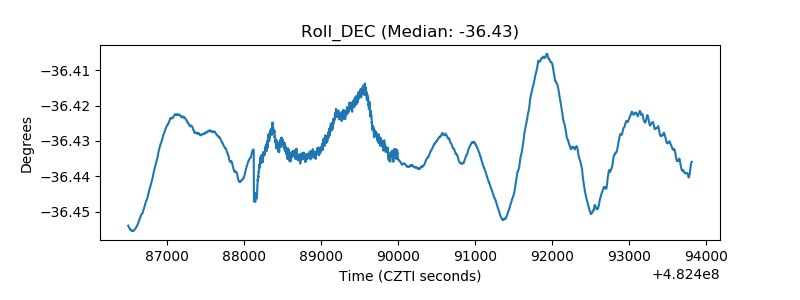 |
| _Roll_RA | 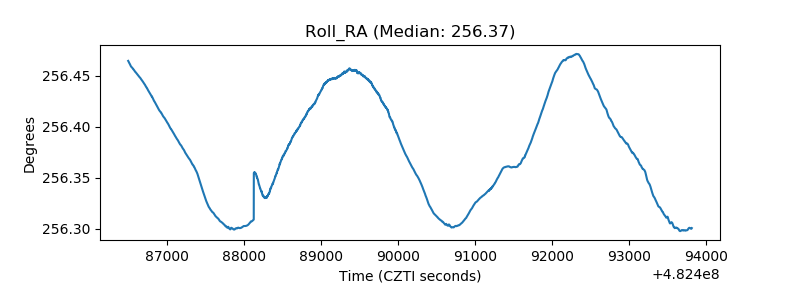 |
| Veto Counter | 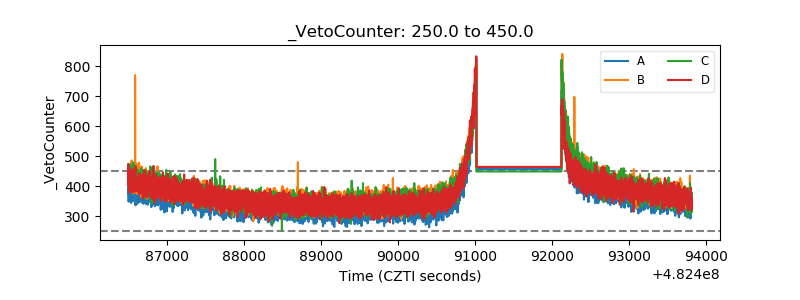 |