| Param | Original file | Final file |
|---|---|---|
| Filename | modeM0/AS1A13_037T05_9000006460_51656cztM0_level2.fits | modeM0/AS1A13_037T05_9000006460_51656cztM0_level2_quad_clean.evt |
| Size (bytes) | 489,415,680 | 95,489,280 |
| Size | 466.7 MB | 91.1 MB |
| Events in quadrant A | 4,293,798 | 623,589 |
| Events in quadrant B | 4,640,486 | 664,036 |
| Events in quadrant C | 4,799,306 | 584,262 |
| Events in quadrant D | 3,874,643 | 564,092 |
| Mode M9 | |||
|---|---|---|---|
| Quadrant | BADHDUFLAG | Total packets | Discarded packets |
| A | 0 | 11 | 0 |
| B | 0 | 11 | 0 |
| C | 0 | 11 | 0 |
| D | 0 | 11 | 0 |
| Mode M0 | |||
|---|---|---|---|
| Quadrant | BADHDUFLAG | Total packets | Discarded packets |
| A | 0 | 17276 | 1 |
| B | 0 | 18117 | 1 |
| C | 0 | 18770 | 1 |
| D | 0 | 16056 | 1 |
| Mode SS | |||
|---|---|---|---|
| Quadrant | BADHDUFLAG | Total packets | Discarded packets |
| A | 0 | 130 | 0 |
| B | 0 | 130 | 0 |
| C | 0 | 130 | 0 |
| D | 0 | 130 | 0 |
| Quadrant | Total seconds | Saturated seconds | Saturation percentage |
|---|---|---|---|
| A | 6538 | 326 | 4.986234% |
| B | 6539 | 485 | 7.417036% |
| C | 6539 | 600 | 9.175715% |
| D | 6539 | 320 | 4.893715% |
Noise dominated data is calculated using 1-second bins in cleaned event files. If a bin has >2000 counts, and if more than 50% of those come from <1% of pixels, then it is considered to be noise-dominated and hence unusable.
| Quadrant | # 1 sec bins | Bins with >0 counts | Bins with >2000 counts | High rate bins dominated by noise | Noise dominated (total time) | Noise dominated (detector-on time) | Marked lightcurve |
|---|---|---|---|---|---|---|---|
| A | 7543 | 6538 | 149 | 149 | 1.98% | 2.28% | 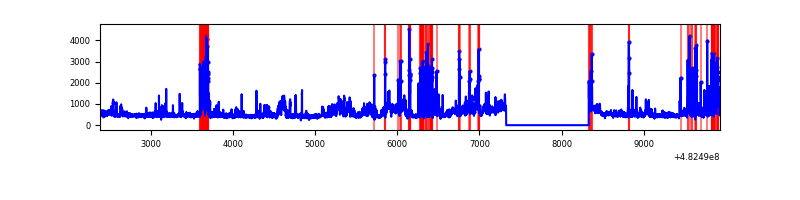 |
| B | 7544 | 6539 | 243 | 243 | 3.22% | 3.72% | 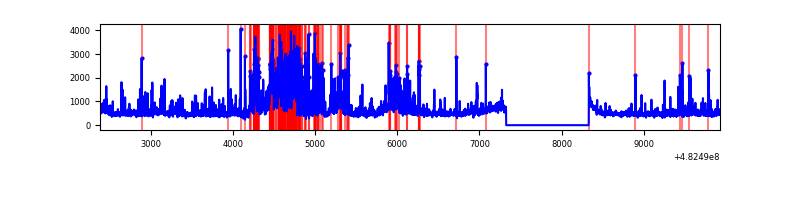 |
| C | 7544 | 6540 | 405 | 405 | 5.37% | 6.19% | 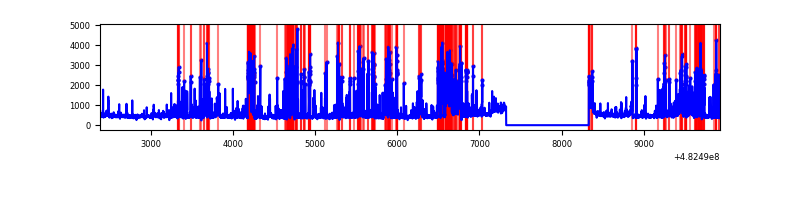 |
| D | 7544 | 6539 | 195 | 195 | 2.58% | 2.98% | 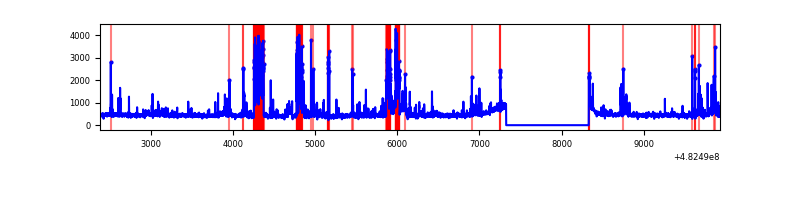 |
Top three noisy pixels from each quadrant. If the there are fewer than three noisy pixels in the level2.evt file, extra rows are filled as -1
| Pixel properties | Quadrant properties | ||||||
|---|---|---|---|---|---|---|---|
| Quadrant | DetID | PixID | Counts | Sigma | Mean | Median | Sigma |
| A | 12 | 3 | 541819 | 3055.93 | 725 | 707 | 177.1 |
| A | 7 | 64 | 434184 | 2448.06 | 725 | 707 | 177.1 |
| A | 13 | 248 | 177557 | 998.76 | 725 | 707 | 177.1 |
| B | 10 | 44 | 877314 | 5744.76 | 714 | 689 | 152.6 |
| B | 1 | 223 | 328947 | 2151.16 | 714 | 689 | 152.6 |
| B | 0 | 171 | 118301 | 770.74 | 714 | 689 | 152.6 |
| C | 15 | 189 | 882825 | 4681.66 | 695 | 691 | 188.4 |
| C | 12 | 254 | 575133 | 3048.68 | 695 | 691 | 188.4 |
| C | 13 | 3 | 178603 | 944.21 | 695 | 691 | 188.4 |
| D | 8 | 176 | 501606 | 2584.57 | 707 | 681 | 193.8 |
| D | 3 | 12 | 295729 | 1522.33 | 707 | 681 | 193.8 |
| D | 2 | 249 | 100006 | 512.48 | 707 | 681 | 193.8 |
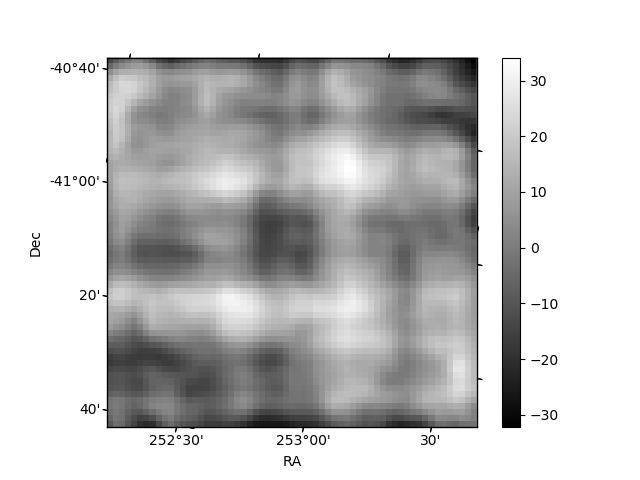
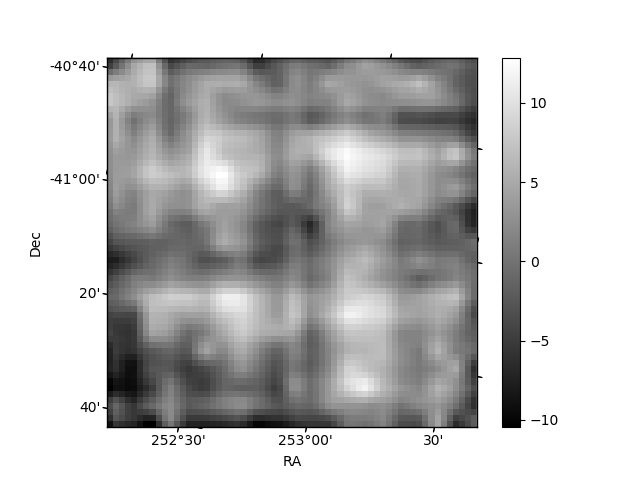
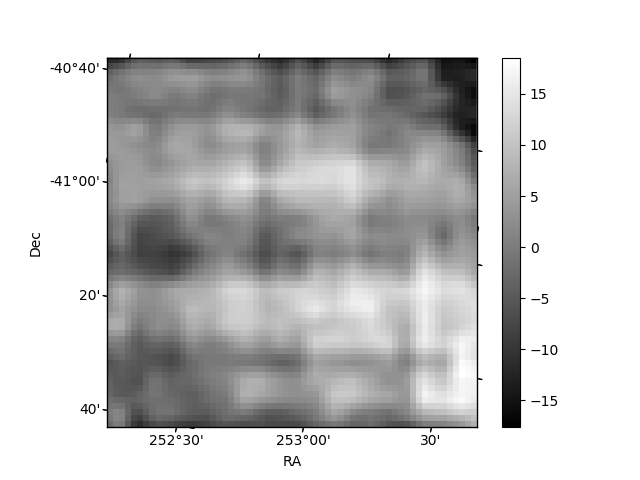
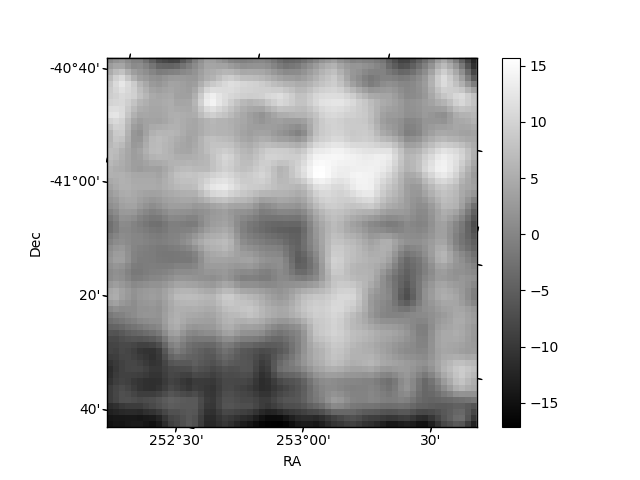
Histogram calculated using DETX and DETY for each event in the final _common_clean file
| Quadrant A | 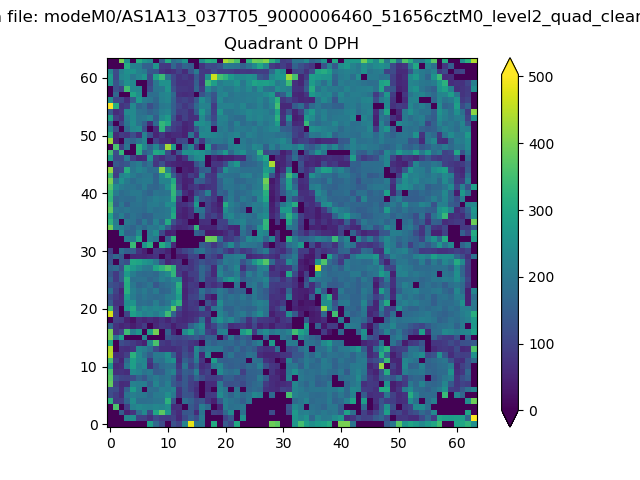 |
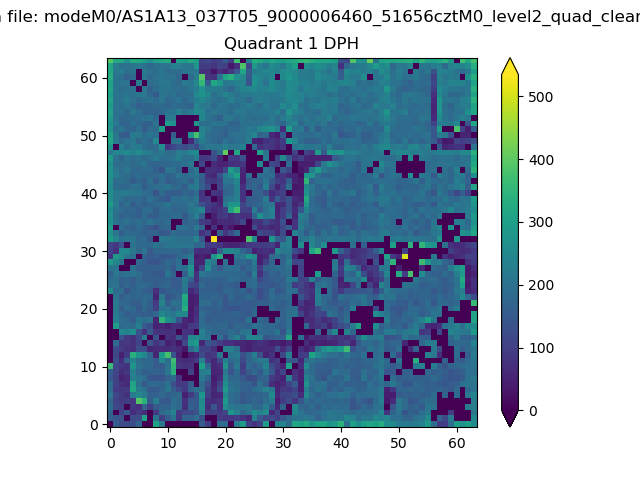 |
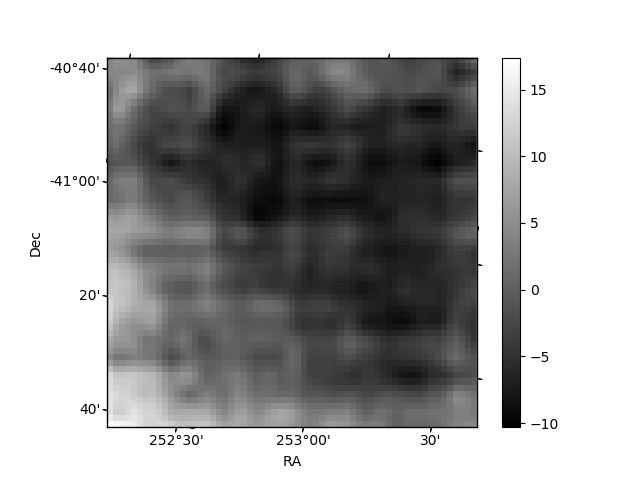
Quadrant B |
|---|---|---|---|
| Quadrant D | 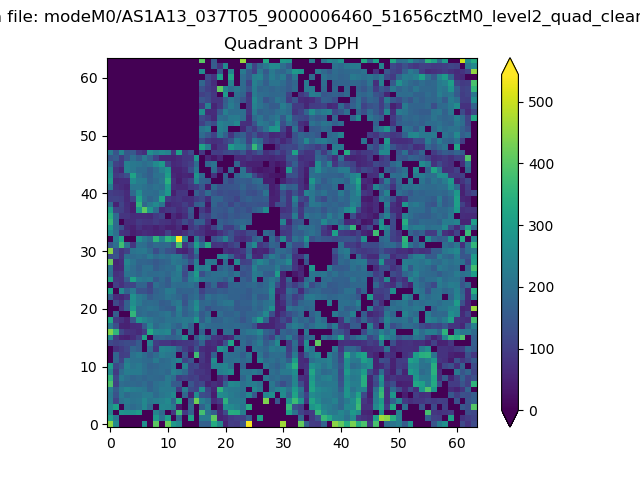 |
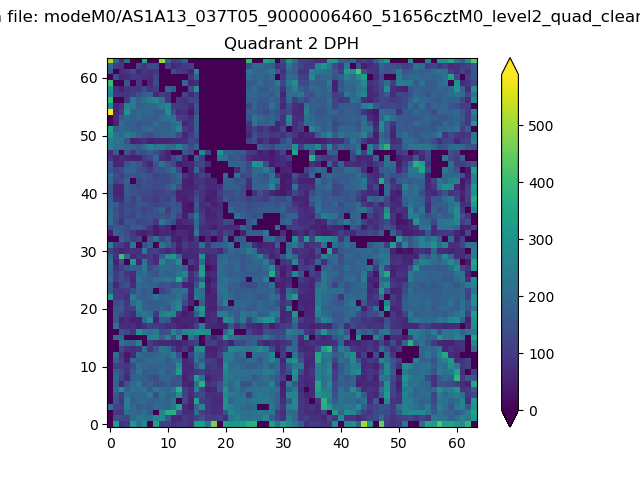 |
Quadrant C |
| Plot type | Count rate plots | Images |
|---|---|---|
| Comparison with Poisson distribution Blue bars denote a histogram of data divided into 1 sec bins. Red curve is a Poisson curve with rate = median count rate of data. |
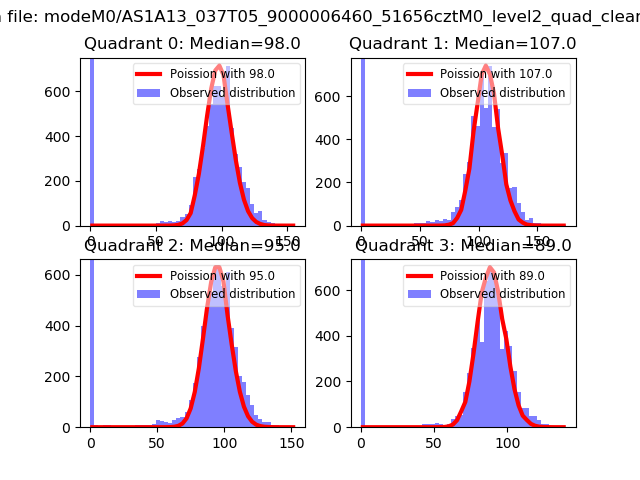 |
 |
| Quadrant-wise count rates Data is divided into 100 sec bins |
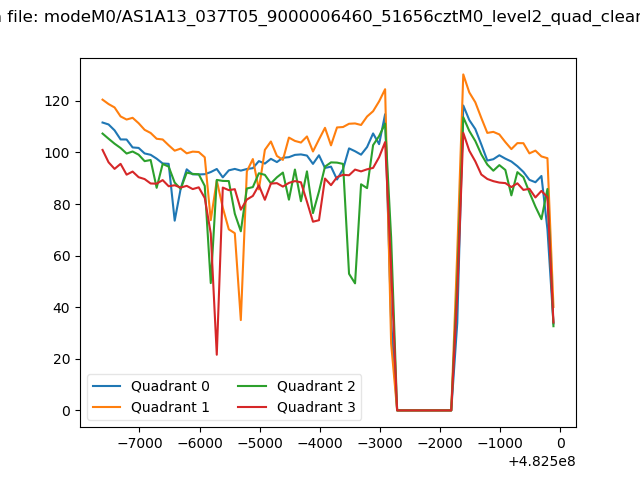 |
|
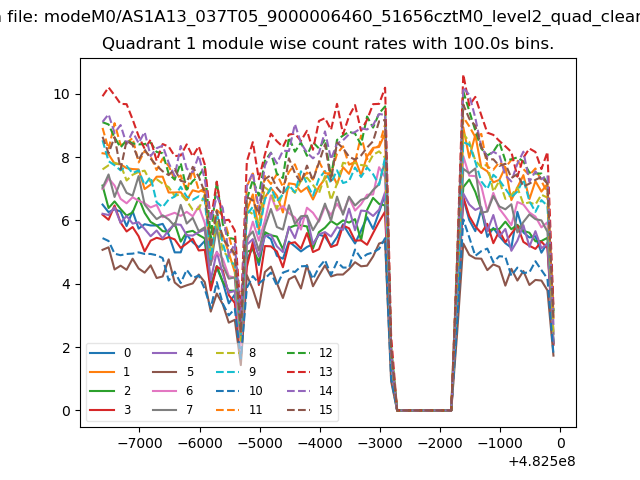
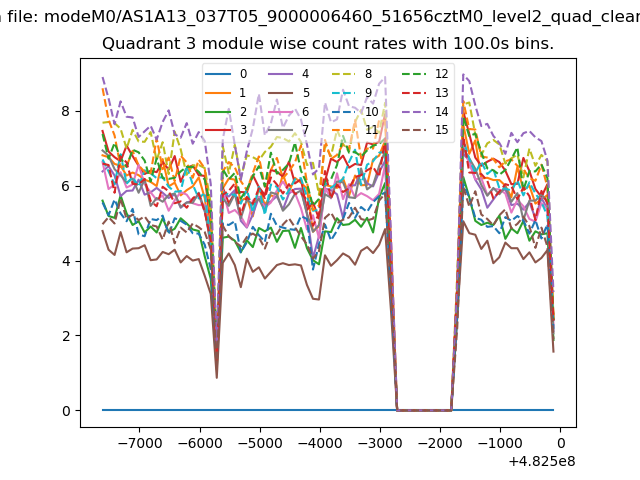
| Module-wise count rates for Quadrant A Data is divided into 100 sec bins |
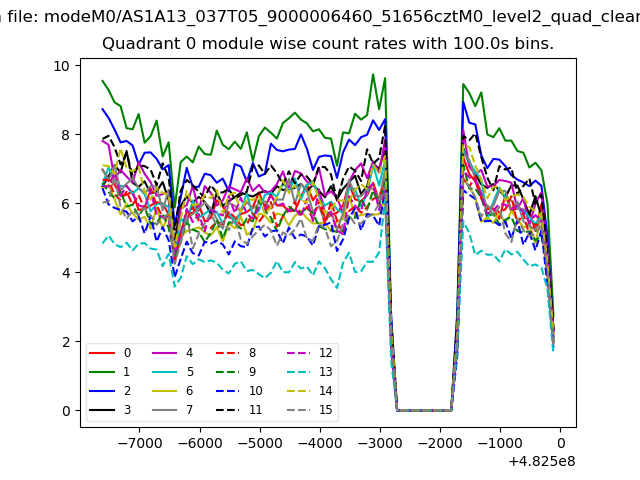 |
 |
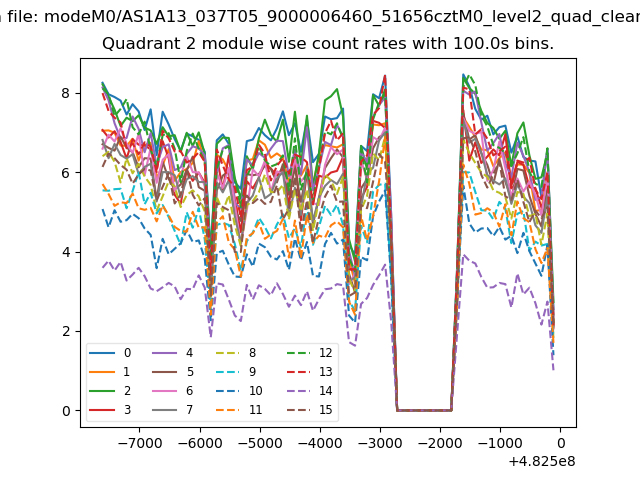
| Module-wise count rates for Quadrant B Data is divided into 100 sec bins |
 |
 |
| Module-wise count rates for Quadrant C Data is divided into 100 sec bins |
 |
 |
| Module-wise count rates for Quadrant D Data is divided into 100 sec bins |
 |
 |
| Parameter | Plot |
|---|---|
| CZT HV Monitor | 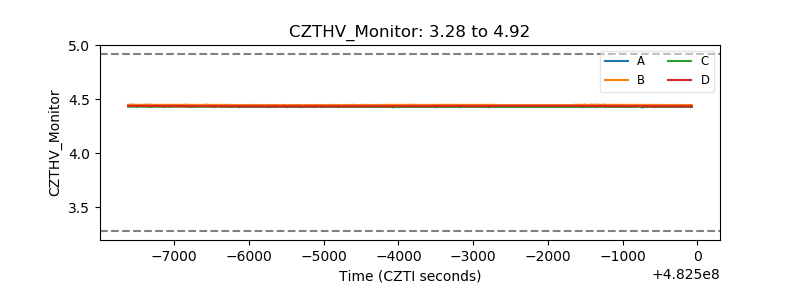 |
| D_VDD | 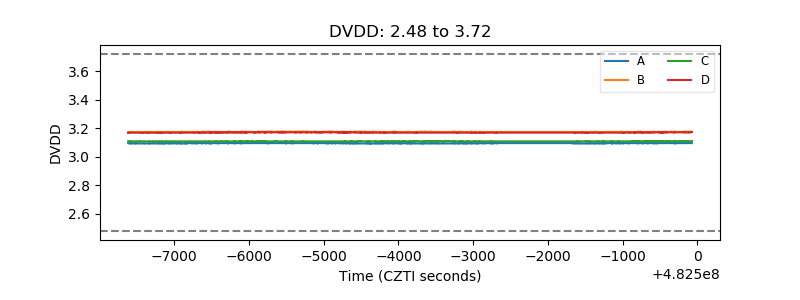 |
| Temperature 1 | 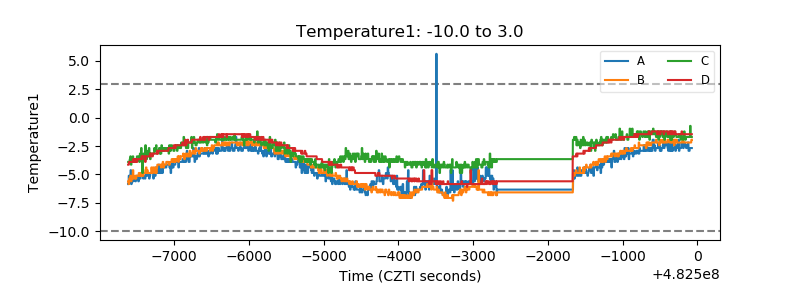 |
| Veto HV Monitor | 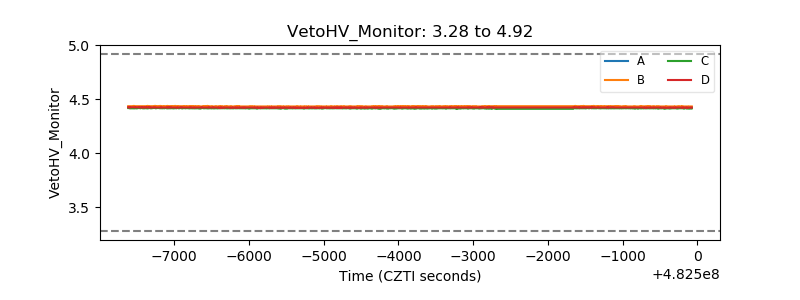 |
| Veto LLD | 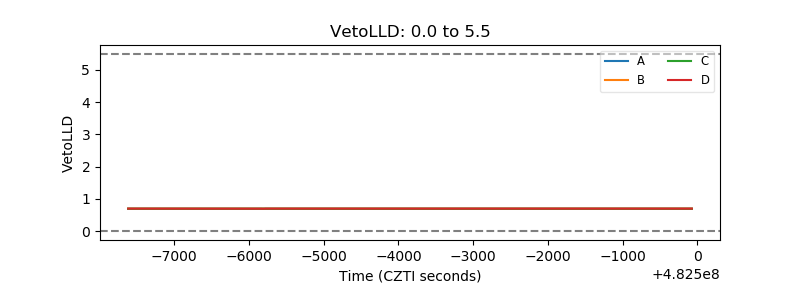 |
| Alpha Counter | 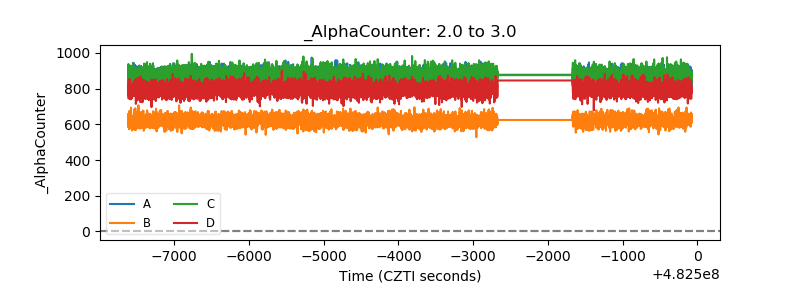 |
| _CPM_Rate | 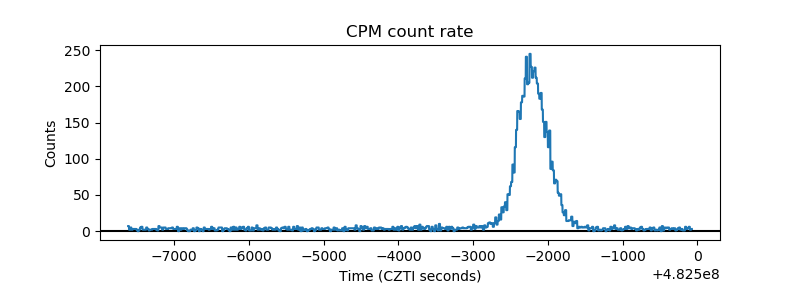 |
| CZT Counter | 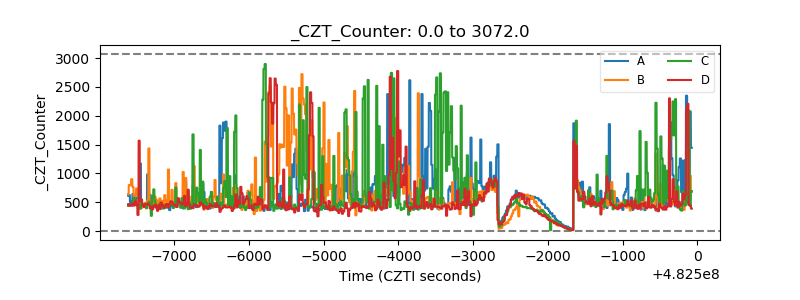 |
| +2.5 Volts monitor | 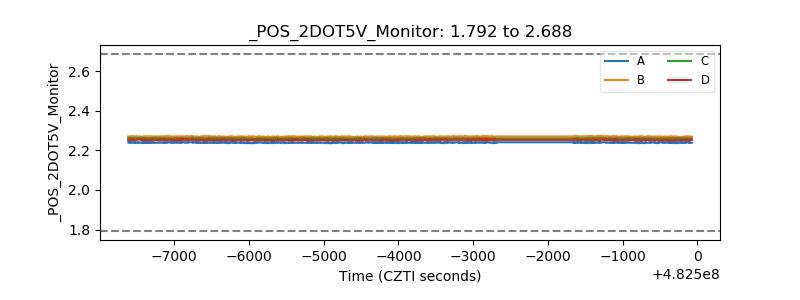 |
| +5 Volts monitor | 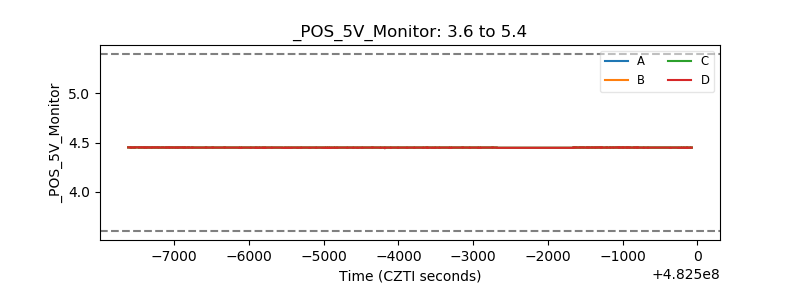 |
| _ROLL_ROT | 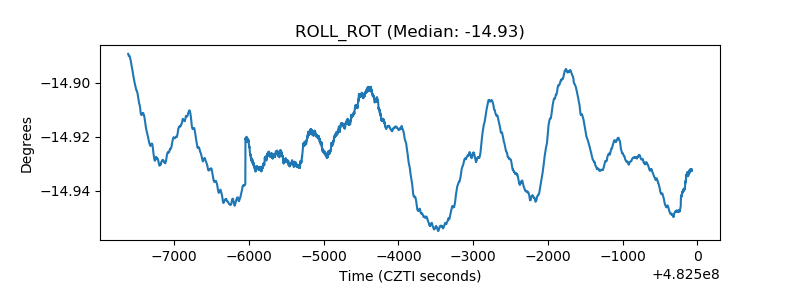 |
| _Roll_DEC | 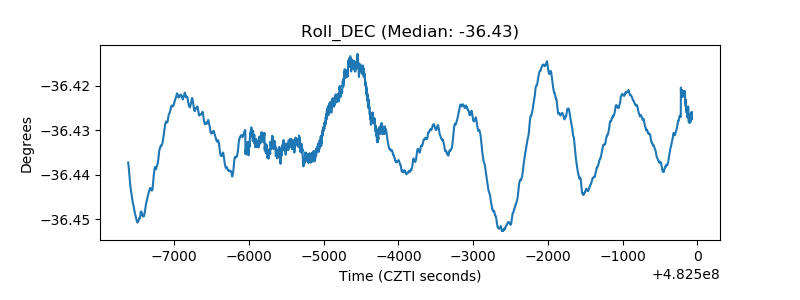 |
| _Roll_RA | 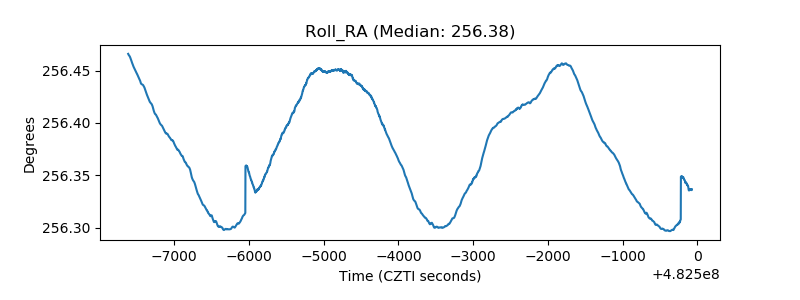 |
| Veto Counter | 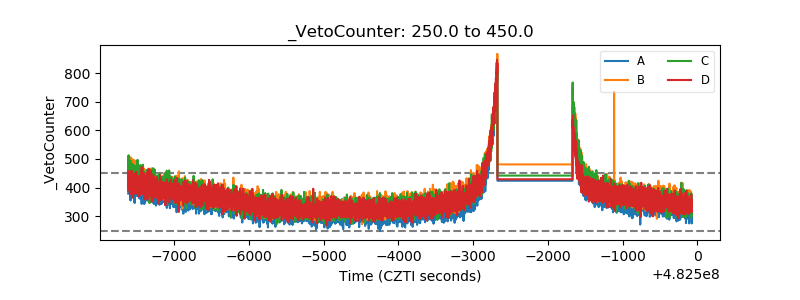 |