| Param | Original file | Final file |
|---|---|---|
| Filename | modeM0/AS1A13_037T05_9000006460_51657cztM0_level2.fits | modeM0/AS1A13_037T05_9000006460_51657cztM0_level2_quad_clean.evt |
| Size (bytes) | 568,336,320 | 104,074,560 |
| Size | 542.0 MB | 99.3 MB |
| Events in quadrant A | 6,726,256 | 628,554 |
| Events in quadrant B | 4,593,314 | 744,111 |
| Events in quadrant C | 5,273,376 | 641,796 |
| Events in quadrant D | 3,887,200 | 636,672 |
| Mode M9 | |||
|---|---|---|---|
| Quadrant | BADHDUFLAG | Total packets | Discarded packets |
| A | 0 | 15 | 0 |
| B | 0 | 16 | 0 |
| C | 0 | 16 | 0 |
| D | 0 | 16 | 0 |
| Mode M0 | |||
|---|---|---|---|
| Quadrant | BADHDUFLAG | Total packets | Discarded packets |
| A | 0 | 24943 | 2 |
| B | 0 | 18388 | 2 |
| C | 0 | 20605 | 2 |
| D | 0 | 16726 | 2 |
| Mode SS | |||
|---|---|---|---|
| Quadrant | BADHDUFLAG | Total packets | Discarded packets |
| A | 0 | 144 | 0 |
| B | 0 | 144 | 0 |
| C | 0 | 144 | 0 |
| D | 0 | 144 | 0 |
| Quadrant | Total seconds | Saturated seconds | Saturation percentage |
|---|---|---|---|
| A | 7191 | 972 | 13.516896% |
| B | 7190 | 289 | 4.019471% |
| C | 7190 | 572 | 7.955494% |
| D | 7190 | 176 | 2.447844% |
Noise dominated data is calculated using 1-second bins in cleaned event files. If a bin has >2000 counts, and if more than 50% of those come from <1% of pixels, then it is considered to be noise-dominated and hence unusable.
| Quadrant | # 1 sec bins | Bins with >0 counts | Bins with >2000 counts | High rate bins dominated by noise | Noise dominated (total time) | Noise dominated (detector-on time) | Marked lightcurve |
|---|---|---|---|---|---|---|---|
| A | 7971 | 7191 | 634 | 634 | 7.95% | 8.82% | 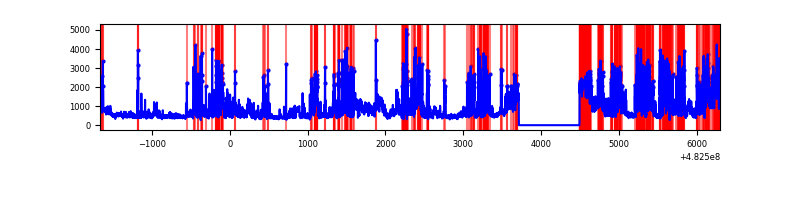 |
| B | 7970 | 7190 | 89 | 89 | 1.12% | 1.24% | 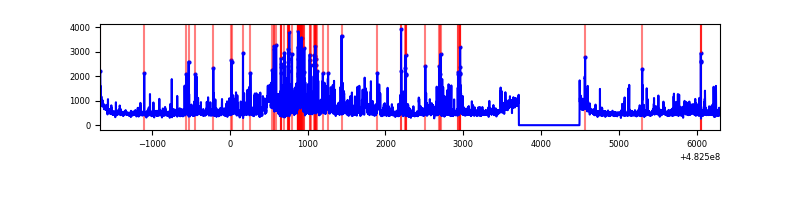 |
| C | 7970 | 7191 | 386 | 386 | 4.84% | 5.37% | 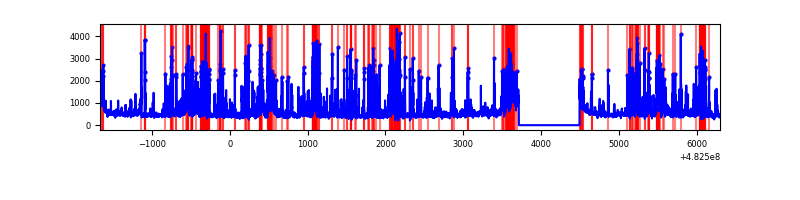 |
| D | 7970 | 7191 | 79 | 79 | 0.99% | 1.10% | 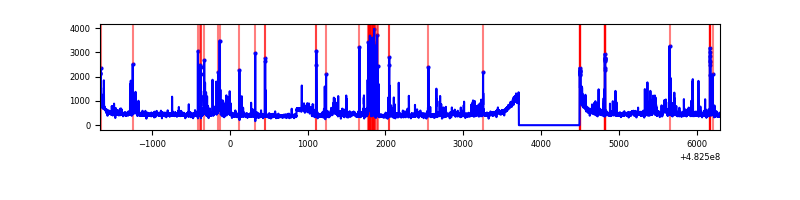 |
Top three noisy pixels from each quadrant. If the there are fewer than three noisy pixels in the level2.evt file, extra rows are filled as -1
| Pixel properties | Quadrant properties | ||||||
|---|---|---|---|---|---|---|---|
| Quadrant | DetID | PixID | Counts | Sigma | Mean | Median | Sigma |
| A | 7 | 64 | 2641226 | 14134.17 | 763 | 745 | 186.8 |
| A | 12 | 3 | 574635 | 3071.96 | 763 | 745 | 186.8 |
| A | 12 | 194 | 84037 | 445.85 | 763 | 745 | 186.8 |
| B | 1 | 223 | 184514 | 1066.55 | 799 | 771 | 172.3 |
| B | 0 | 171 | 168201 | 971.86 | 799 | 771 | 172.3 |
| B | 10 | 44 | 138127 | 797.3 | 799 | 771 | 172.3 |
| C | 15 | 189 | 1081956 | 5141.58 | 767 | 764 | 210.3 |
| C | 12 | 249 | 205887 | 975.46 | 767 | 764 | 210.3 |
| C | 12 | 254 | 192612 | 912.33 | 767 | 764 | 210.3 |
| D | 8 | 176 | 246619 | 1123.12 | 786 | 760 | 218.9 |
| D | 2 | 120 | 185313 | 843.06 | 786 | 760 | 218.9 |
| D | 2 | 249 | 86938 | 393.67 | 786 | 760 | 218.9 |
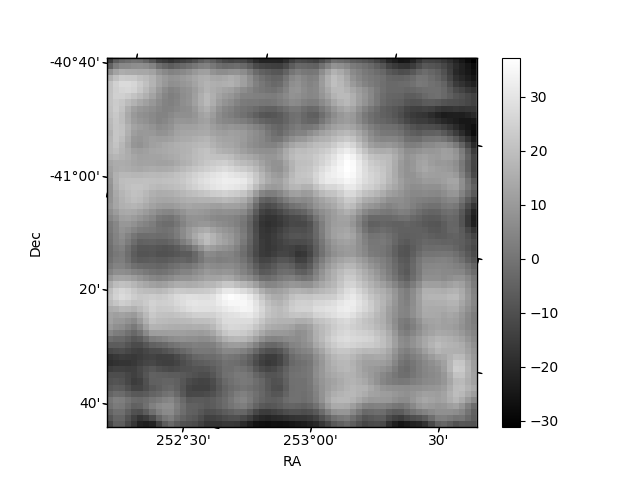
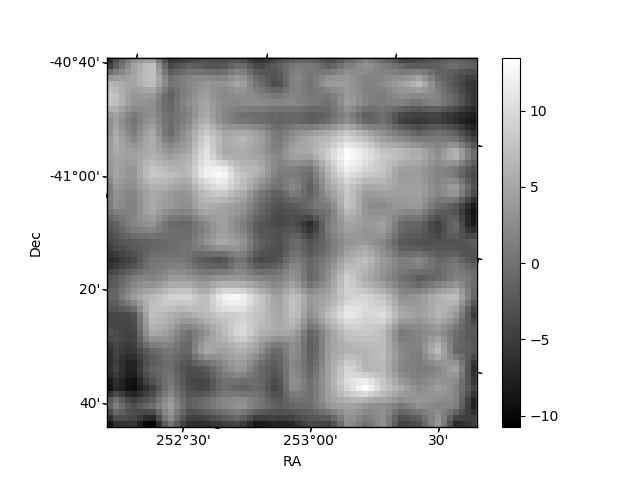
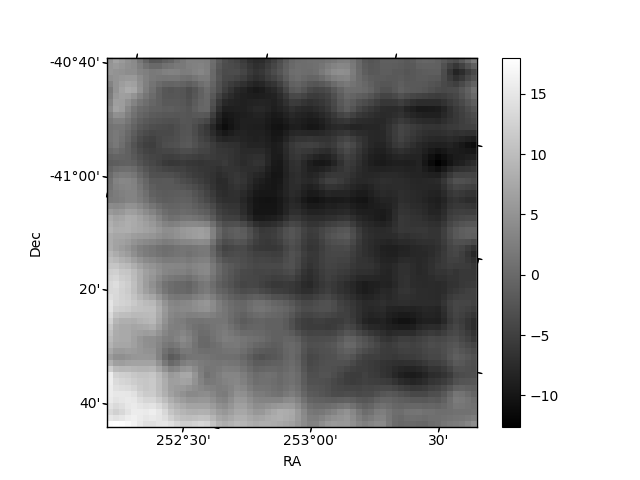
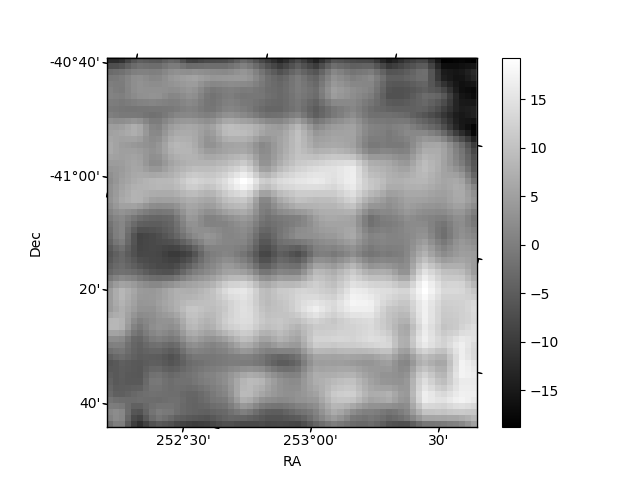
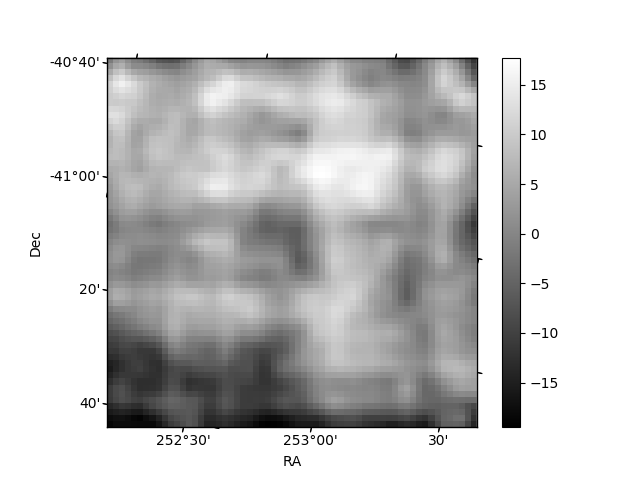
Histogram calculated using DETX and DETY for each event in the final _common_clean file
| Quadrant A | 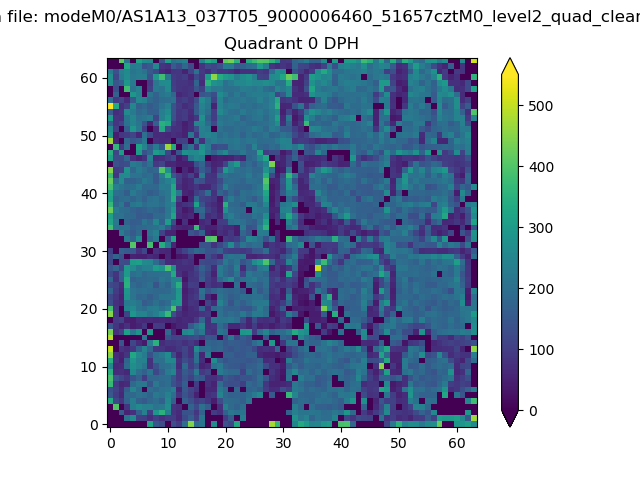 |
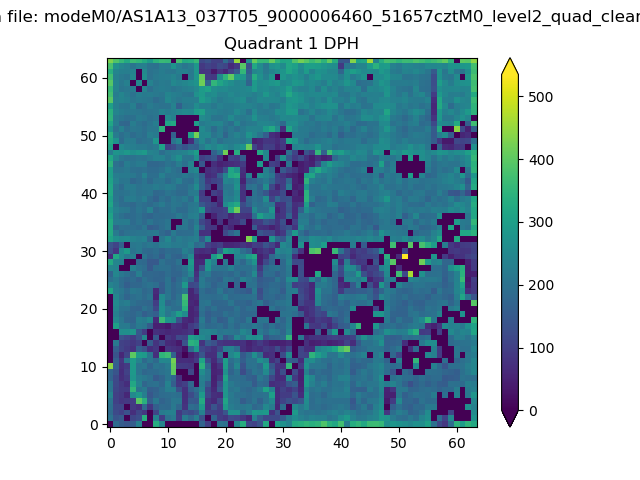 |
Quadrant B |
|---|---|---|---|
| Quadrant D | 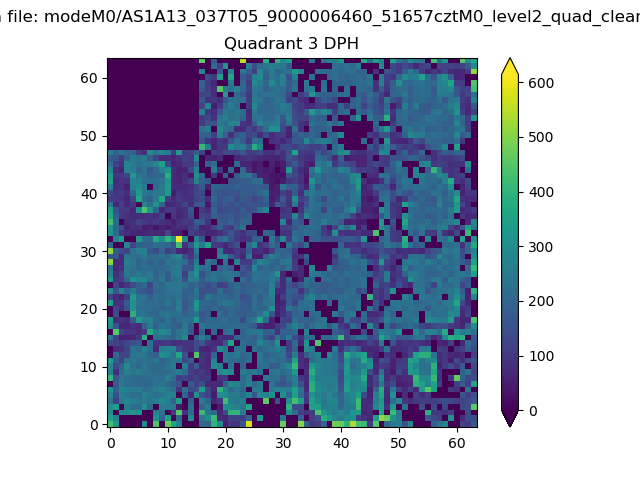 |
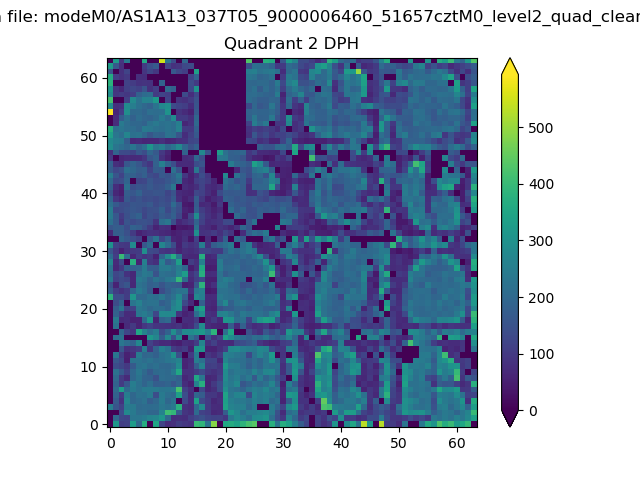 |
Quadrant C |
| Plot type | Count rate plots | Images |
|---|---|---|
| Comparison with Poisson distribution Blue bars denote a histogram of data divided into 1 sec bins. Red curve is a Poisson curve with rate = median count rate of data. |
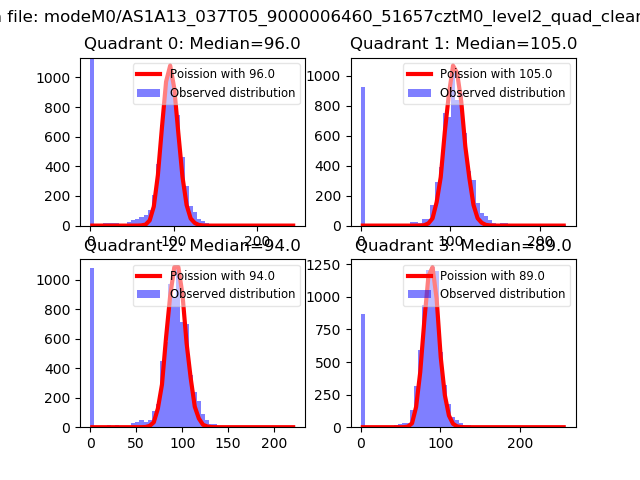 |
 |
| Quadrant-wise count rates Data is divided into 100 sec bins |
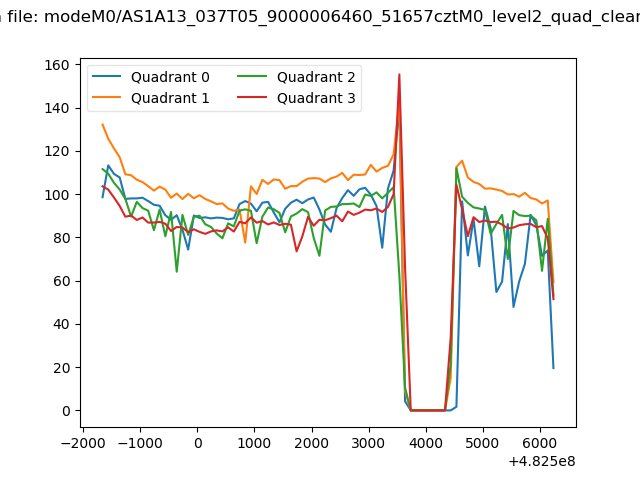 |
|
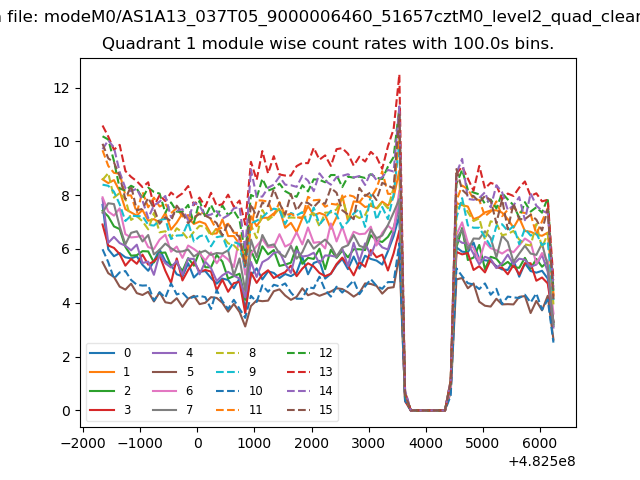
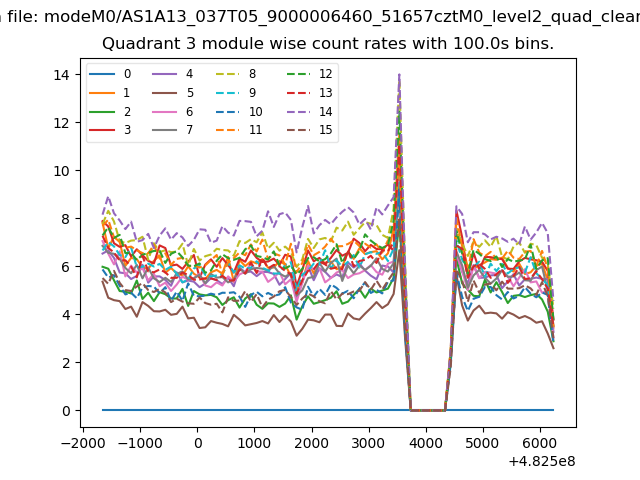
| Module-wise count rates for Quadrant A Data is divided into 100 sec bins |
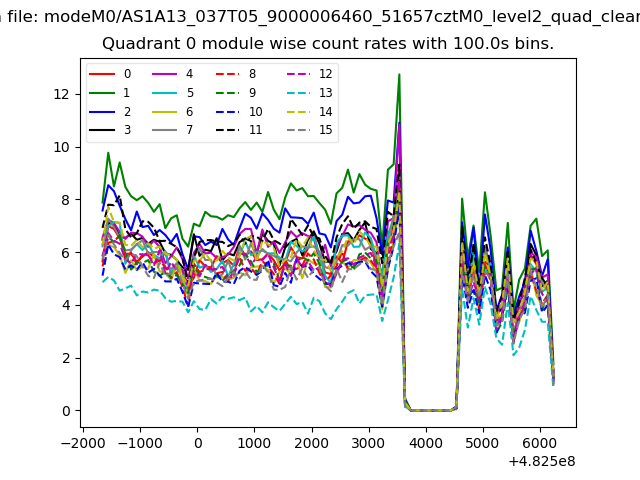 |
 |
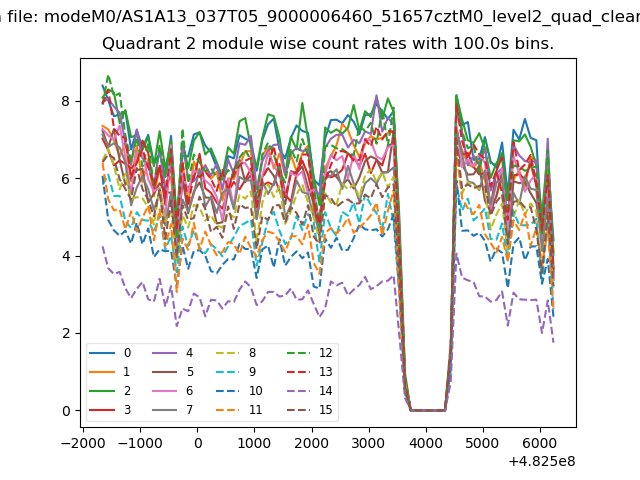
| Module-wise count rates for Quadrant B Data is divided into 100 sec bins |
 |
 |
| Module-wise count rates for Quadrant C Data is divided into 100 sec bins |
 |
 |
| Module-wise count rates for Quadrant D Data is divided into 100 sec bins |
 |
 |
| Parameter | Plot |
|---|---|
| CZT HV Monitor | 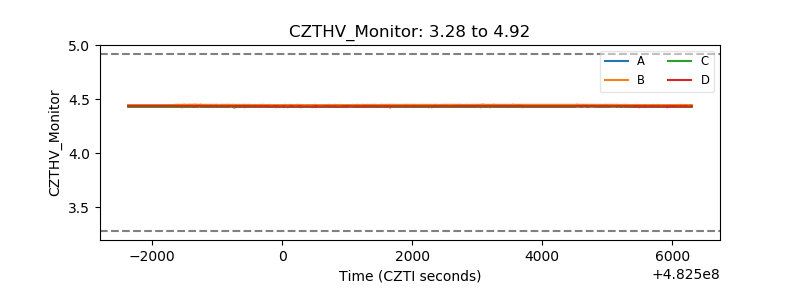 |
| D_VDD | 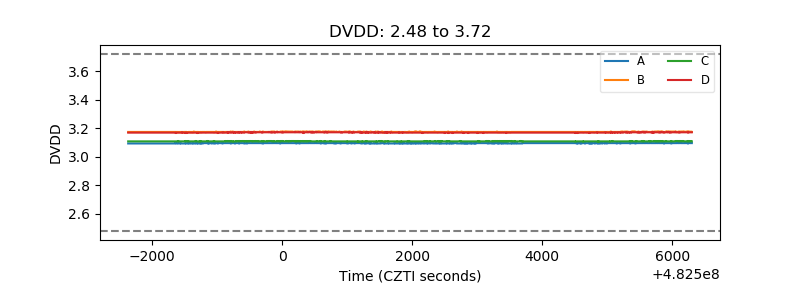 |
| Temperature 1 | 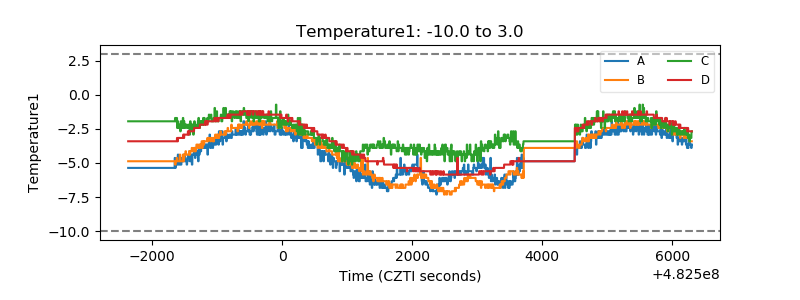 |
| Veto HV Monitor | 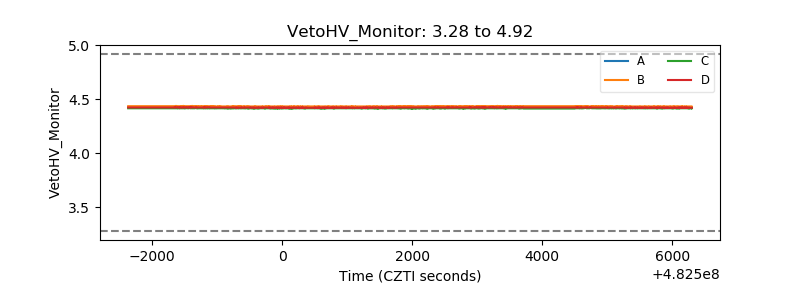 |
| Veto LLD | 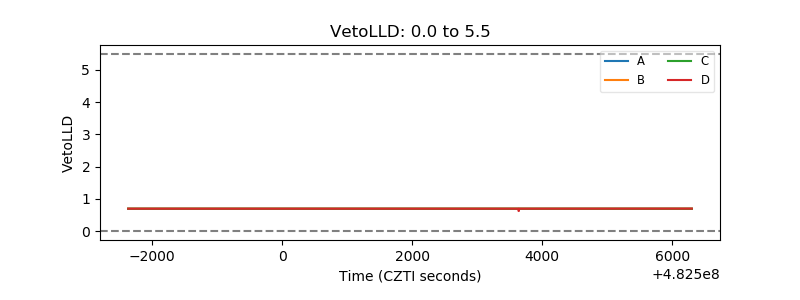 |
| Alpha Counter | 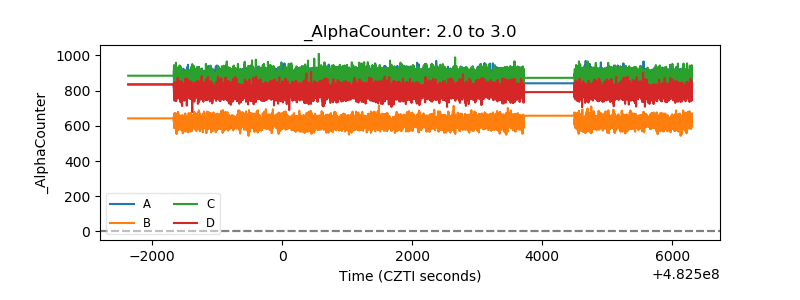 |
| _CPM_Rate |  |
| CZT Counter | 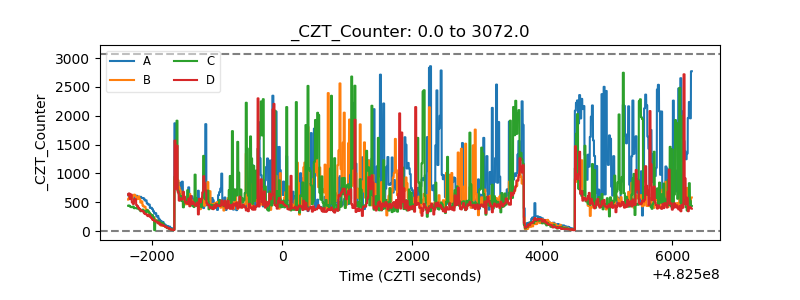 |
| +2.5 Volts monitor | 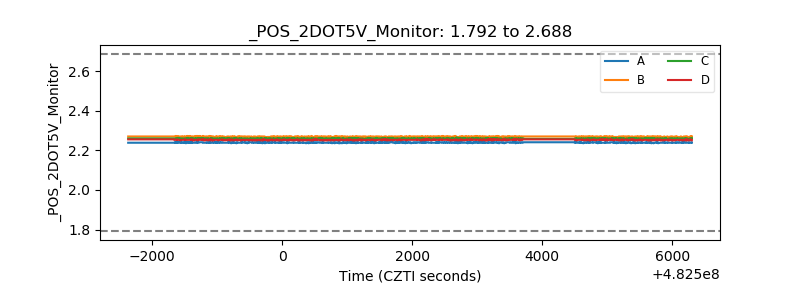 |
| +5 Volts monitor | 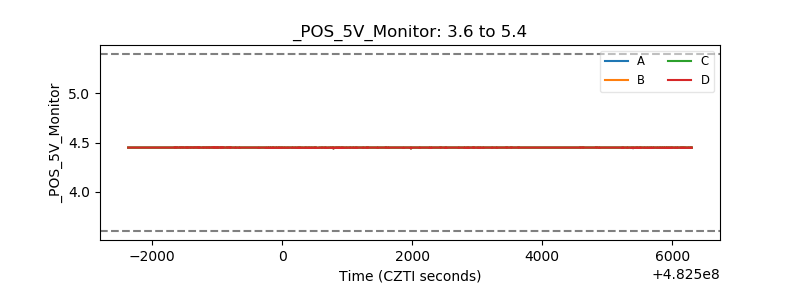 |
| _ROLL_ROT | 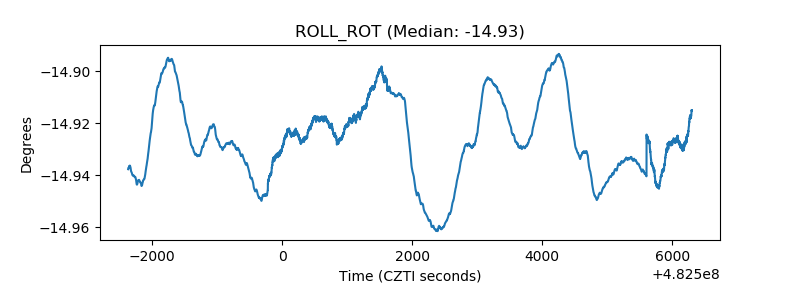 |
| _Roll_DEC | 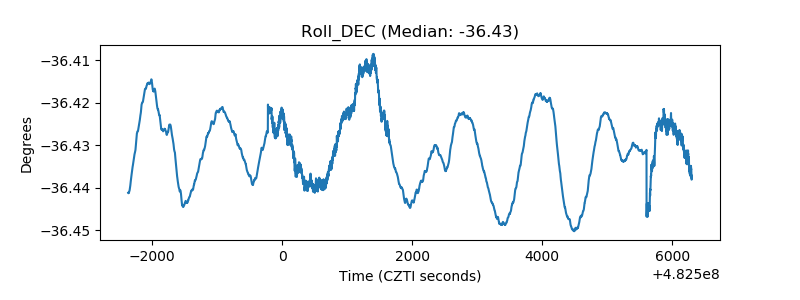 |
| _Roll_RA | 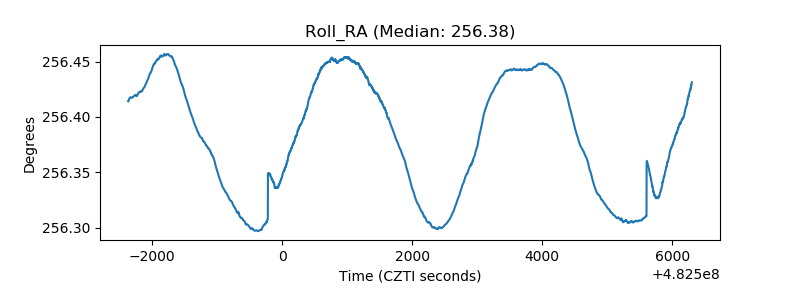 |
| Veto Counter | 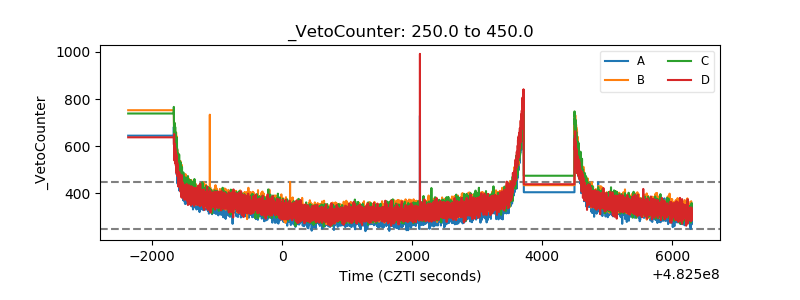 |