| Param | Original file | Final file |
|---|---|---|
| Filename | modeM0/AS1A13_037T05_9000006460_51659cztM0_level2.fits | modeM0/AS1A13_037T05_9000006460_51659cztM0_level2_quad_clean.evt |
| Size (bytes) | 718,698,240 | 103,423,680 |
| Size | 685.4 MB | 98.6 MB |
| Events in quadrant A | 8,288,844 | 617,574 |
| Events in quadrant B | 4,624,430 | 754,377 |
| Events in quadrant C | 6,943,890 | 639,795 |
| Events in quadrant D | 6,173,915 | 605,467 |
| Mode M9 | |||
|---|---|---|---|
| Quadrant | BADHDUFLAG | Total packets | Discarded packets |
| A | 0 | 6 | 0 |
| B | 0 | 7 | 0 |
| C | 0 | 7 | 0 |
| D | 0 | 7 | 0 |
| Mode M0 | |||
|---|---|---|---|
| Quadrant | BADHDUFLAG | Total packets | Discarded packets |
| A | 0 | 29747 | 2 |
| B | 0 | 18712 | 2 |
| C | 0 | 25708 | 2 |
| D | 0 | 23522 | 5 |
| Mode SS | |||
|---|---|---|---|
| Quadrant | BADHDUFLAG | Total packets | Discarded packets |
| A | 0 | 148 | 0 |
| B | 0 | 148 | 0 |
| C | 0 | 148 | 0 |
| D | 0 | 148 | 0 |
| Quadrant | Total seconds | Saturated seconds | Saturation percentage |
|---|---|---|---|
| A | 7389 | 1730 | 23.413182% |
| B | 7389 | 637 | 8.620923% |
| C | 7389 | 1169 | 15.820815% |
| D | 7387 | 943 | 12.765669% |
Noise dominated data is calculated using 1-second bins in cleaned event files. If a bin has >2000 counts, and if more than 50% of those come from <1% of pixels, then it is considered to be noise-dominated and hence unusable.
| Quadrant | # 1 sec bins | Bins with >0 counts | Bins with >2000 counts | High rate bins dominated by noise | Noise dominated (total time) | Noise dominated (detector-on time) | Marked lightcurve |
|---|---|---|---|---|---|---|---|
| A | 7403 | 7389 | 1073 | 1073 | 14.49% | 14.52% | 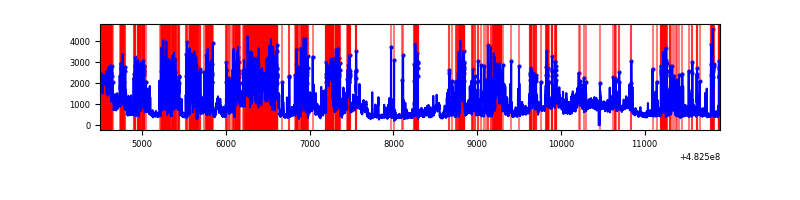 |
| B | 7404 | 7390 | 111 | 111 | 1.50% | 1.50% | 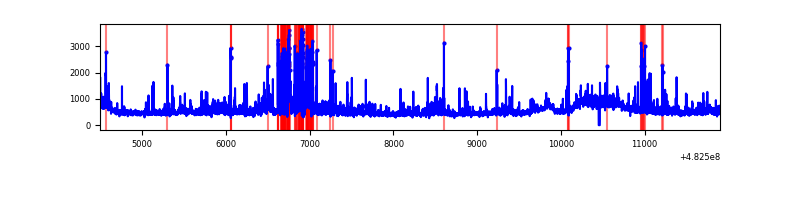 |
| C | 7404 | 7390 | 756 | 756 | 10.21% | 10.23% | 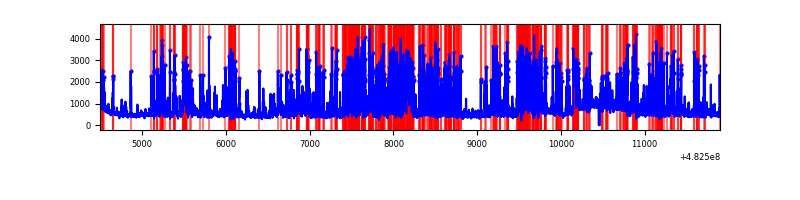 |
| D | 7404 | 7388 | 812 | 812 | 10.97% | 10.99% | 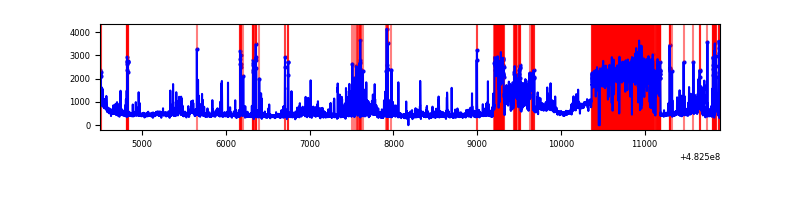 |
Top three noisy pixels from each quadrant. If the there are fewer than three noisy pixels in the level2.evt file, extra rows are filled as -1
| Pixel properties | Quadrant properties | ||||||
|---|---|---|---|---|---|---|---|
| Quadrant | DetID | PixID | Counts | Sigma | Mean | Median | Sigma |
| A | 7 | 64 | 3653962 | 18047.87 | 817 | 796 | 202.4 |
| A | 12 | 3 | 610241 | 3010.86 | 817 | 796 | 202.4 |
| A | 13 | 248 | 384813 | 1897.17 | 817 | 796 | 202.4 |
| B | 1 | 223 | 348728 | 1854.92 | 863 | 830 | 187.6 |
| B | 5 | 32 | 92592 | 489.26 | 863 | 830 | 187.6 |
| B | 7 | 252 | 89195 | 471.14 | 863 | 830 | 187.6 |
| C | 15 | 189 | 1544856 | 6903.64 | 816 | 810 | 223.7 |
| C | 12 | 254 | 1137767 | 5083.49 | 816 | 810 | 223.7 |
| C | 14 | 245 | 394625 | 1760.8 | 816 | 810 | 223.7 |
| D | 10 | 172 | 2001538 | 9000.57 | 795 | 767 | 222.3 |
| D | 8 | 176 | 384926 | 1728.16 | 795 | 767 | 222.3 |
| D | 2 | 249 | 176037 | 788.46 | 795 | 767 | 222.3 |
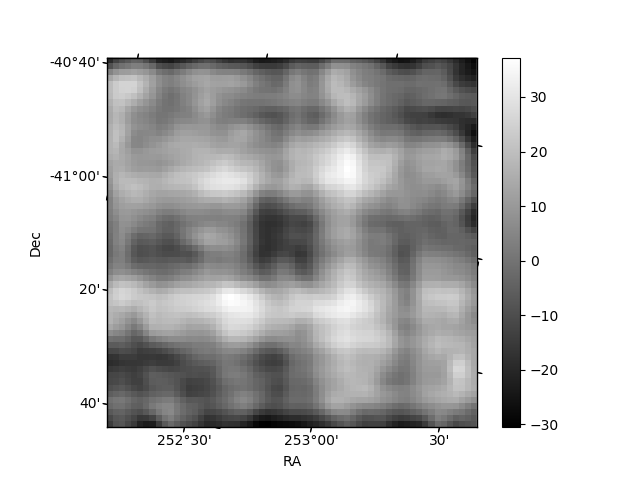
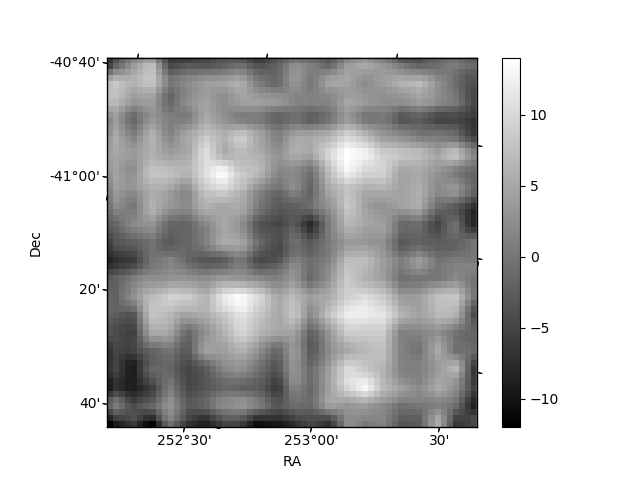
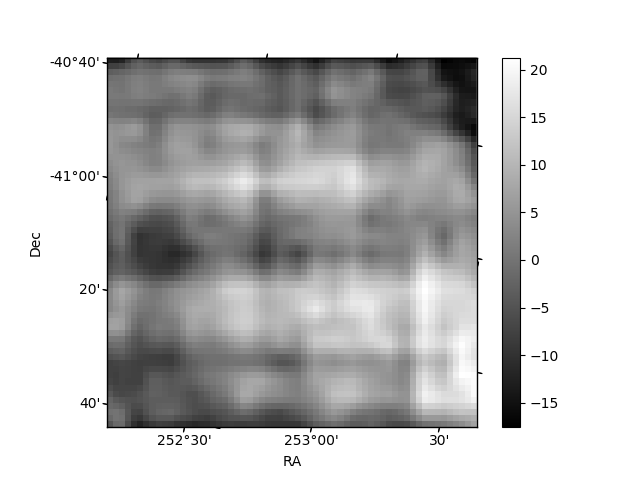
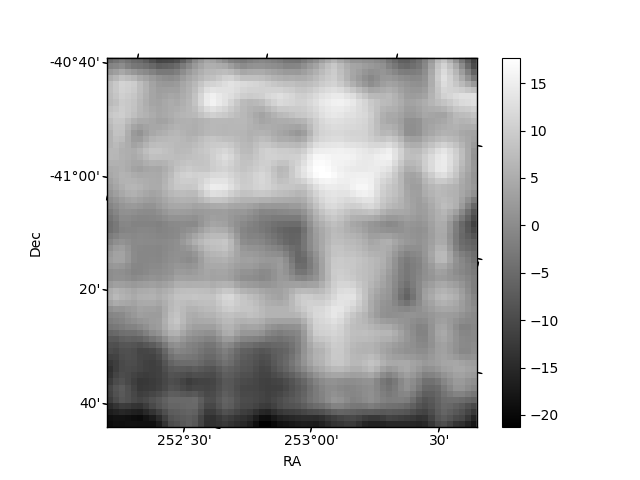
Histogram calculated using DETX and DETY for each event in the final _common_clean file
| Quadrant A | 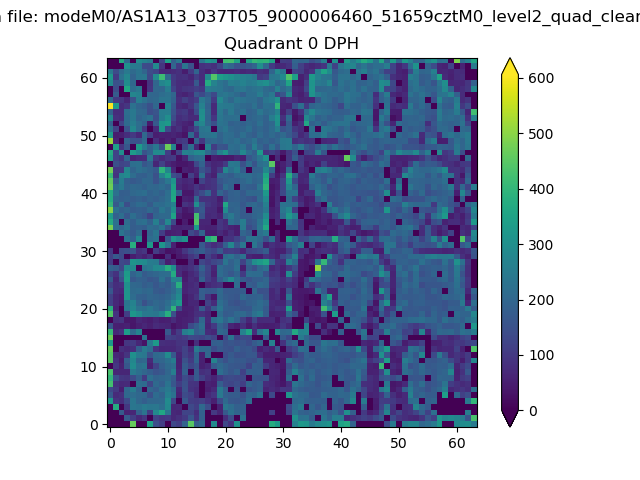 |
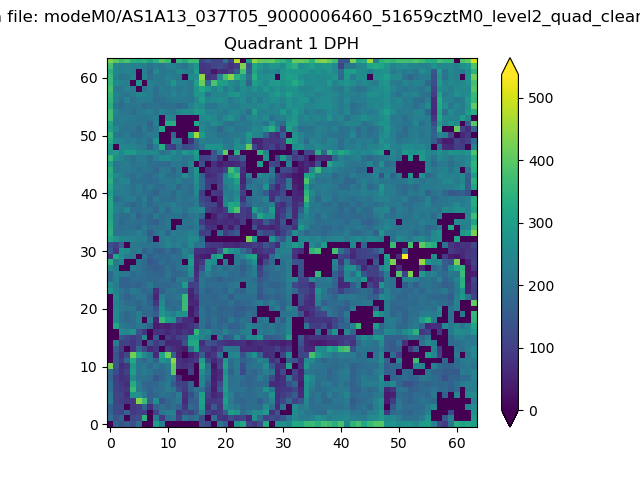 |
Quadrant B |
|---|---|---|---|
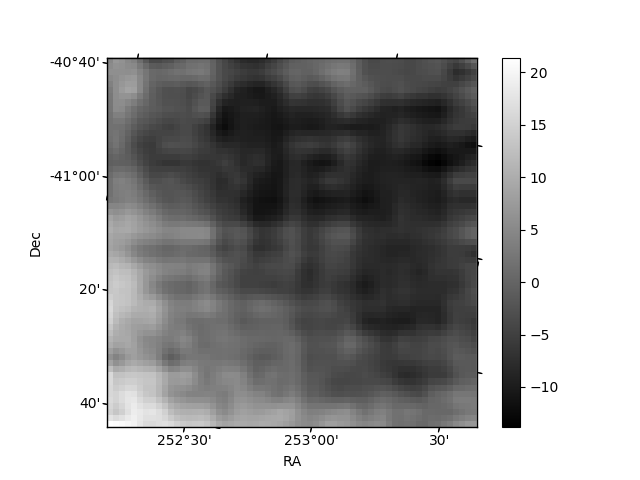
| Quadrant D | 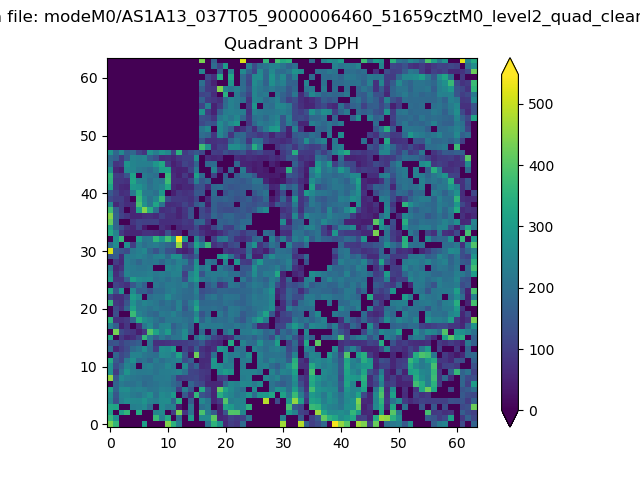 |
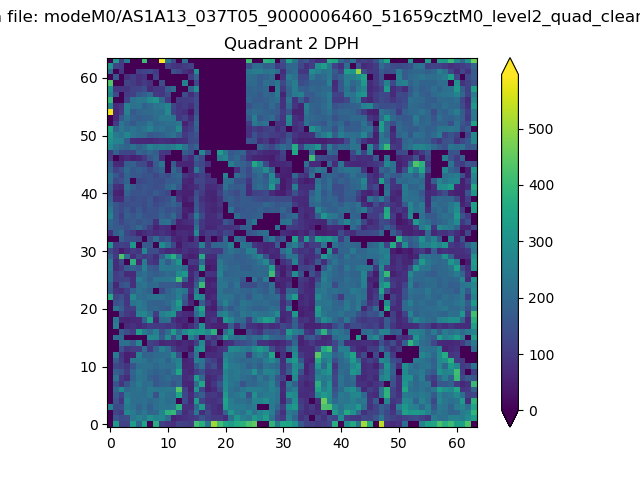 |
Quadrant C |
| Plot type | Count rate plots | Images |
|---|---|---|
| Comparison with Poisson distribution Blue bars denote a histogram of data divided into 1 sec bins. Red curve is a Poisson curve with rate = median count rate of data. |
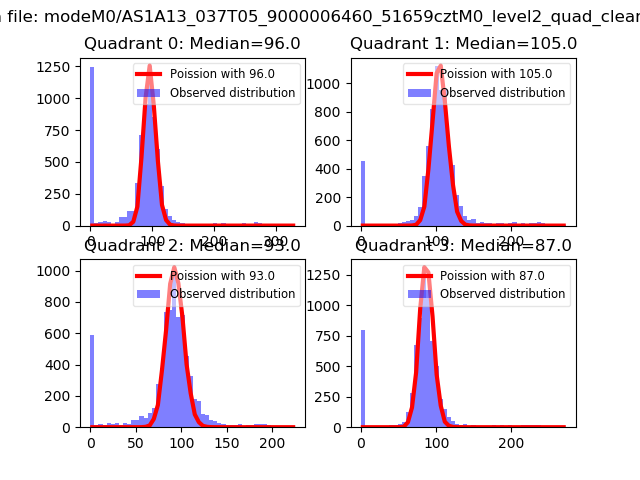 |
 |
| Quadrant-wise count rates Data is divided into 100 sec bins |
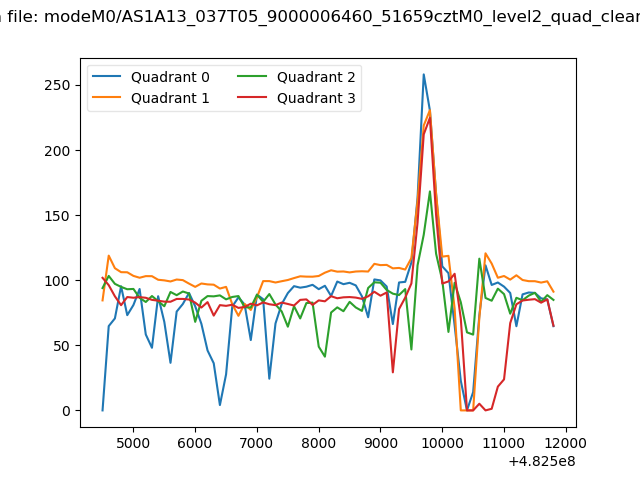 |
|
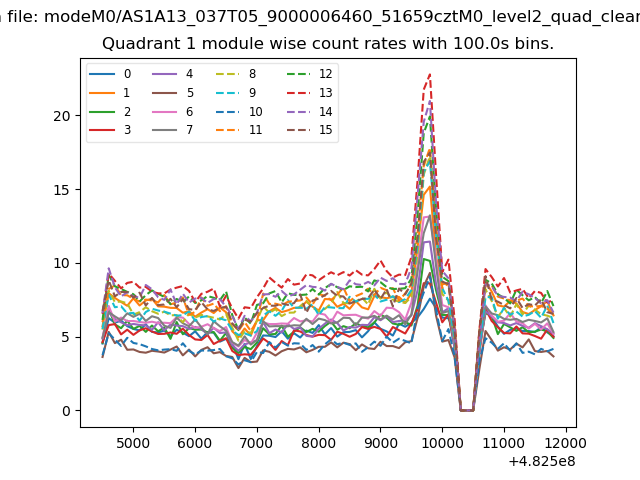
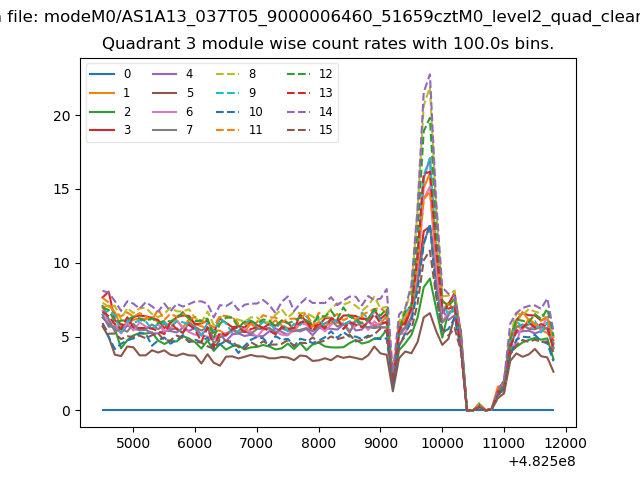
| Module-wise count rates for Quadrant A Data is divided into 100 sec bins |
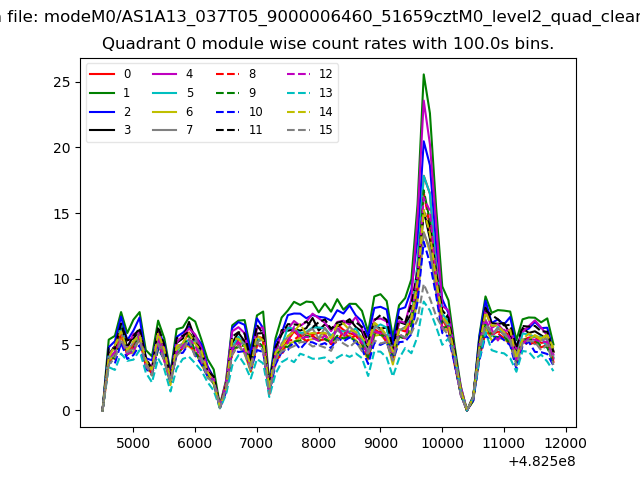 |
 |
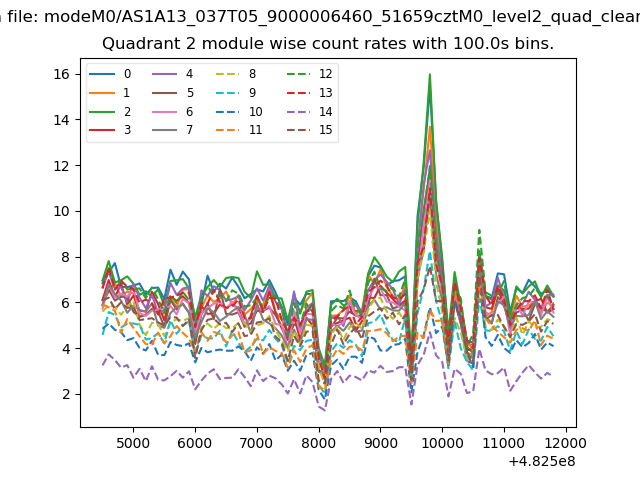
| Module-wise count rates for Quadrant B Data is divided into 100 sec bins |
 |
 |
| Module-wise count rates for Quadrant C Data is divided into 100 sec bins |
 |
 |
| Module-wise count rates for Quadrant D Data is divided into 100 sec bins |
 |
 |
| Parameter | Plot |
|---|---|
| CZT HV Monitor |  |
| D_VDD | 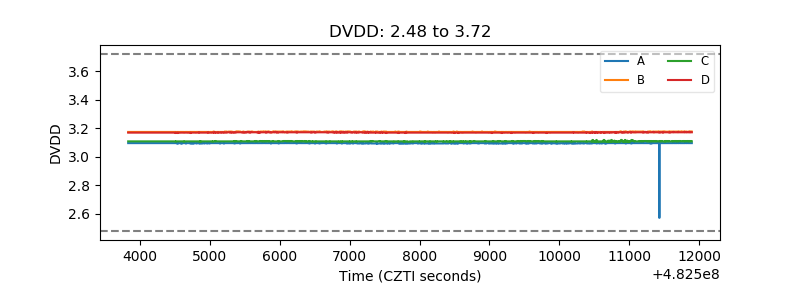 |
| Temperature 1 | 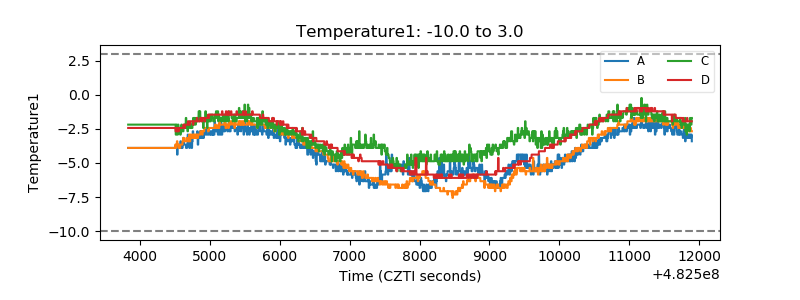 |
| Veto HV Monitor | 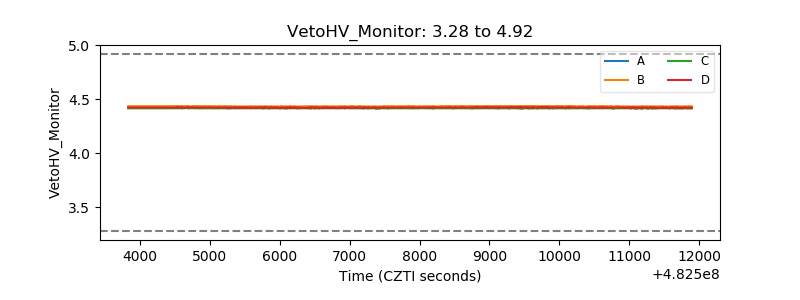 |
| Veto LLD | 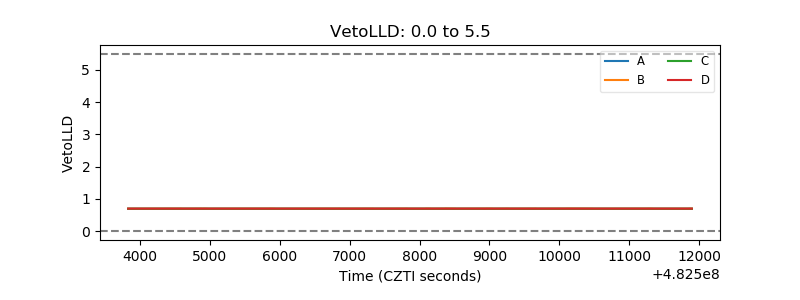 |
| Alpha Counter | 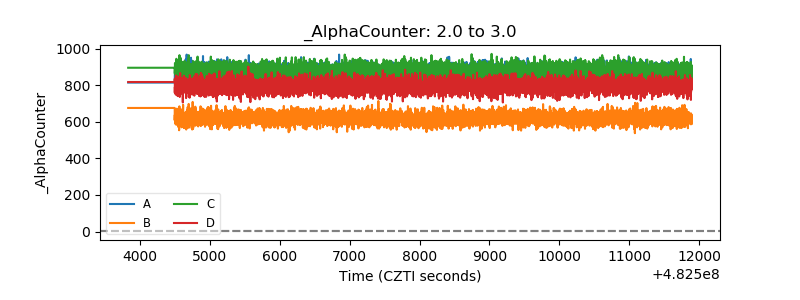 |
| _CPM_Rate |  |
| CZT Counter | 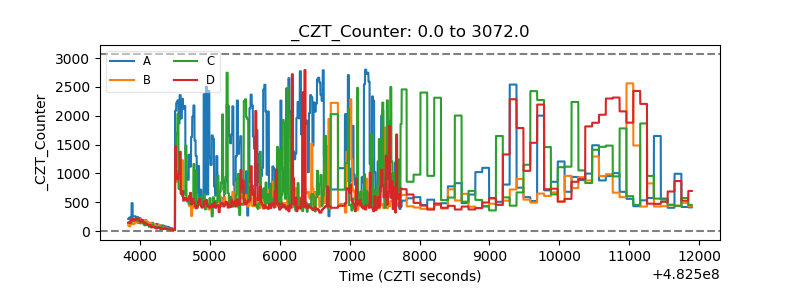 |
| +2.5 Volts monitor | 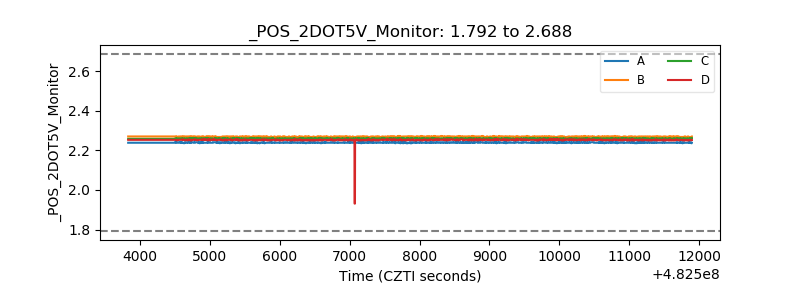 |
| +5 Volts monitor | 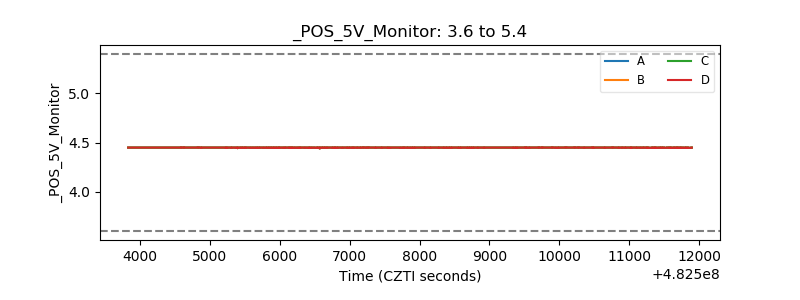 |
| _ROLL_ROT | 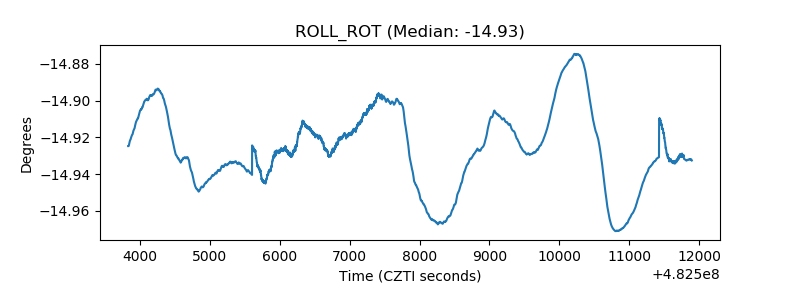 |
| _Roll_DEC | 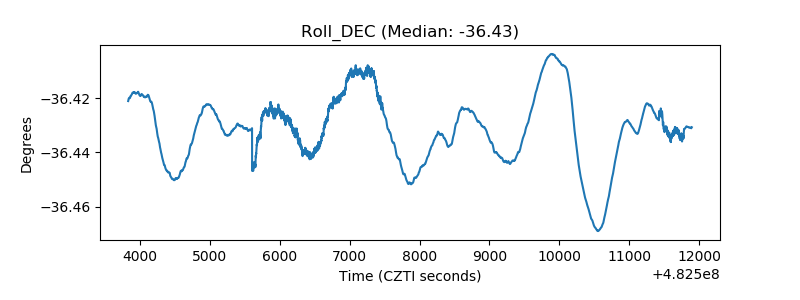 |
| _Roll_RA | 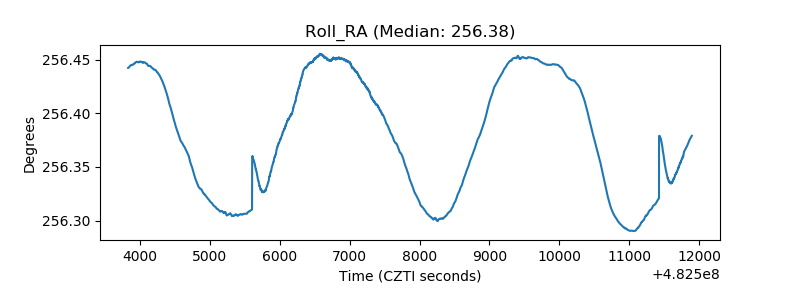 |
| Veto Counter | 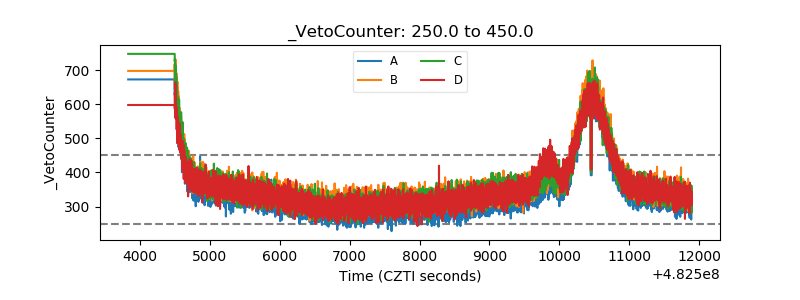 |