| Param | Original file | Final file |
|---|---|---|
| Filename | modeM0/AS1A13_031T01_9000006462cztM0_level2.fits | modeM0/AS1A13_031T01_9000006462cztM0_level2_quad_clean.evt |
| Size (bytes) | 2,911,982,400 | 1,177,251,840 |
| Size | 2.7 GB | 1.1 GB |
| Events in quadrant A | 16,917,302 | 2,908,440 |
| Events in quadrant B | 16,445,868 | 3,204,958 |
| Events in quadrant C | 15,868,434 | 2,670,669 |
| Events in quadrant D | 14,705,456 | 2,639,577 |
| Mode M9 | |||
|---|---|---|---|
| Quadrant | BADHDUFLAG | Total packets | Discarded packets |
| A | 0 | 395 | 0 |
| B | 0 | 397 | 0 |
| C | 0 | 393 | 0 |
| D | 0 | 396 | 0 |
| Mode M0 | |||
|---|---|---|---|
| Quadrant | BADHDUFLAG | Total packets | Discarded packets |
| A | 0 | 1058868 | 0 |
| B | 0 | 883656 | 0 |
| C | 0 | 1162565 | 0 |
| D | 0 | 899281 | 0 |
| Mode SS | |||
|---|---|---|---|
| Quadrant | BADHDUFLAG | Total packets | Discarded packets |
| A | 0 | 7163 | 0 |
| B | 0 | 7178 | 0 |
| C | 0 | 7159 | 0 |
| D | 0 | 7158 | 0 |
| Quadrant | Total seconds | Saturated seconds | Saturation percentage |
|---|---|---|---|
| A | 353532 | 24838 | 7.025672% |
| B | 353611 | 14854 | 4.200661% |
| C | 353179 | 46358 | 13.125922% |
| D | 353356 | 15879 | 4.493768% |
Noise dominated data is calculated using 1-second bins in cleaned event files. If a bin has >2000 counts, and if more than 50% of those come from <1% of pixels, then it is considered to be noise-dominated and hence unusable.
| Quadrant | # 1 sec bins | Bins with >0 counts | Bins with >2000 counts | High rate bins dominated by noise | Noise dominated (total time) | Noise dominated (detector-on time) | Marked lightcurve |
|---|---|---|---|---|---|---|---|
| A | 399298 | 353362 | 0 | 0 | 0.00% | 0.00% | 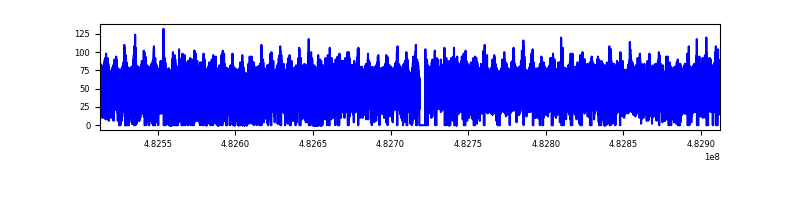 |
| B | 399298 | 354056 | 0 | 0 | 0.00% | 0.00% |  |
| C | 399298 | 352519 | 0 | 0 | 0.00% | 0.00% | 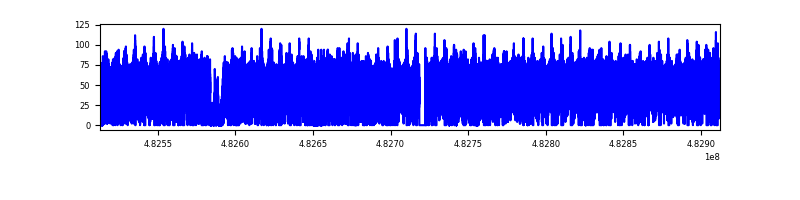 |
| D | 399296 | 353240 | 0 | 0 | 0.00% | 0.00% | 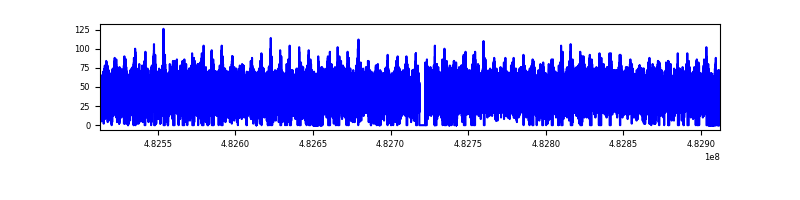 |
Top three noisy pixels from each quadrant. If the there are fewer than three noisy pixels in the level2.evt file, extra rows are filled as -1
| Pixel properties | Quadrant properties | ||||||
|---|---|---|---|---|---|---|---|
| Quadrant | DetID | PixID | Counts | Sigma | Mean | Median | Sigma |
| A | 14 | 188 | 17454 | 9.16 | 4460 | 4127 | 1454.7 |
| A | 9 | 255 | 17123 | 8.93 | 4460 | 4127 | 1454.7 |
| A | 14 | 95 | 14143 | 6.89 | 4460 | 4127 | 1454.7 |
| B | 2 | 9 | 19124 | 14.75 | 4365 | 4125 | 1016.9 |
| B | 2 | 8 | 17258 | 12.92 | 4365 | 4125 | 1016.9 |
| B | 9 | 173 | 13374 | 9.1 | 4365 | 4125 | 1016.9 |
| C | 7 | 221 | 13235 | 6.45 | 4259 | 3871 | 1451.5 |
| C | 2 | 31 | 12822 | 6.17 | 4259 | 3871 | 1451.5 |
| C | 15 | 127 | 12627 | 6.03 | 4259 | 3871 | 1451.5 |
| D | 6 | 218 | 18903 | 10.67 | 4222 | 3759 | 1419.7 |
| D | 3 | 30 | 14602 | 7.64 | 4222 | 3759 | 1419.7 |
| D | 15 | 11 | 13667 | 6.98 | 4222 | 3759 | 1419.7 |
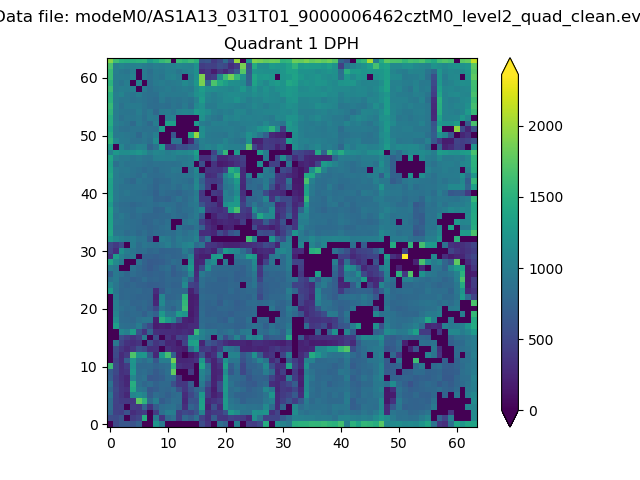
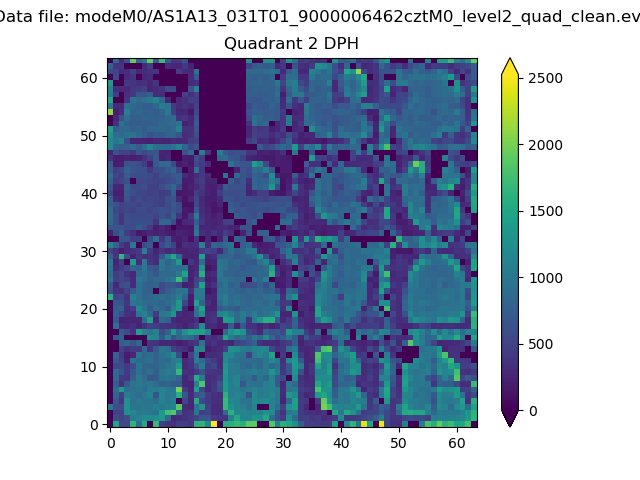
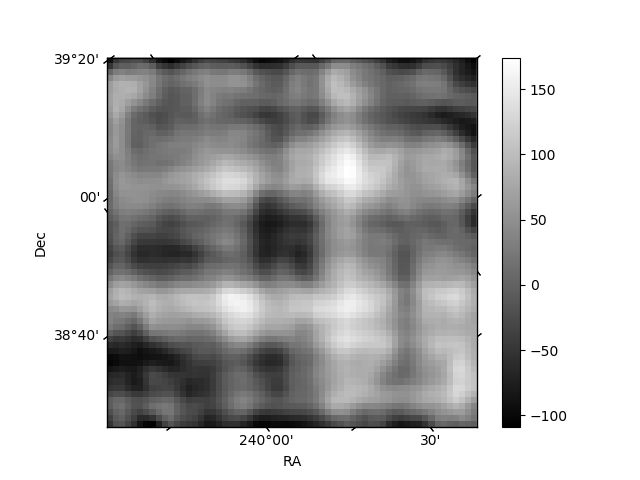
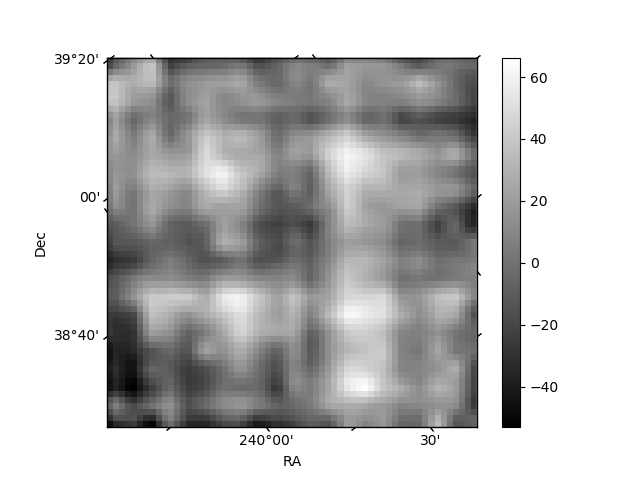
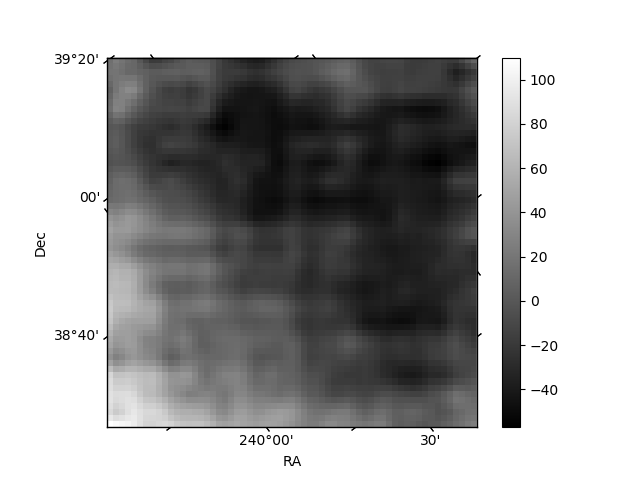
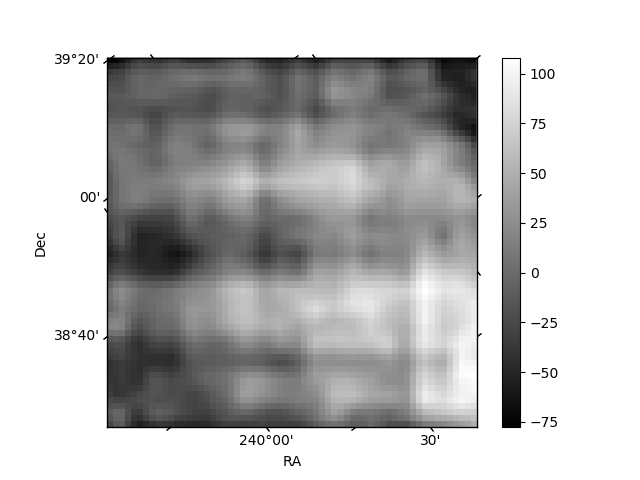
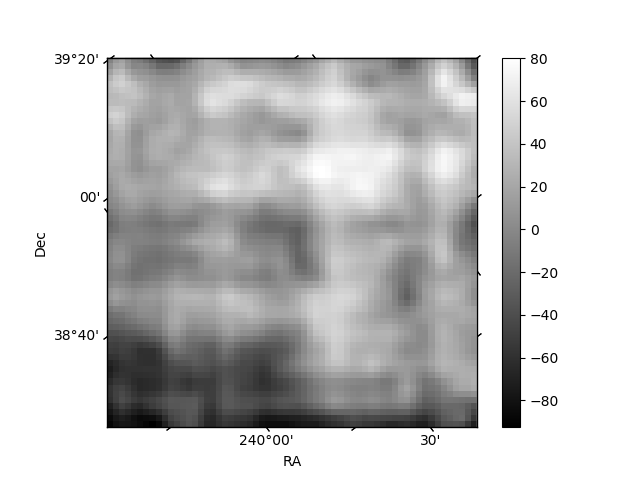
Histogram calculated using DETX and DETY for each event in the final _common_clean file
| Quadrant A | 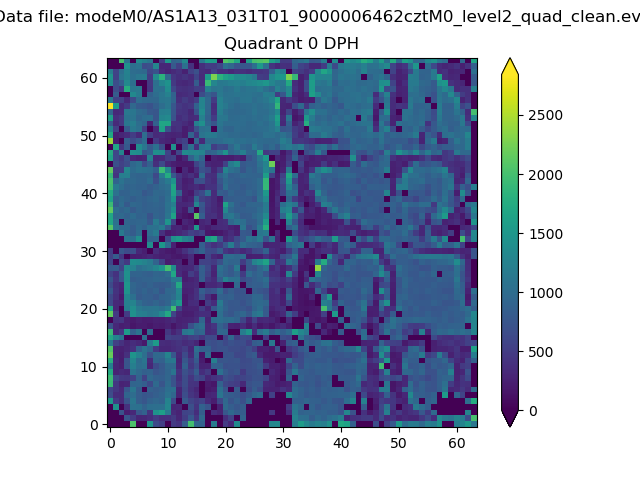 |
 |
Quadrant B |
|---|---|---|---|
| Quadrant D | 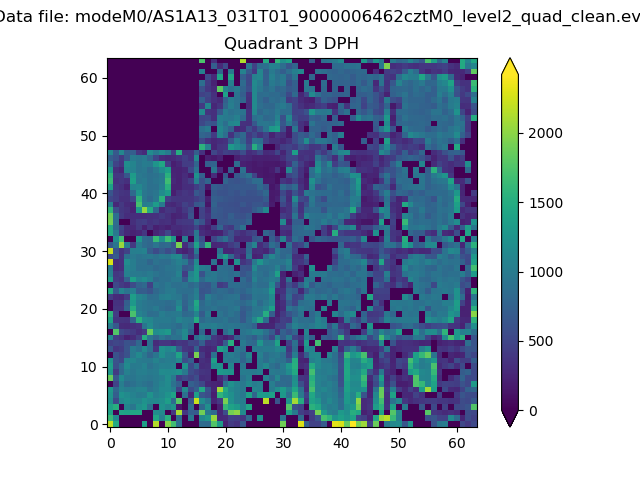 |
 |
Quadrant C |
| Plot type | Count rate plots | Images |
|---|---|---|
| Comparison with Poisson distribution Blue bars denote a histogram of data divided into 1 sec bins. Red curve is a Poisson curve with rate = median count rate of data. |
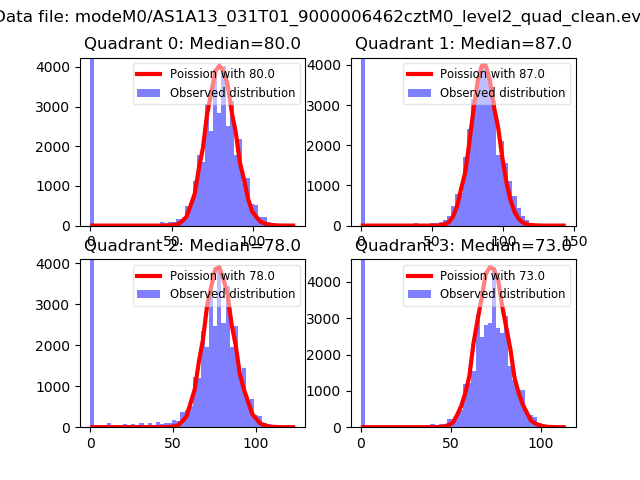 |
 |
| Quadrant-wise count rates Data is divided into 100 sec bins |
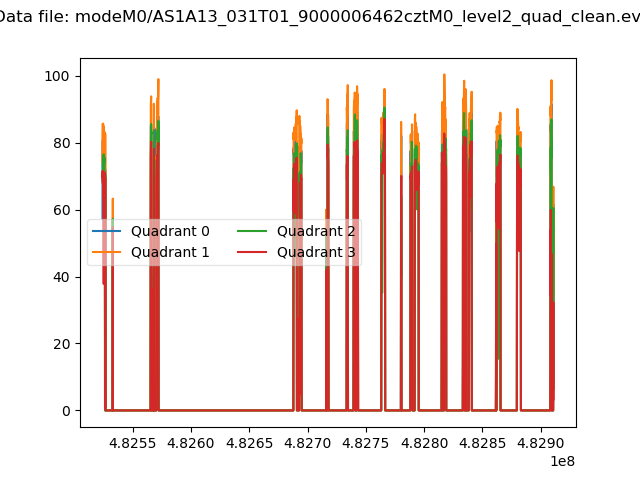 |
|
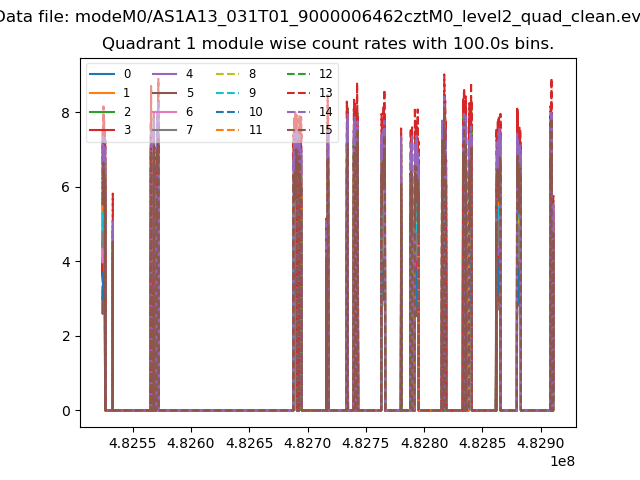
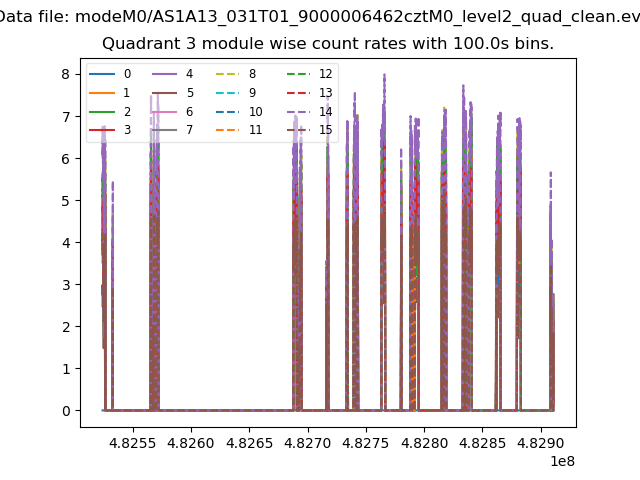
| Module-wise count rates for Quadrant A Data is divided into 100 sec bins |
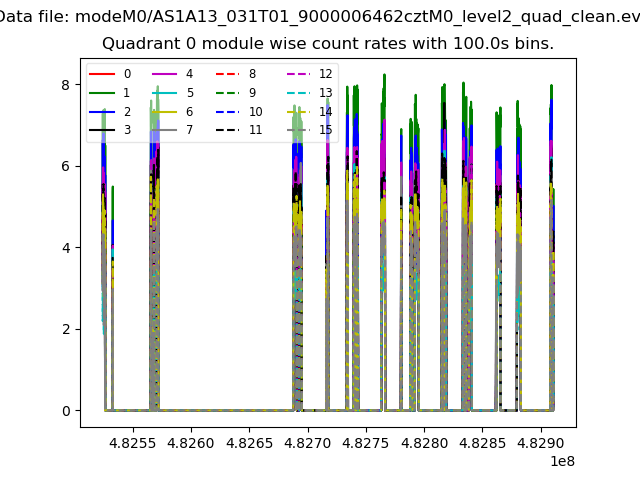 |
 |
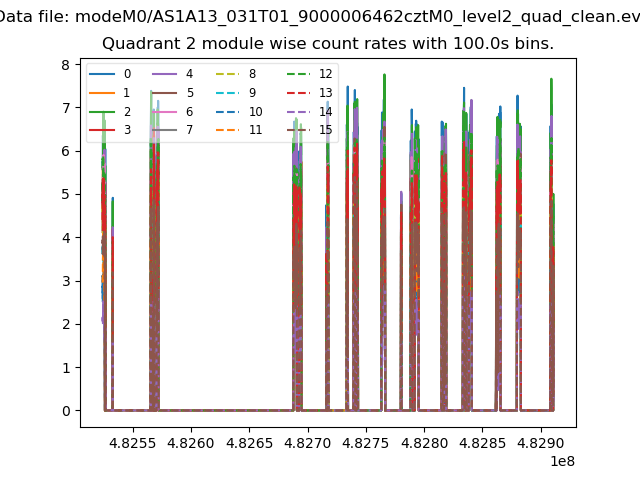
| Module-wise count rates for Quadrant B Data is divided into 100 sec bins |
 |
 |
| Module-wise count rates for Quadrant C Data is divided into 100 sec bins |
 |
 |
| Module-wise count rates for Quadrant D Data is divided into 100 sec bins |
 |
 |
| Parameter | Plot |
|---|---|
| CZT HV Monitor | 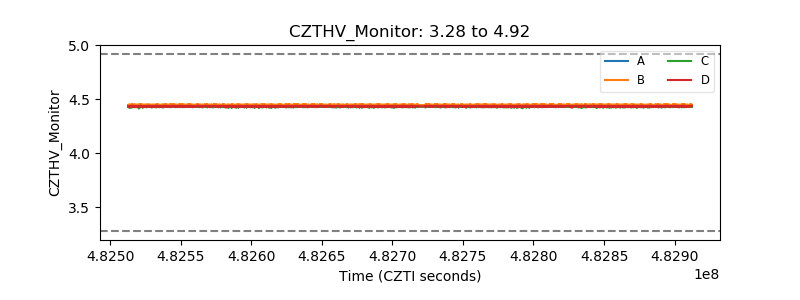 |
| D_VDD | 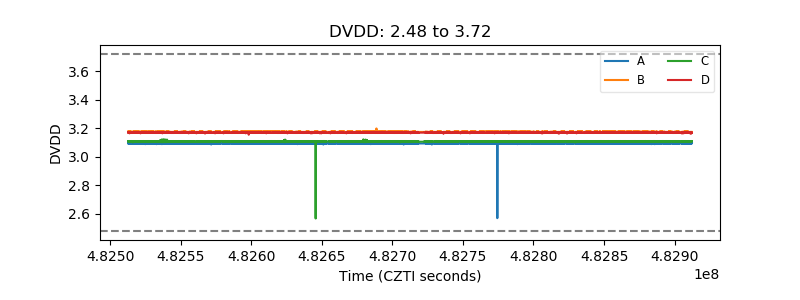 |
| Temperature 1 | 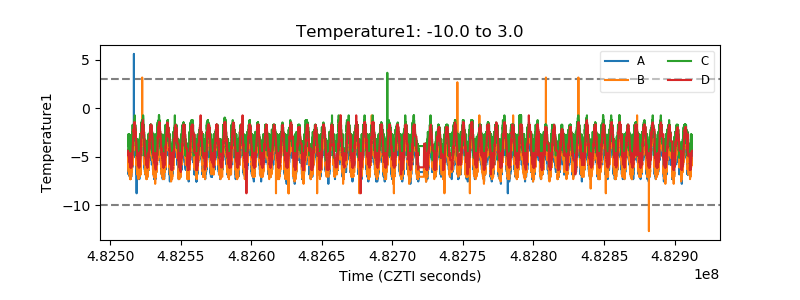 |
| Veto HV Monitor | 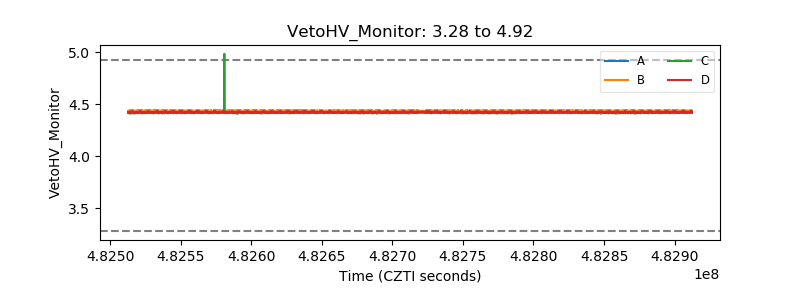 |
| Veto LLD | 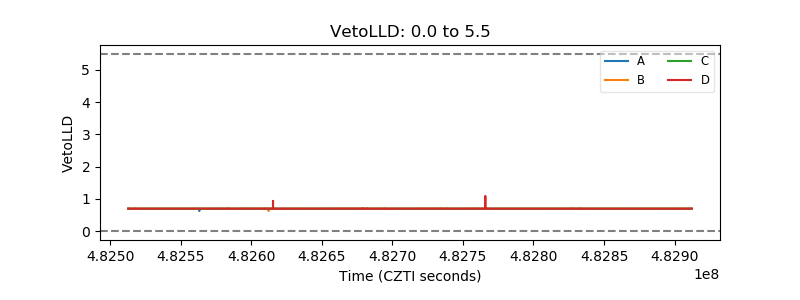 |
| Alpha Counter | 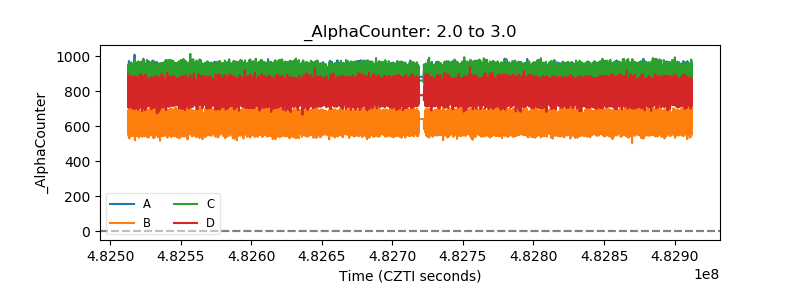 |
| _CPM_Rate | 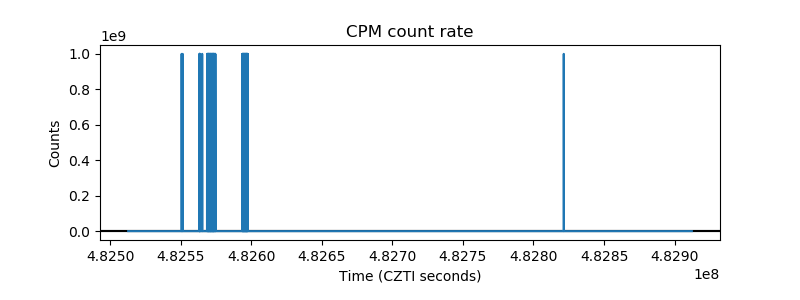 |
| CZT Counter | 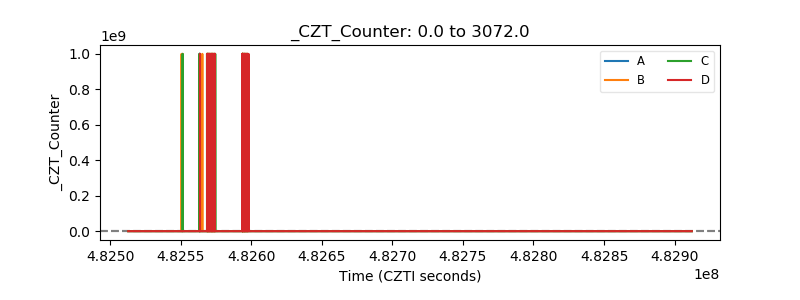 |
| +2.5 Volts monitor | 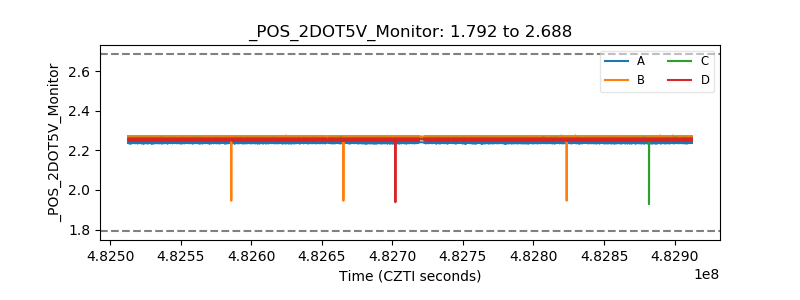 |
| +5 Volts monitor | 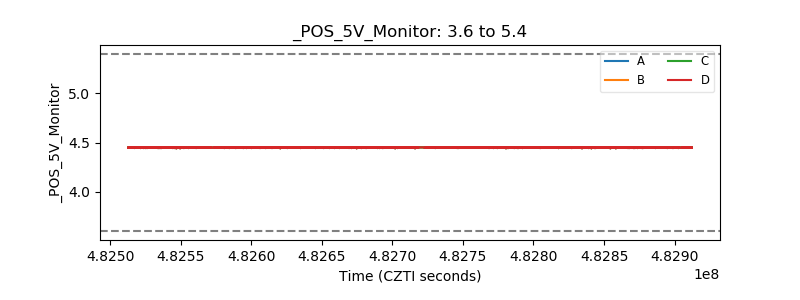 |
| _ROLL_ROT | 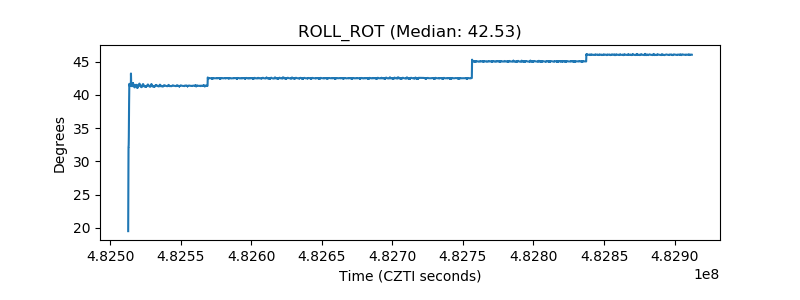 |
| _Roll_DEC | 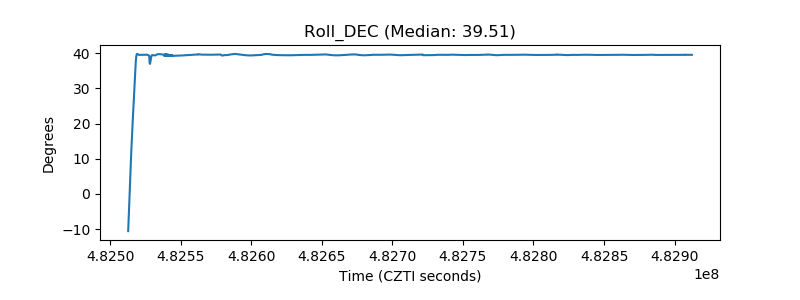 |
| _Roll_RA | 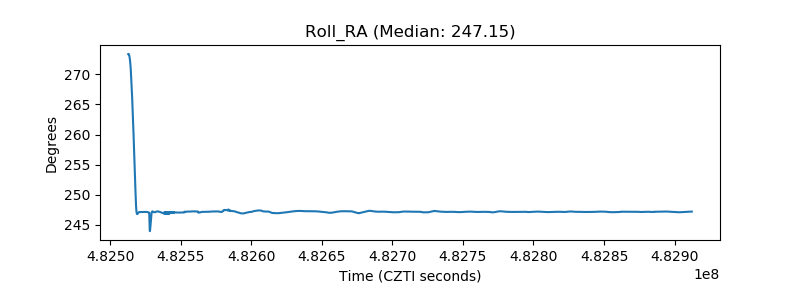 |
| Veto Counter | 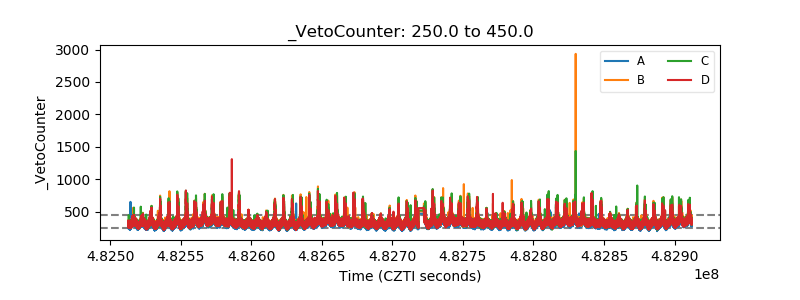 |