| Param | Original file | Final file |
|---|---|---|
| Filename | modeM0/AS1A13_031T01_9000006462_51659cztM0_level2.fits | modeM0/AS1A13_031T01_9000006462_51659cztM0_level2_quad_clean.evt |
| Size (bytes) | 476,593,920 | 83,839,680 |
| Size | 454.5 MB | 80.0 MB |
| Events in quadrant A | 4,023,994 | 569,372 |
| Events in quadrant B | 3,613,562 | 602,912 |
| Events in quadrant C | 5,697,208 | 454,633 |
| Events in quadrant D | 3,858,044 | 507,747 |
| Mode M0 | |||
|---|---|---|---|
| Quadrant | BADHDUFLAG | Total packets | Discarded packets |
| A | 0 | 15956 | 0 |
| B | 0 | 14473 | 0 |
| C | 0 | 20966 | 0 |
| D | 0 | 15560 | 0 |
| Mode SS | |||
|---|---|---|---|
| Quadrant | BADHDUFLAG | Total packets | Discarded packets |
| A | 0 | 116 | 0 |
| B | 0 | 116 | 0 |
| C | 0 | 116 | 0 |
| D | 0 | 116 | 0 |
| Quadrant | Total seconds | Saturated seconds | Saturation percentage |
|---|---|---|---|
| A | 5776 | 237 | 4.103186% |
| B | 5776 | 140 | 2.423823% |
| C | 5776 | 1257 | 21.762465% |
| D | 5776 | 297 | 5.141967% |
Noise dominated data is calculated using 1-second bins in cleaned event files. If a bin has >2000 counts, and if more than 50% of those come from <1% of pixels, then it is considered to be noise-dominated and hence unusable.
| Quadrant | # 1 sec bins | Bins with >0 counts | Bins with >2000 counts | High rate bins dominated by noise | Noise dominated (total time) | Noise dominated (detector-on time) | Marked lightcurve |
|---|---|---|---|---|---|---|---|
| A | 5776 | 5776 | 175 | 175 | 3.03% | 3.03% | 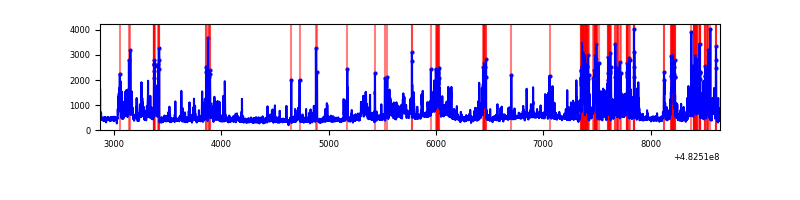 |
| B | 5776 | 5776 | 88 | 88 | 1.52% | 1.52% | 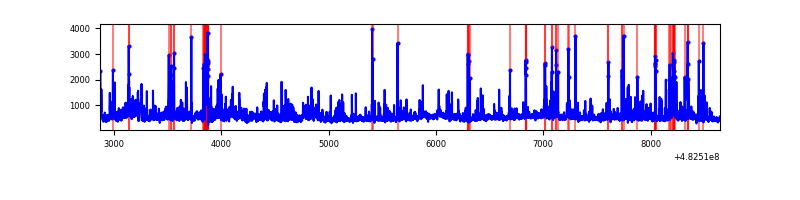 |
| C | 5776 | 5776 | 944 | 944 | 16.34% | 16.34% | 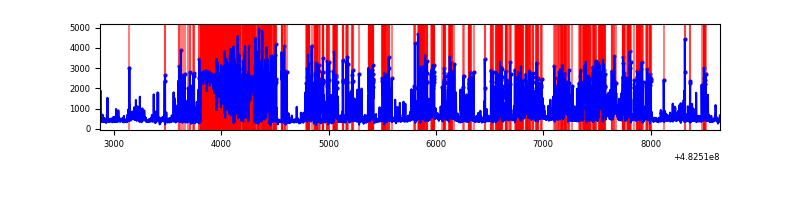 |
| D | 5776 | 5776 | 292 | 292 | 5.06% | 5.06% | 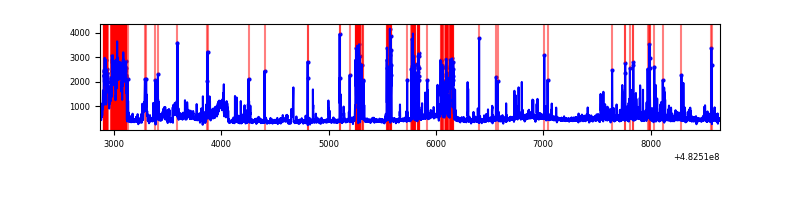 |
Top three noisy pixels from each quadrant. If the there are fewer than three noisy pixels in the level2.evt file, extra rows are filled as -1
| Pixel properties | Quadrant properties | ||||||
|---|---|---|---|---|---|---|---|
| Quadrant | DetID | PixID | Counts | Sigma | Mean | Median | Sigma |
| A | 7 | 64 | 568459 | 3649.56 | 619 | 606 | 155.6 |
| A | 12 | 250 | 541480 | 3476.16 | 619 | 606 | 155.6 |
| A | 13 | 248 | 126133 | 806.75 | 619 | 606 | 155.6 |
| B | 12 | 32 | 300335 | 2264.81 | 612 | 592 | 132.3 |
| B | 1 | 223 | 101859 | 765.16 | 612 | 592 | 132.3 |
| B | 0 | 171 | 99005 | 743.59 | 612 | 592 | 132.3 |
| C | 15 | 189 | 1970718 | 12951.78 | 544 | 539 | 152.1 |
| C | 15 | 147 | 937874 | 6161.96 | 544 | 539 | 152.1 |
| C | 14 | 245 | 178021 | 1166.75 | 544 | 539 | 152.1 |
| D | 10 | 172 | 618183 | 3647.05 | 595 | 574 | 169.3 |
| D | 2 | 249 | 327601 | 1931.13 | 595 | 574 | 169.3 |
| D | 7 | 60 | 174659 | 1027.99 | 595 | 574 | 169.3 |
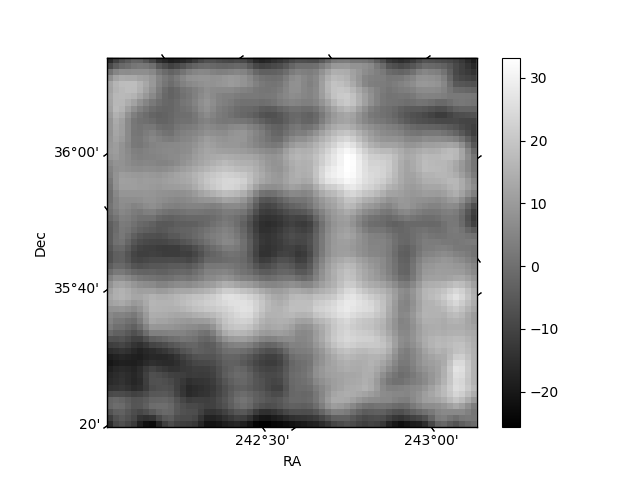
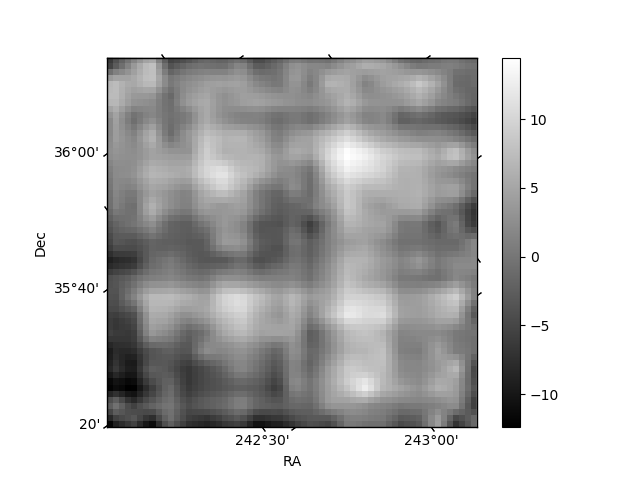
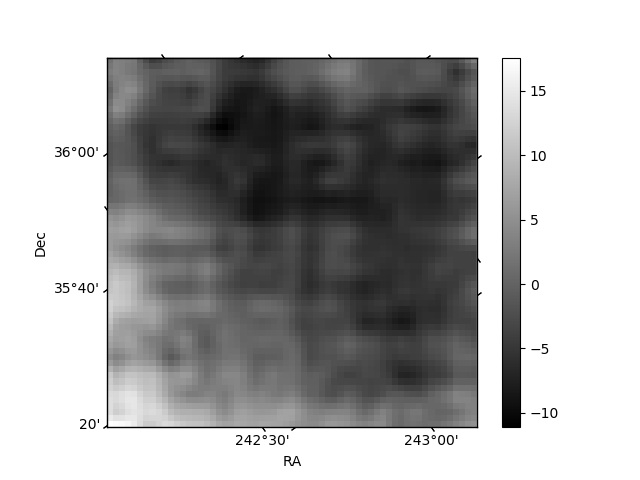
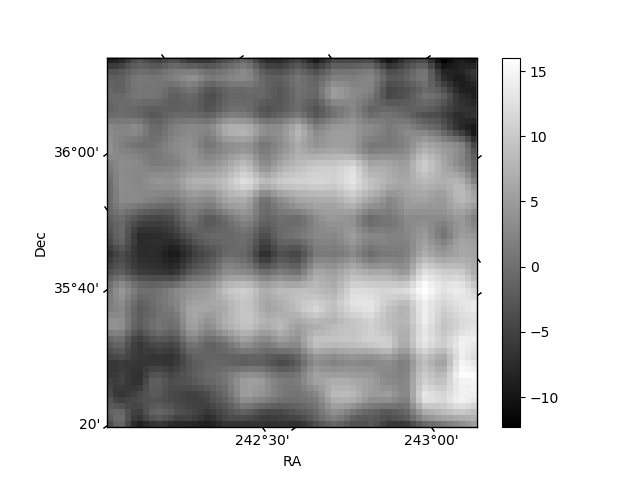
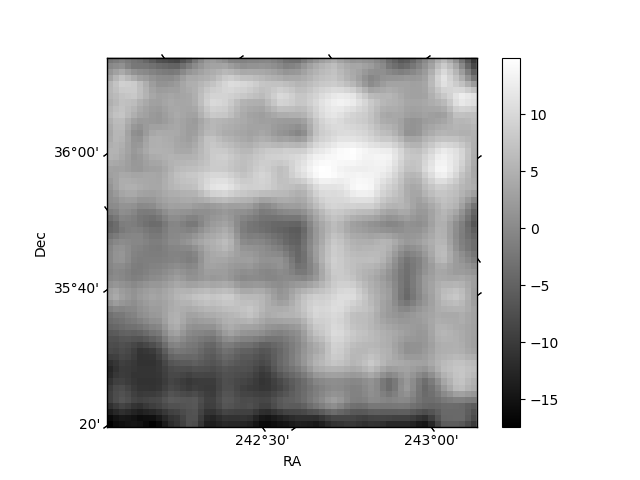
Histogram calculated using DETX and DETY for each event in the final _common_clean file
| Quadrant A | 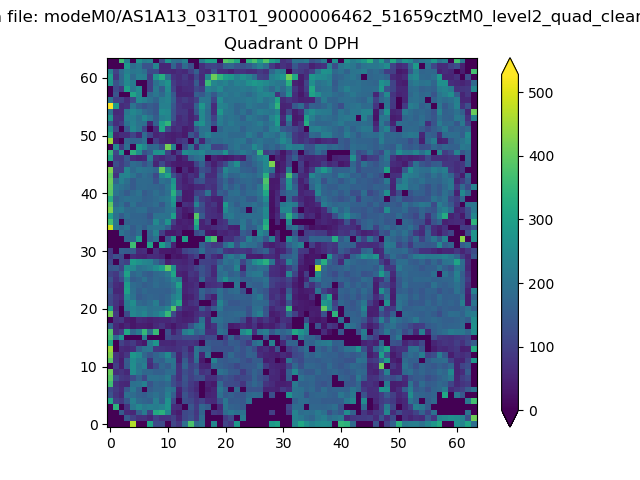 |
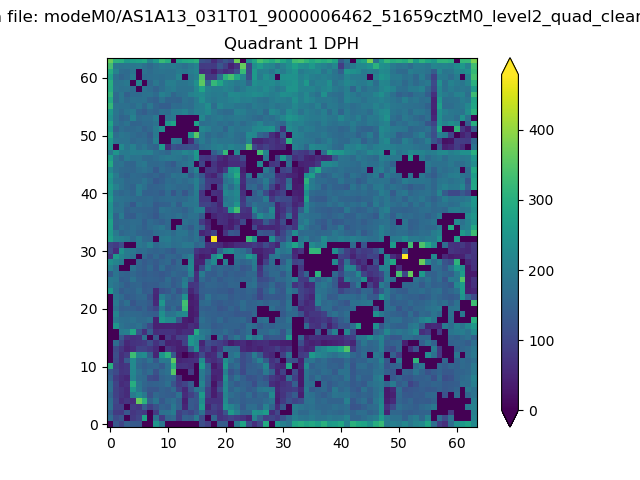 |
Quadrant B |
|---|---|---|---|
| Quadrant D | 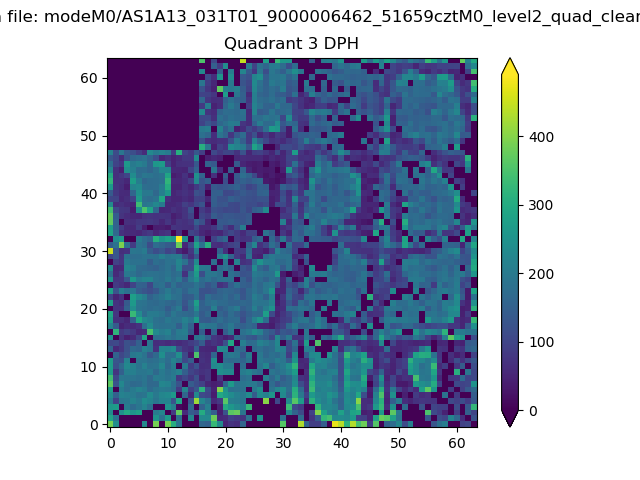 |
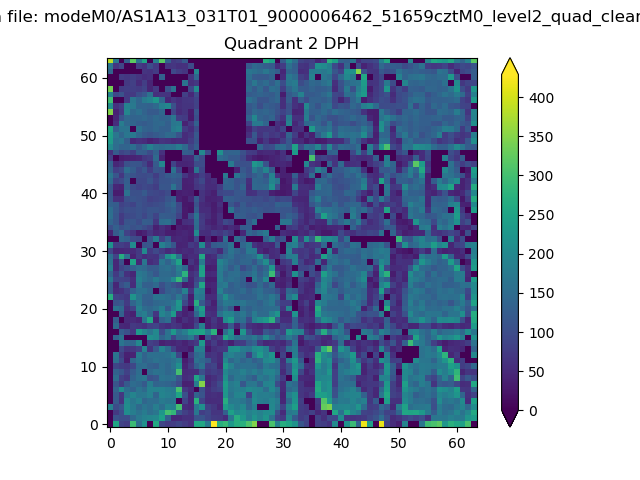 |
Quadrant C |
| Plot type | Count rate plots | Images |
|---|---|---|
| Comparison with Poisson distribution Blue bars denote a histogram of data divided into 1 sec bins. Red curve is a Poisson curve with rate = median count rate of data. |
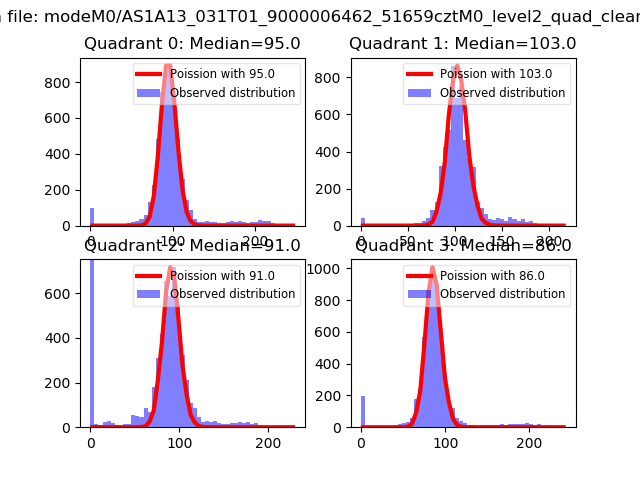 |
 |
| Quadrant-wise count rates Data is divided into 100 sec bins |
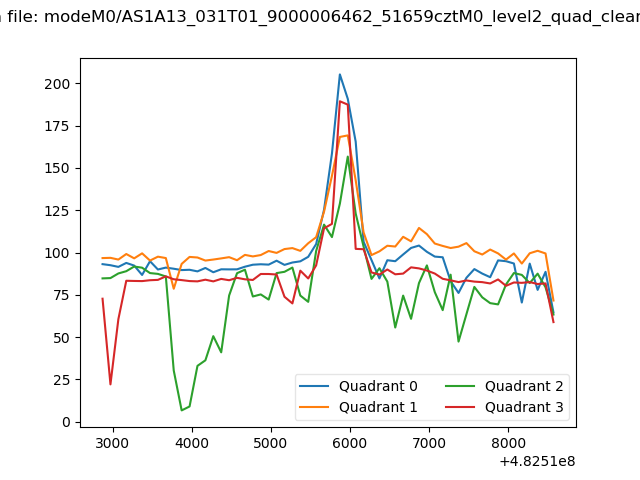 |
|
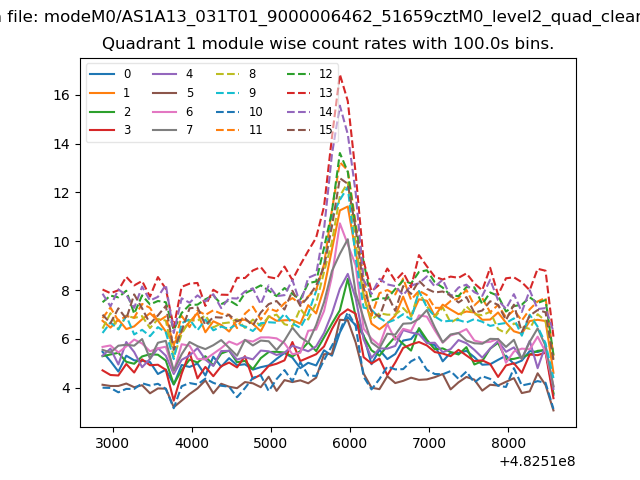
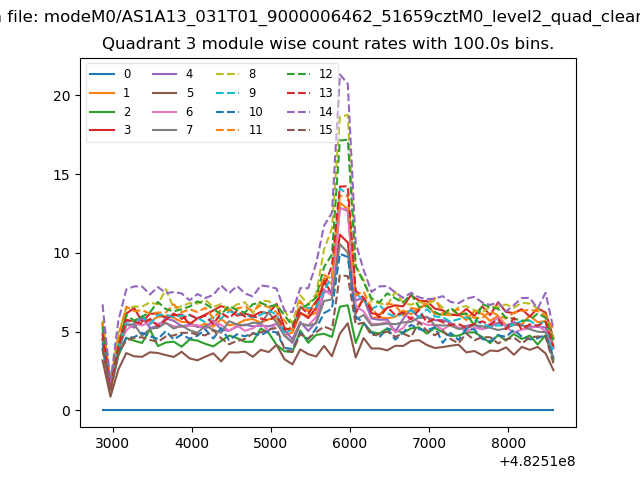
| Module-wise count rates for Quadrant A Data is divided into 100 sec bins |
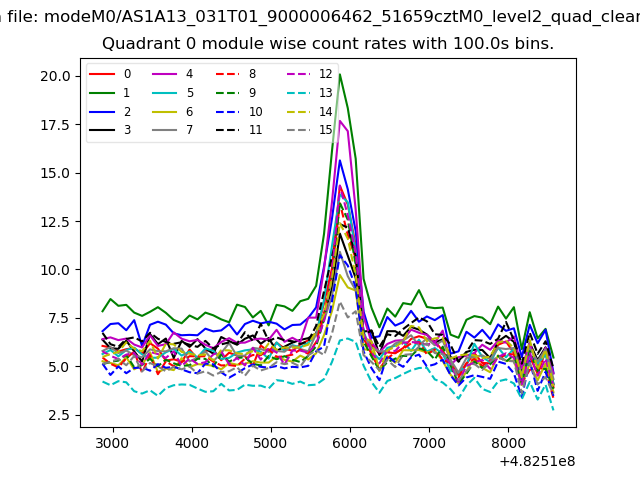 |
 |
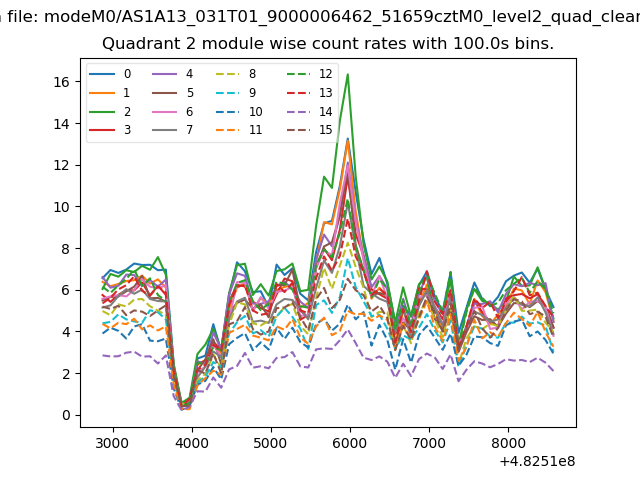
| Module-wise count rates for Quadrant B Data is divided into 100 sec bins |
 |
 |
| Module-wise count rates for Quadrant C Data is divided into 100 sec bins |
 |
 |
| Module-wise count rates for Quadrant D Data is divided into 100 sec bins |
 |
 |
| Parameter | Plot |
|---|---|
| CZT HV Monitor | 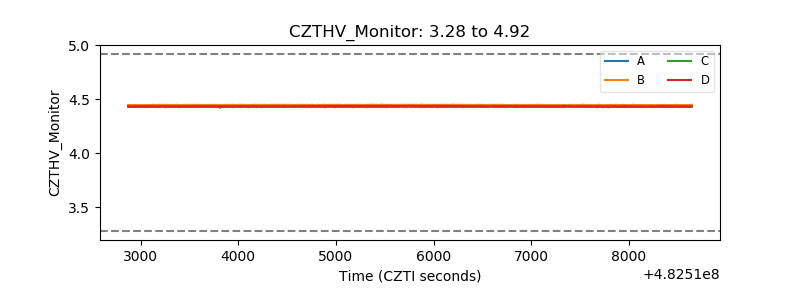 |
| D_VDD | 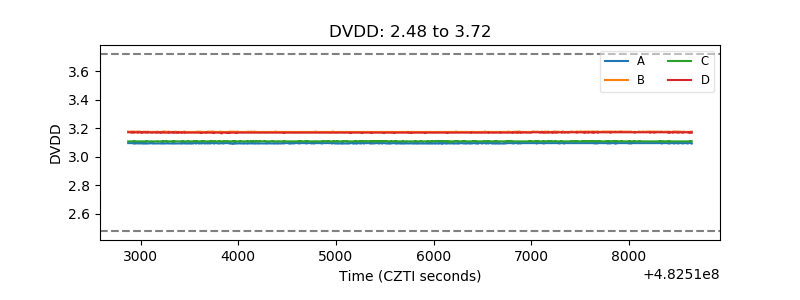 |
| Temperature 1 | 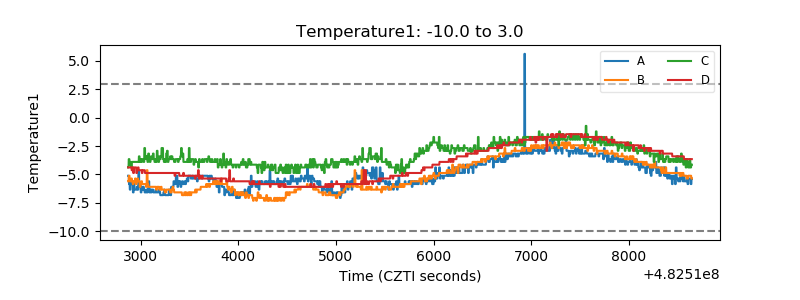 |
| Veto HV Monitor | 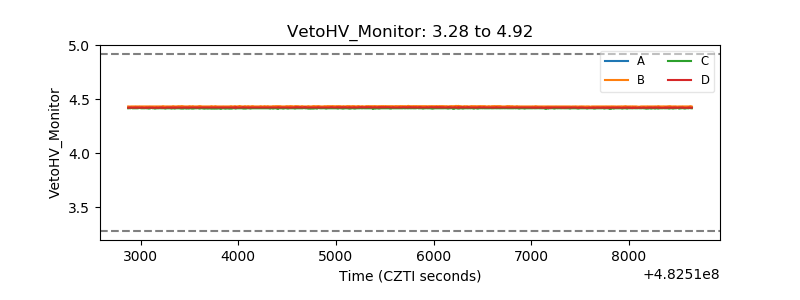 |
| Veto LLD | 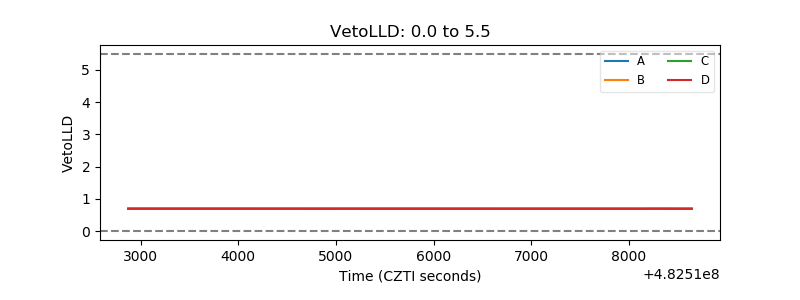 |
| Alpha Counter | 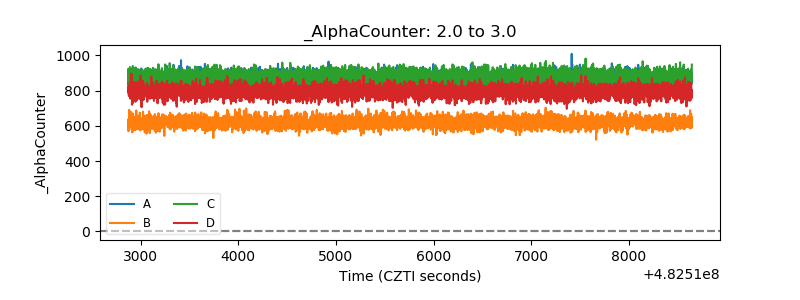 |
| _CPM_Rate | 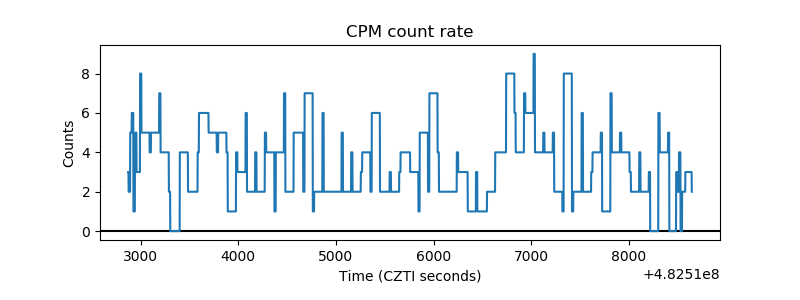 |
| CZT Counter | 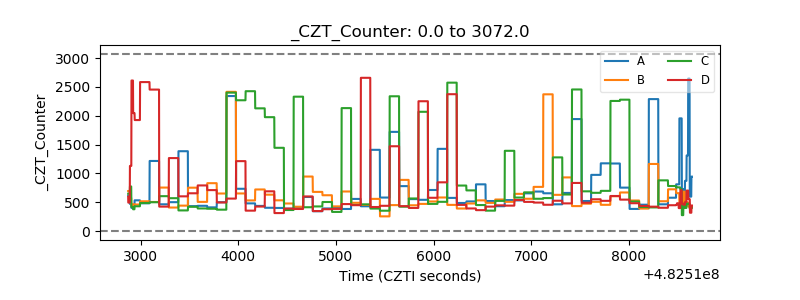 |
| +2.5 Volts monitor | 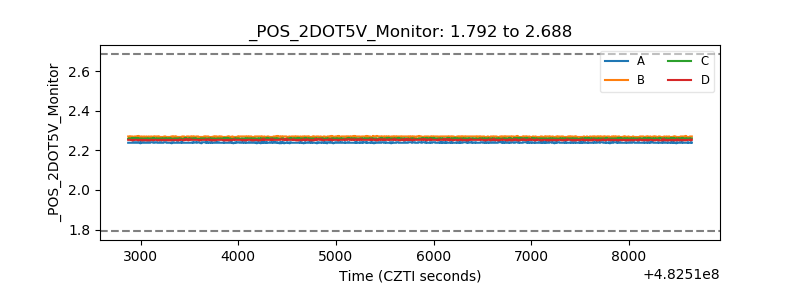 |
| +5 Volts monitor | 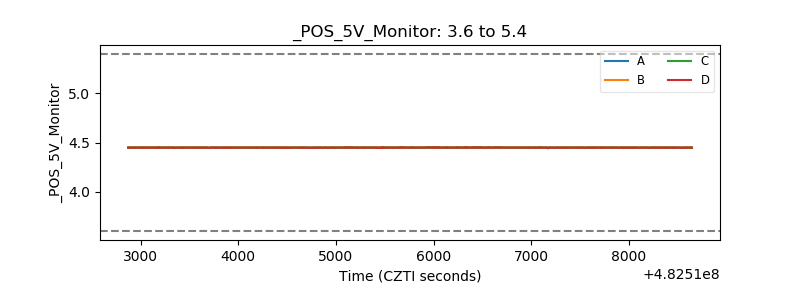 |
| _ROLL_ROT | 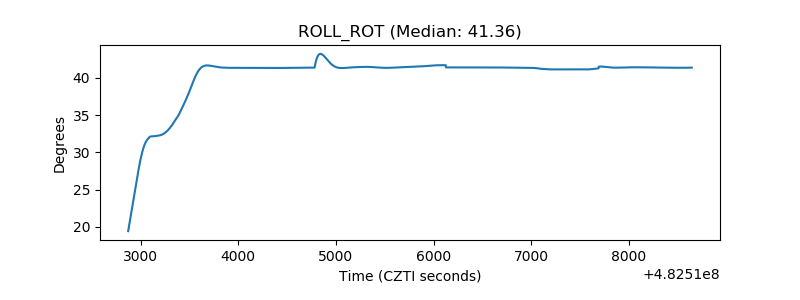 |
| _Roll_DEC | 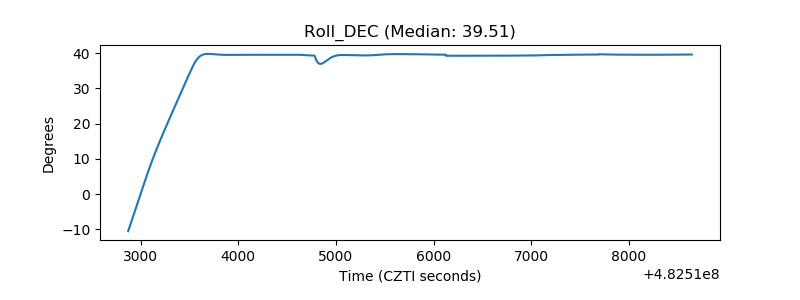 |
| _Roll_RA | 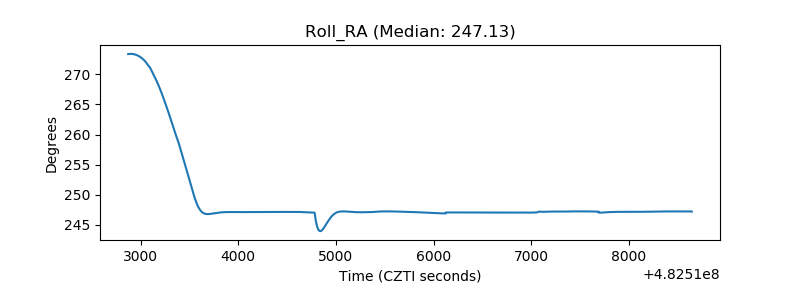 |
| Veto Counter | 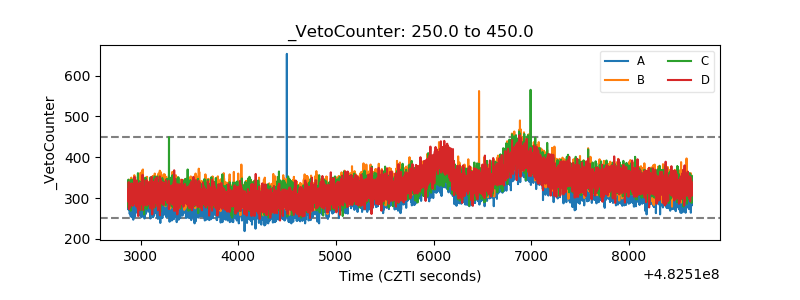 |