| Param | Original file | Final file |
|---|---|---|
| Filename | modeM0/AS1A13_031T01_9000006462_51660cztM0_level2.fits | modeM0/AS1A13_031T01_9000006462_51660cztM0_level2_quad_clean.evt |
| Size (bytes) | 666,792,000 | 122,806,080 |
| Size | 635.9 MB | 117.1 MB |
| Events in quadrant A | 6,392,178 | 791,064 |
| Events in quadrant B | 5,250,119 | 871,985 |
| Events in quadrant C | 7,023,380 | 722,245 |
| Events in quadrant D | 5,347,361 | 733,343 |
| Mode M0 | |||
|---|---|---|---|
| Quadrant | BADHDUFLAG | Total packets | Discarded packets |
| A | 0 | 24952 | 0 |
| B | 0 | 21417 | 0 |
| C | 0 | 26938 | 1 |
| D | 0 | 21808 | 1 |
| Mode SS | |||
|---|---|---|---|
| Quadrant | BADHDUFLAG | Total packets | Discarded packets |
| A | 0 | 172 | 0 |
| B | 0 | 172 | 0 |
| C | 0 | 172 | 0 |
| D | 0 | 172 | 0 |
| Quadrant | Total seconds | Saturated seconds | Saturation percentage |
|---|---|---|---|
| A | 8636 | 511 | 5.917091% |
| B | 8637 | 251 | 2.906102% |
| C | 8636 | 965 | 11.174155% |
| D | 8635 | 201 | 2.327736% |
Noise dominated data is calculated using 1-second bins in cleaned event files. If a bin has >2000 counts, and if more than 50% of those come from <1% of pixels, then it is considered to be noise-dominated and hence unusable.
| Quadrant | # 1 sec bins | Bins with >0 counts | Bins with >2000 counts | High rate bins dominated by noise | Noise dominated (total time) | Noise dominated (detector-on time) | Marked lightcurve |
|---|---|---|---|---|---|---|---|
| A | 8636 | 8636 | 355 | 355 | 4.11% | 4.11% | 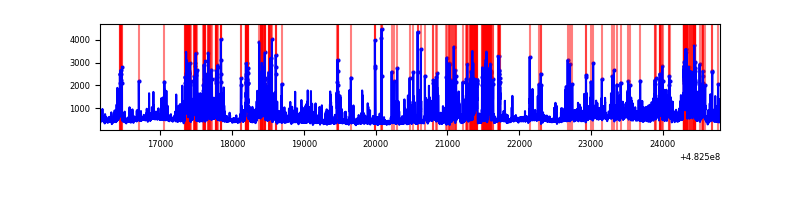 |
| B | 8637 | 8637 | 160 | 160 | 1.85% | 1.85% | 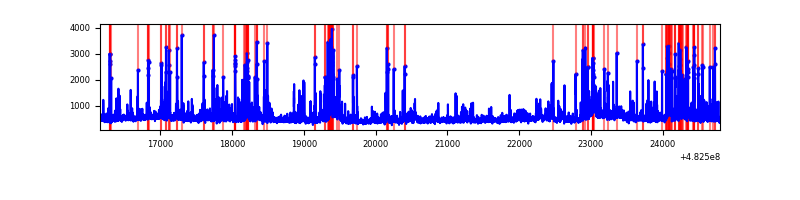 |
| C | 8636 | 8636 | 690 | 690 | 7.99% | 7.99% | 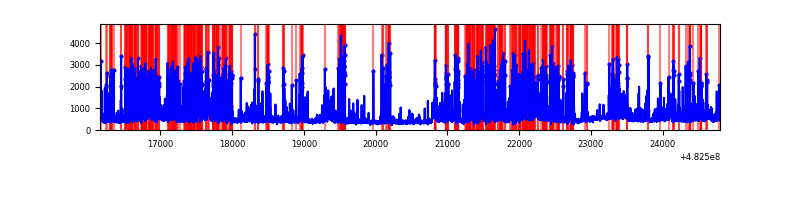 |
| D | 8636 | 8636 | 174 | 174 | 2.01% | 2.01% | 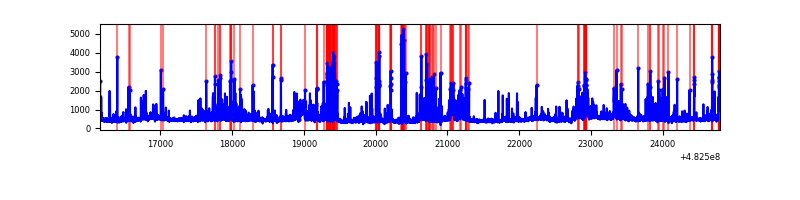 |
Top three noisy pixels from each quadrant. If the there are fewer than three noisy pixels in the level2.evt file, extra rows are filled as -1
| Pixel properties | Quadrant properties | ||||||
|---|---|---|---|---|---|---|---|
| Quadrant | DetID | PixID | Counts | Sigma | Mean | Median | Sigma |
| A | 12 | 250 | 1158660 | 5071.36 | 925 | 903 | 228.3 |
| A | 7 | 64 | 901994 | 3947.08 | 925 | 903 | 228.3 |
| A | 7 | 206 | 194596 | 848.44 | 925 | 903 | 228.3 |
| B | 12 | 32 | 252020 | 1272.54 | 924 | 892 | 197.3 |
| B | 1 | 223 | 232506 | 1173.66 | 924 | 892 | 197.3 |
| B | 15 | 52 | 114109 | 573.7 | 924 | 892 | 197.3 |
| C | 15 | 189 | 1792885 | 7517.29 | 874 | 868 | 238.4 |
| C | 14 | 245 | 552533 | 2314.17 | 874 | 868 | 238.4 |
| C | 12 | 254 | 316649 | 1324.66 | 874 | 868 | 238.4 |
| D | 7 | 60 | 414035 | 1651.88 | 904 | 873 | 250.1 |
| D | 2 | 249 | 276319 | 1101.27 | 904 | 873 | 250.1 |
| D | 8 | 176 | 252229 | 1004.95 | 904 | 873 | 250.1 |
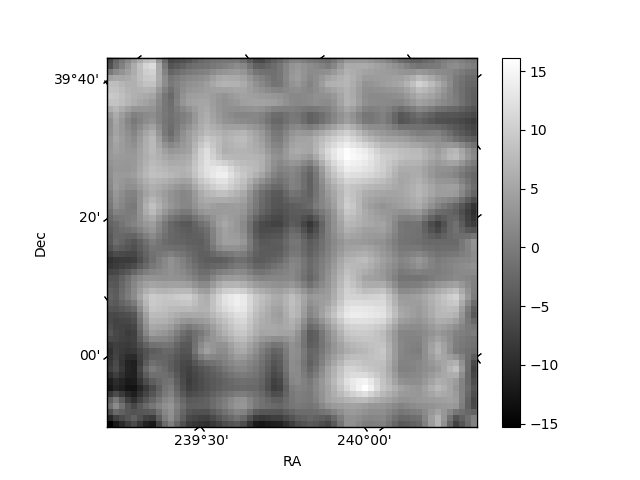
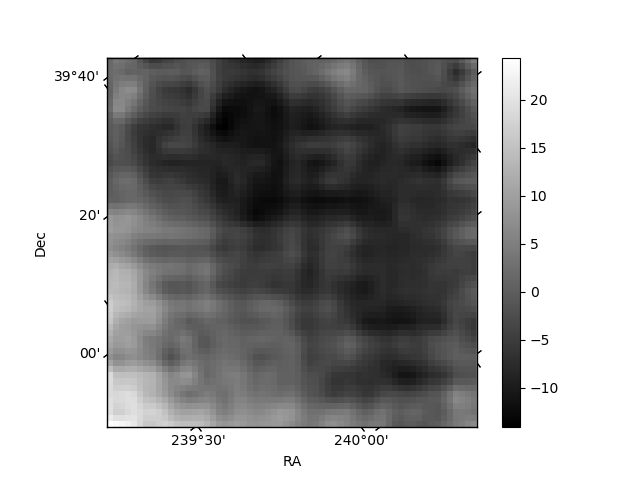
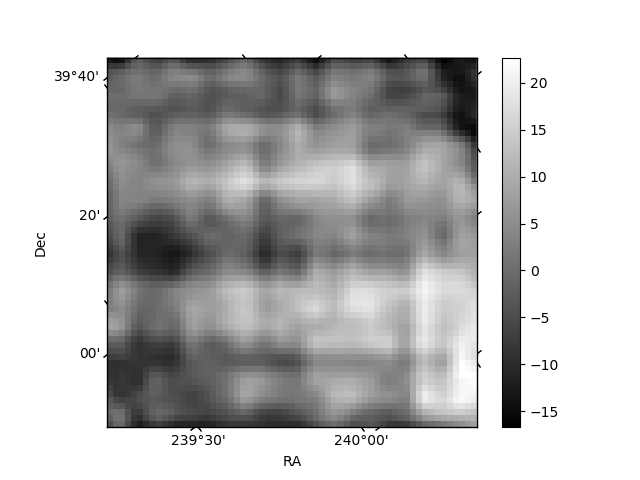
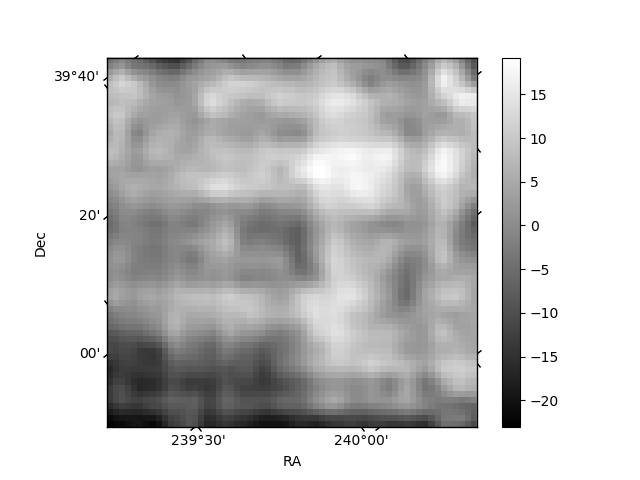
Histogram calculated using DETX and DETY for each event in the final _common_clean file
| Quadrant A | 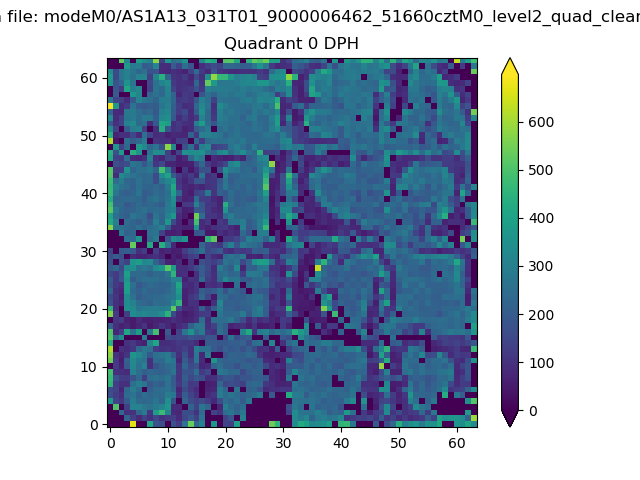 |
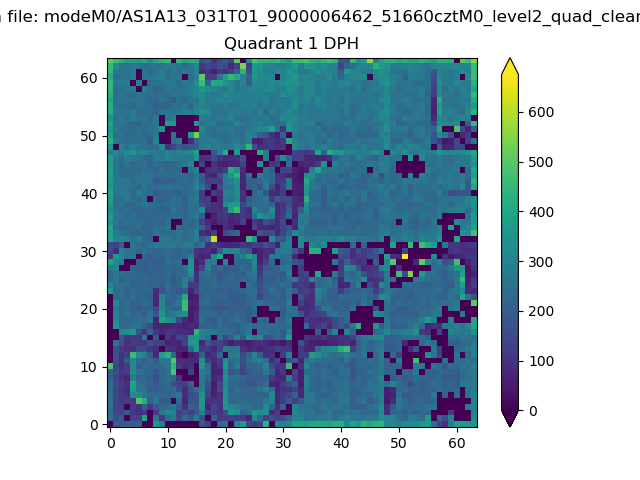 |
Quadrant B |
|---|---|---|---|
| Quadrant D | 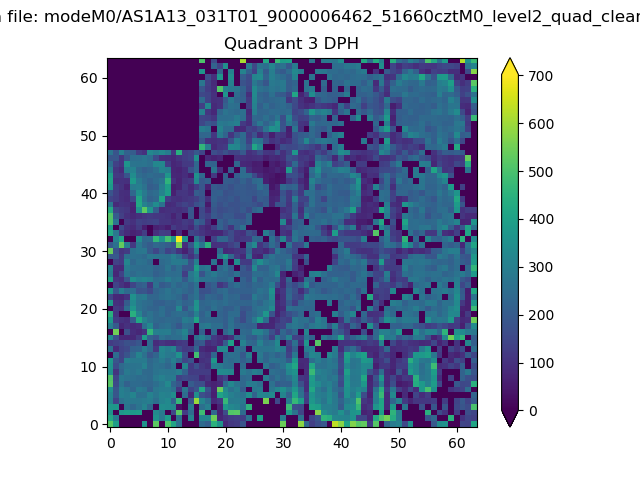 |
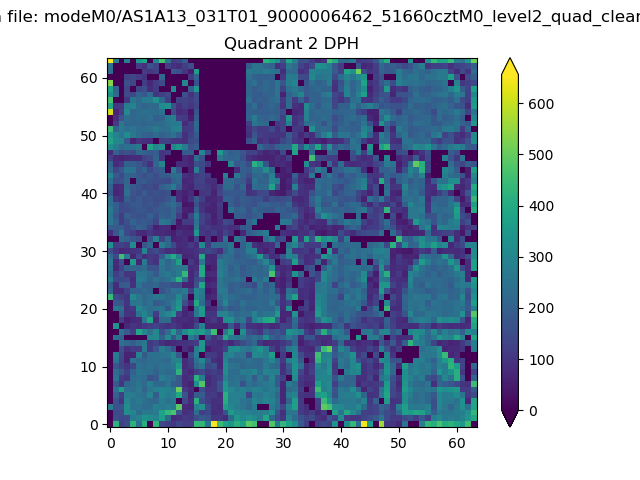 |
Quadrant C |
| Plot type | Count rate plots | Images |
|---|---|---|
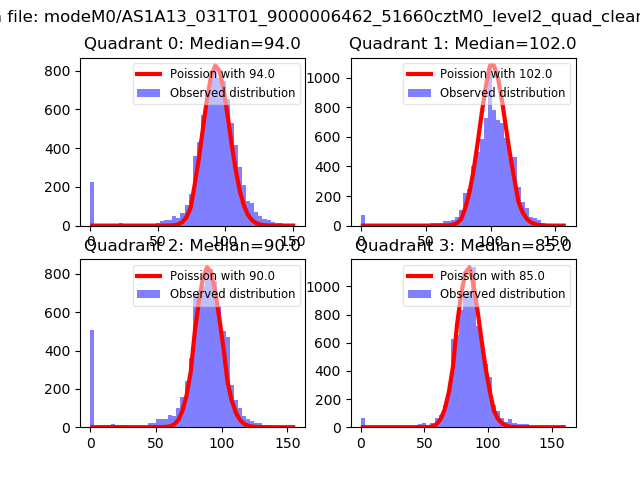
| Comparison with Poisson distribution Blue bars denote a histogram of data divided into 1 sec bins. Red curve is a Poisson curve with rate = median count rate of data. |
 |
 |
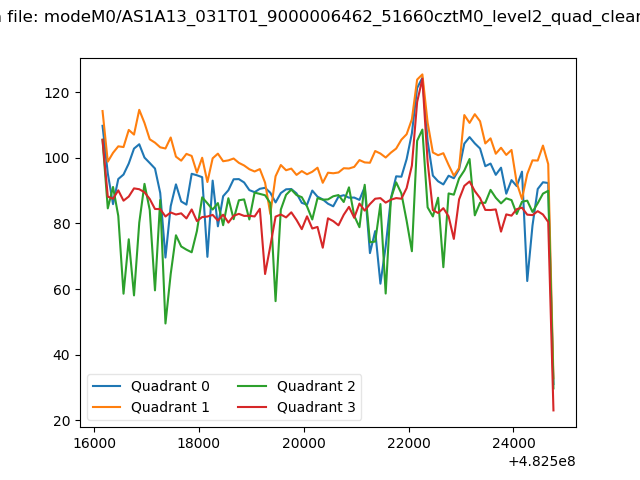
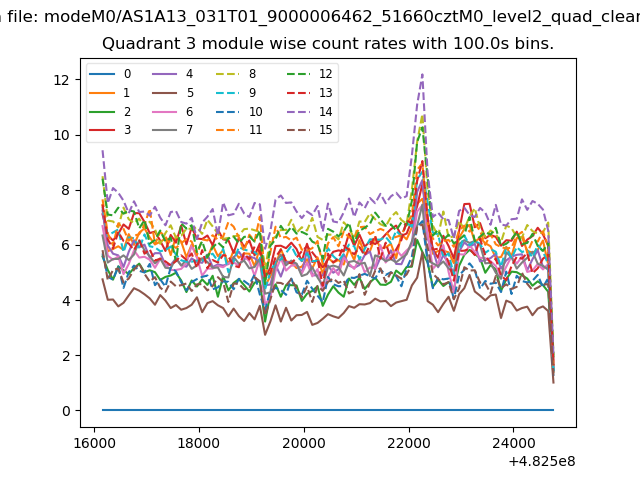
| Quadrant-wise count rates Data is divided into 100 sec bins |
 |
|
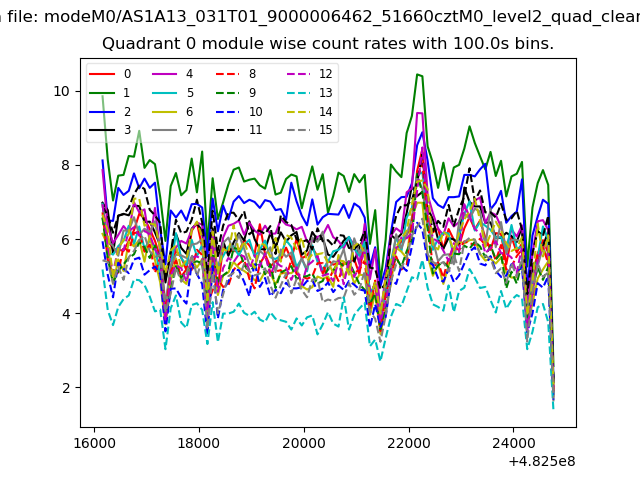
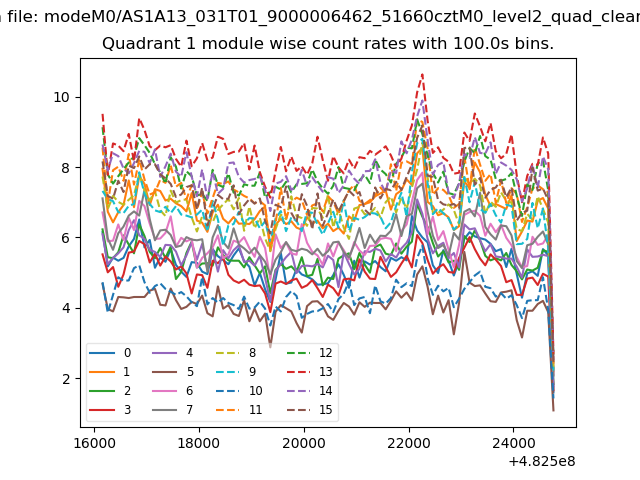
| Module-wise count rates for Quadrant A Data is divided into 100 sec bins |
 |
 |
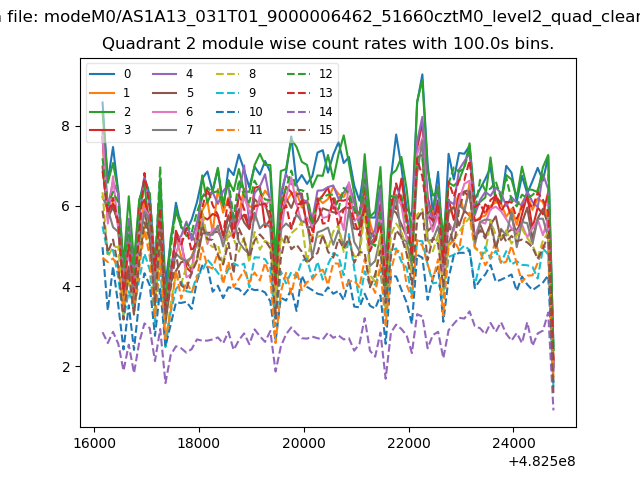
| Module-wise count rates for Quadrant B Data is divided into 100 sec bins |
 |
 |
| Module-wise count rates for Quadrant C Data is divided into 100 sec bins |
 |
 |
| Module-wise count rates for Quadrant D Data is divided into 100 sec bins |
 |
 |
| Parameter | Plot |
|---|---|
| CZT HV Monitor | 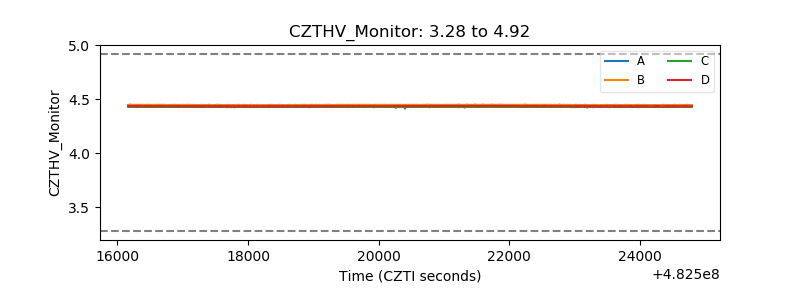 |
| D_VDD | 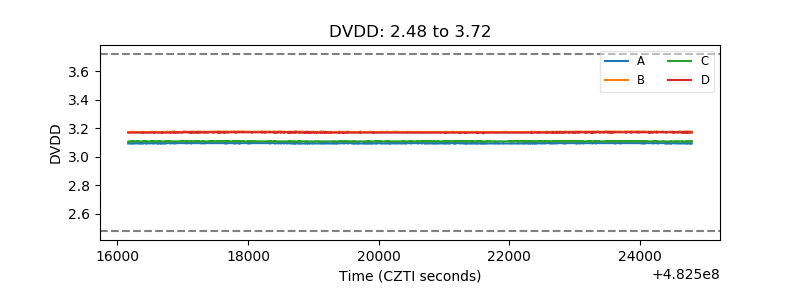 |
| Temperature 1 | 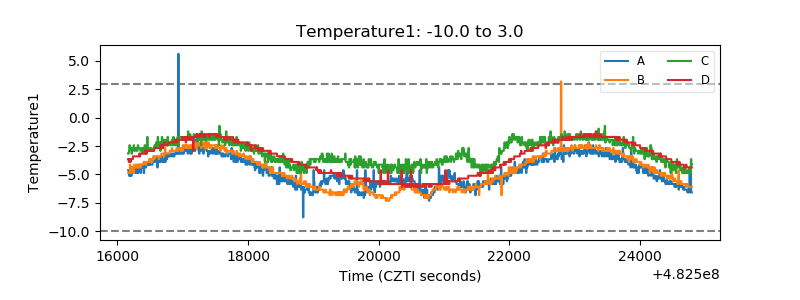 |
| Veto HV Monitor | 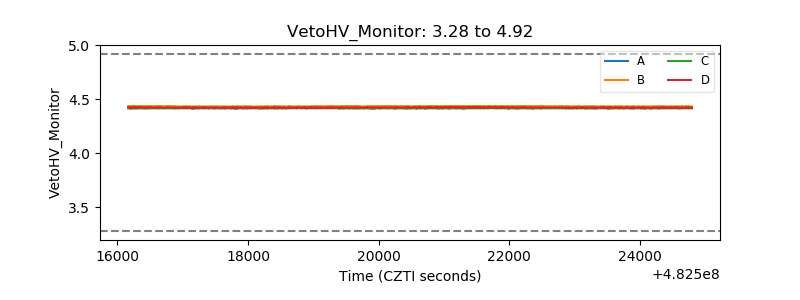 |
| Veto LLD | 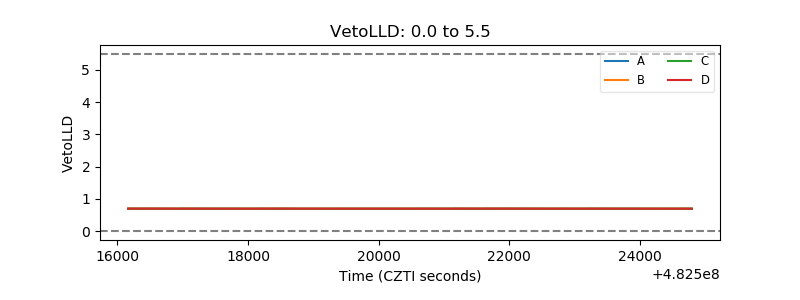 |
| Alpha Counter | 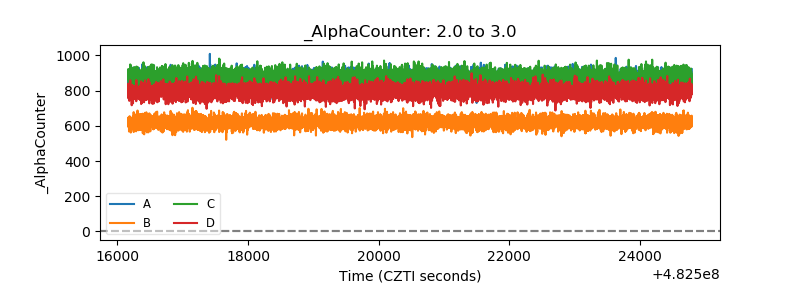 |
| _CPM_Rate | 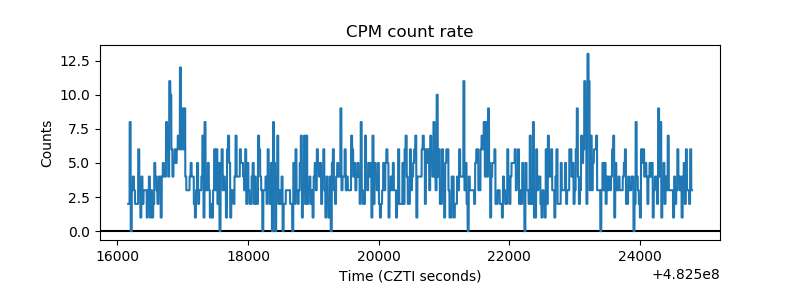 |
| CZT Counter | 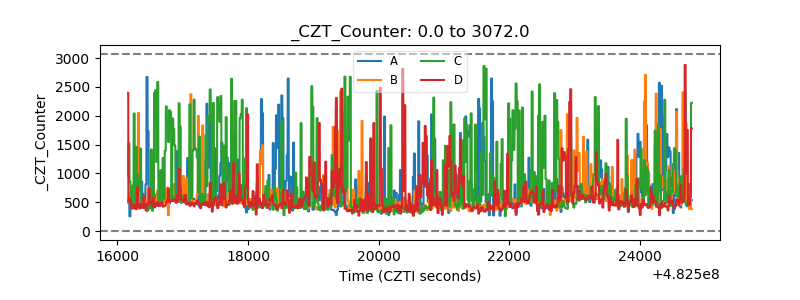 |
| +2.5 Volts monitor | 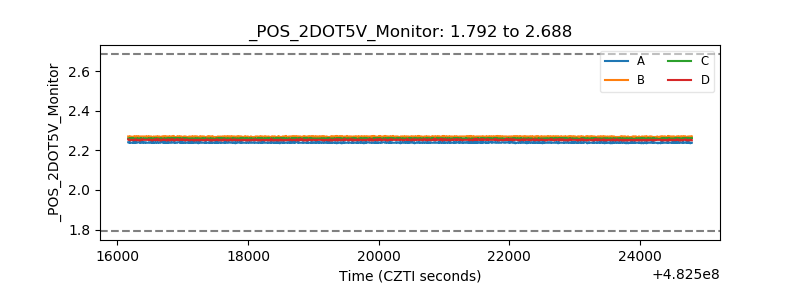 |
| +5 Volts monitor | 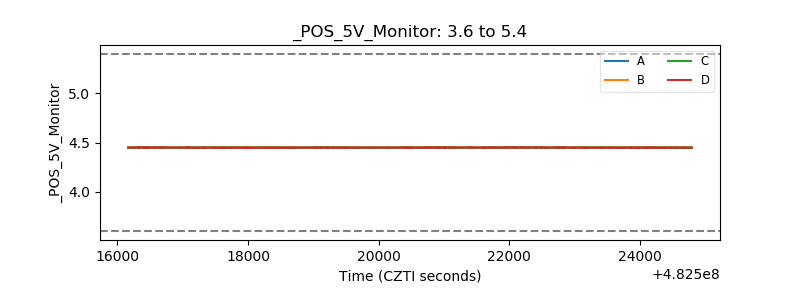 |
| _ROLL_ROT | 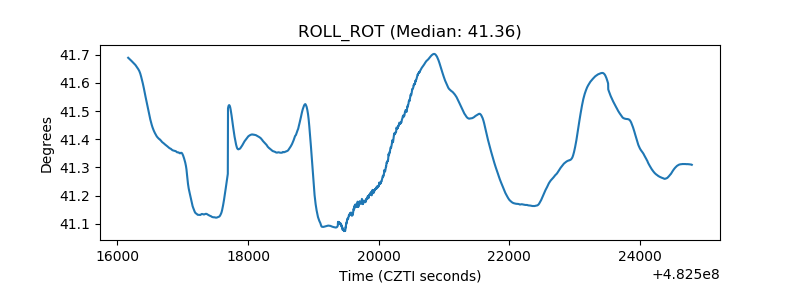 |
| _Roll_DEC | 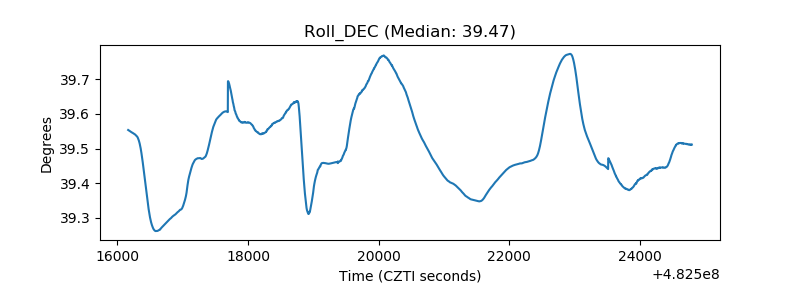 |
| _Roll_RA | 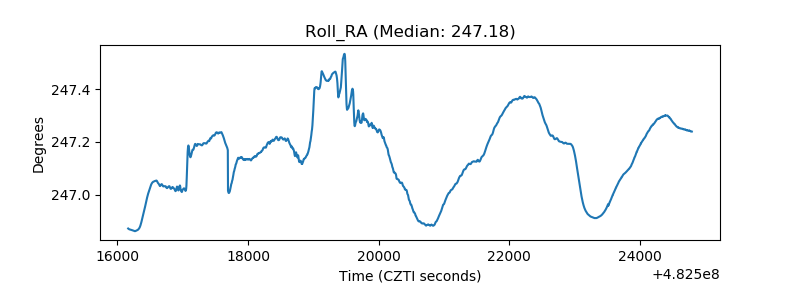 |
| Veto Counter | 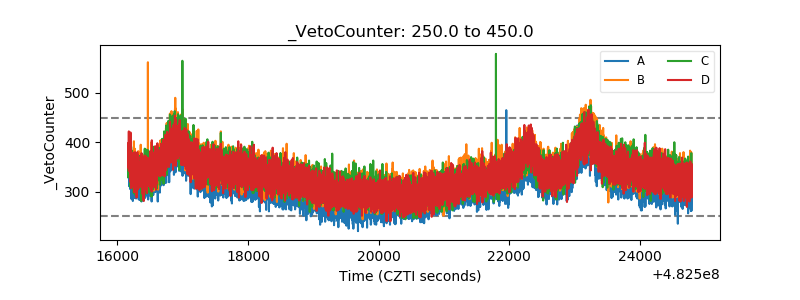 |