| Param | Original file | Final file |
|---|---|---|
| Filename | modeM0/AS1A13_031T01_9000006462_51663cztM0_level2.fits | modeM0/AS1A13_031T01_9000006462_51663cztM0_level2_quad_clean.evt |
| Size (bytes) | 1,628,838,720 | 281,286,720 |
| Size | 1.5 GB | 268.3 MB |
| Events in quadrant A | 14,875,979 | 1,778,688 |
| Events in quadrant B | 12,843,794 | 2,008,351 |
| Events in quadrant C | 16,177,483 | 1,724,033 |
| Events in quadrant D | 14,841,415 | 1,617,830 |
| Mode M9 | |||
|---|---|---|---|
| Quadrant | BADHDUFLAG | Total packets | Discarded packets |
| A | 0 | 8 | 0 |
| B | 0 | 8 | 0 |
| C | 0 | 8 | 0 |
| D | 0 | 8 | 0 |
| Mode M0 | |||
|---|---|---|---|
| Quadrant | BADHDUFLAG | Total packets | Discarded packets |
| A | 0 | 58456 | 2 |
| B | 0 | 52351 | 2 |
| C | 0 | 62289 | 2 |
| D | 0 | 58630 | 2 |
| Mode SS | |||
|---|---|---|---|
| Quadrant | BADHDUFLAG | Total packets | Discarded packets |
| A | 0 | 408 | 0 |
| B | 0 | 408 | 0 |
| C | 0 | 408 | 0 |
| D | 0 | 408 | 0 |
| Quadrant | Total seconds | Saturated seconds | Saturation percentage |
|---|---|---|---|
| A | 20138 | 1623 | 8.059390% |
| B | 20139 | 748 | 3.714186% |
| C | 20139 | 1637 | 8.128507% |
| D | 20139 | 1525 | 7.572372% |
Noise dominated data is calculated using 1-second bins in cleaned event files. If a bin has >2000 counts, and if more than 50% of those come from <1% of pixels, then it is considered to be noise-dominated and hence unusable.
| Quadrant | # 1 sec bins | Bins with >0 counts | Bins with >2000 counts | High rate bins dominated by noise | Noise dominated (total time) | Noise dominated (detector-on time) | Marked lightcurve |
|---|---|---|---|---|---|---|---|
| A | 20988 | 20140 | 1205 | 1205 | 5.74% | 5.98% | 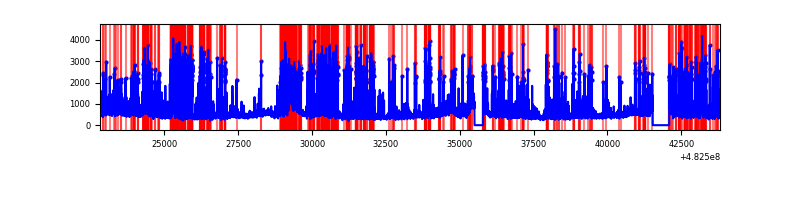 |
| B | 20989 | 20140 | 316 | 316 | 1.51% | 1.57% | 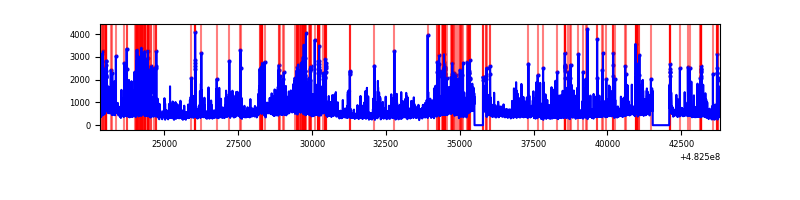 |
| C | 20989 | 20141 | 1397 | 1397 | 6.66% | 6.94% | 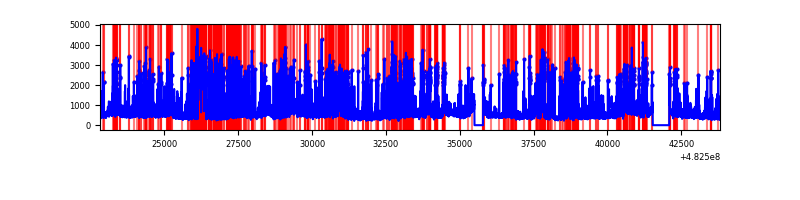 |
| D | 20989 | 20141 | 1302 | 1302 | 6.20% | 6.46% | 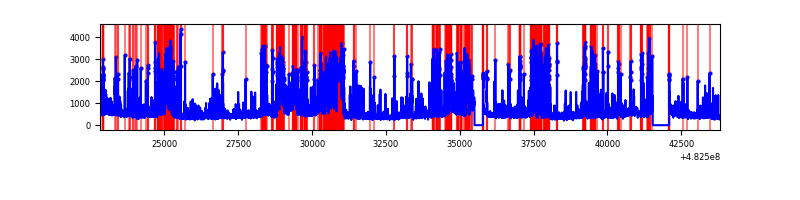 |
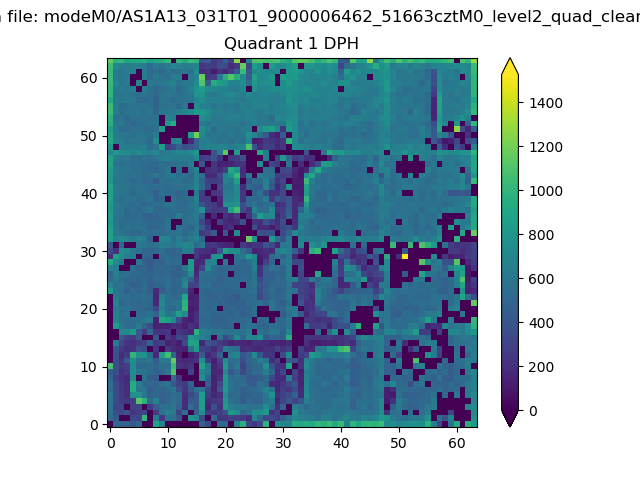
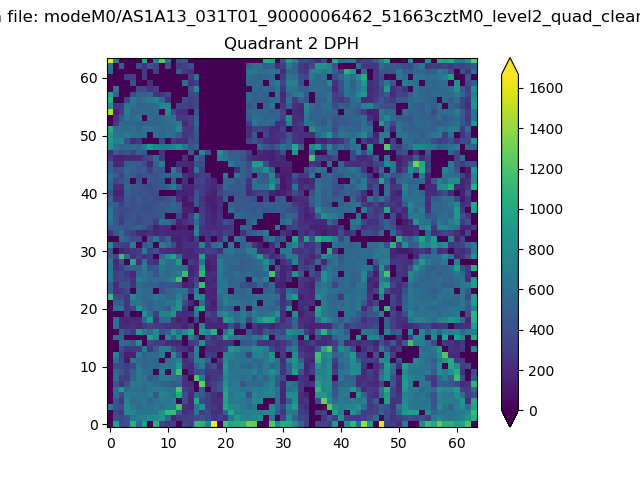
Top three noisy pixels from each quadrant. If the there are fewer than three noisy pixels in the level2.evt file, extra rows are filled as -1
| Pixel properties | Quadrant properties | ||||||
|---|---|---|---|---|---|---|---|
| Quadrant | DetID | PixID | Counts | Sigma | Mean | Median | Sigma |
| A | 7 | 64 | 4753704 | 9196.67 | 2104 | 2054 | 516.7 |
| A | 12 | 250 | 445860 | 858.97 | 2104 | 2054 | 516.7 |
| A | 13 | 248 | 359189 | 691.22 | 2104 | 2054 | 516.7 |
| B | 1 | 207 | 763537 | 1673.95 | 2136 | 2060 | 454.9 |
| B | 1 | 223 | 637869 | 1397.7 | 2136 | 2060 | 454.9 |
| B | 4 | 170 | 449286 | 983.14 | 2136 | 2060 | 454.9 |
| C | 15 | 189 | 1519286 | 2635.63 | 2083 | 2066 | 575.7 |
| C | 12 | 254 | 1286906 | 2231.95 | 2083 | 2066 | 575.7 |
| C | 14 | 245 | 1224993 | 2124.4 | 2083 | 2066 | 575.7 |
| D | 7 | 60 | 2808585 | 4834.28 | 2062 | 1991 | 580.6 |
| D | 2 | 249 | 1189932 | 2046.19 | 2062 | 1991 | 580.6 |
| D | 6 | 42 | 427634 | 733.16 | 2062 | 1991 | 580.6 |
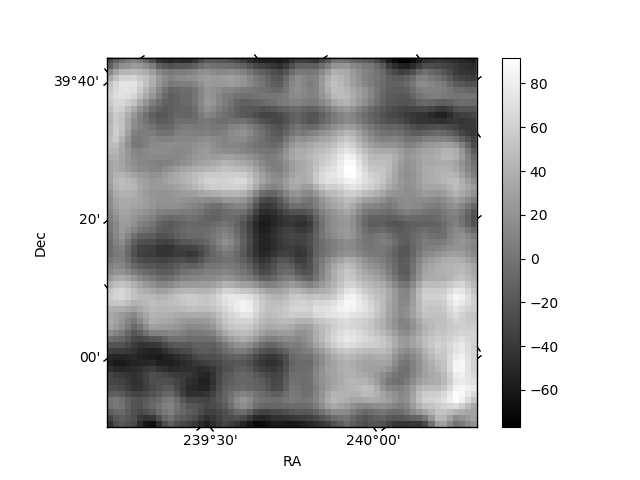
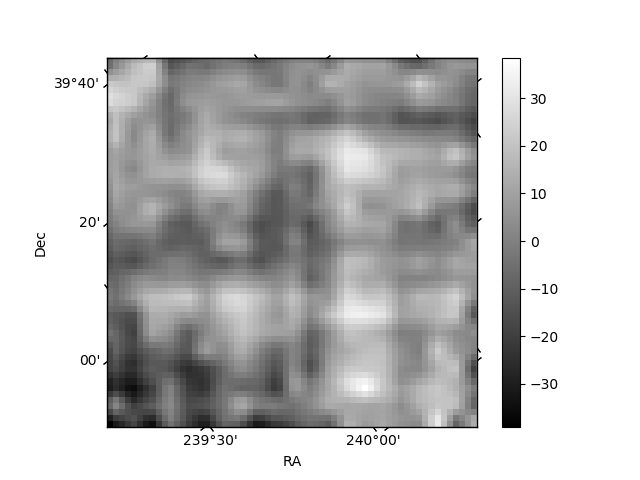
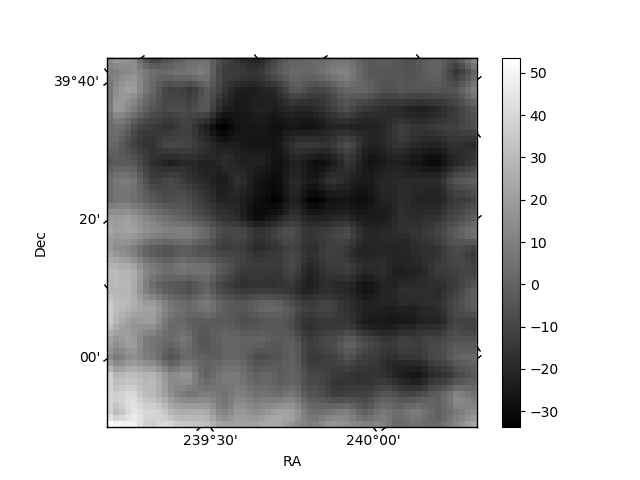
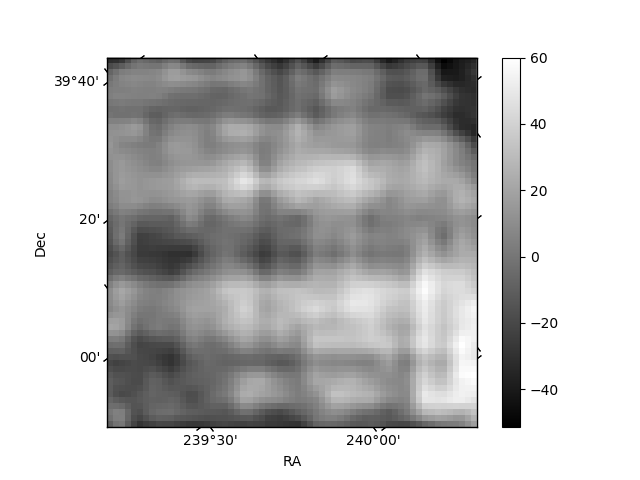
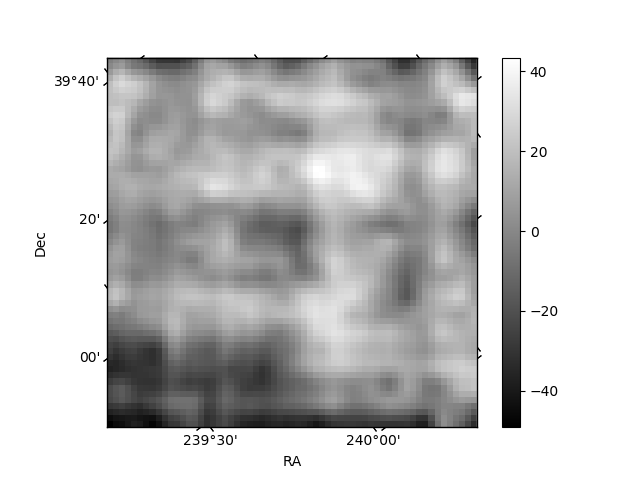
Histogram calculated using DETX and DETY for each event in the final _common_clean file
| Quadrant A | 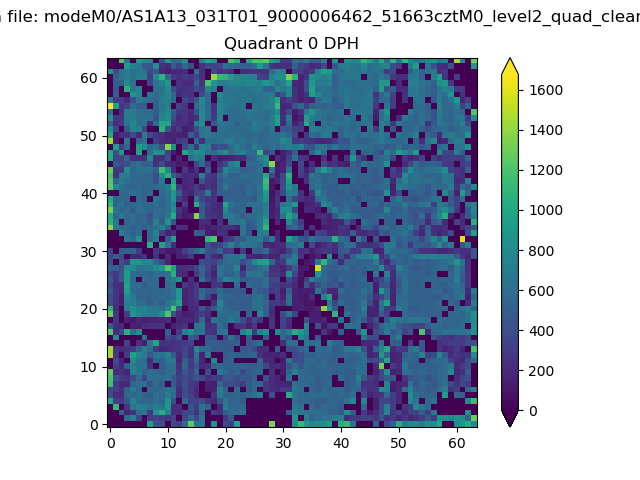 |
 |
Quadrant B |
|---|---|---|---|
| Quadrant D | 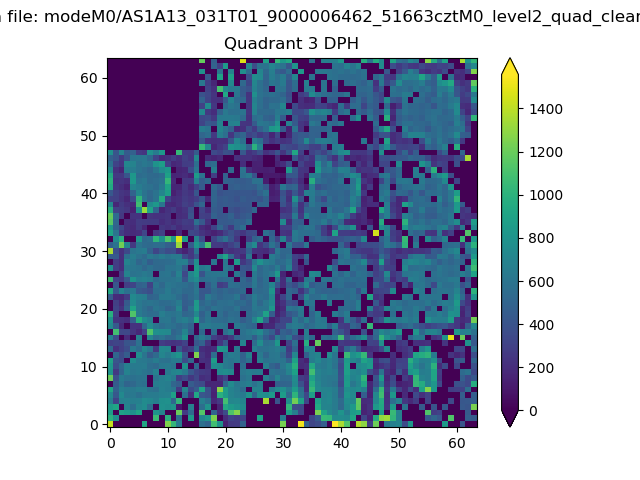 |
 |
Quadrant C |
| Plot type | Count rate plots | Images |
|---|---|---|
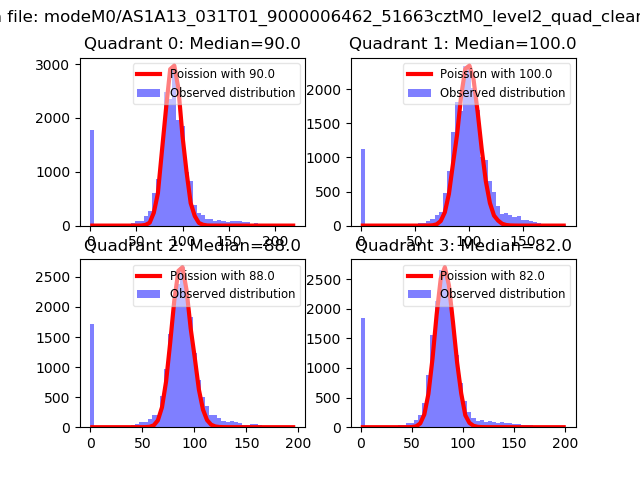
| Comparison with Poisson distribution Blue bars denote a histogram of data divided into 1 sec bins. Red curve is a Poisson curve with rate = median count rate of data. |
 |
 |
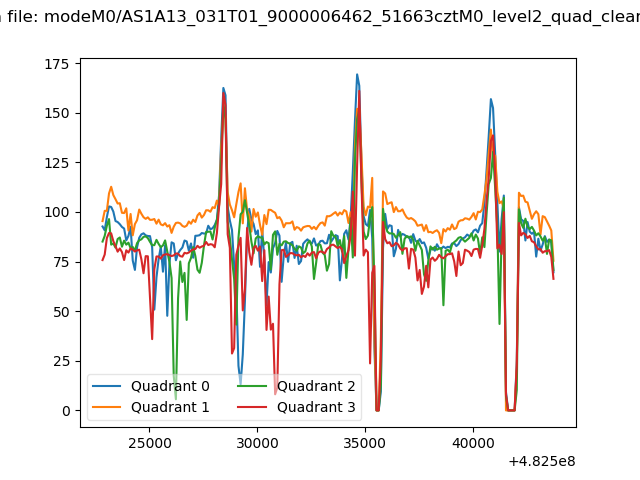
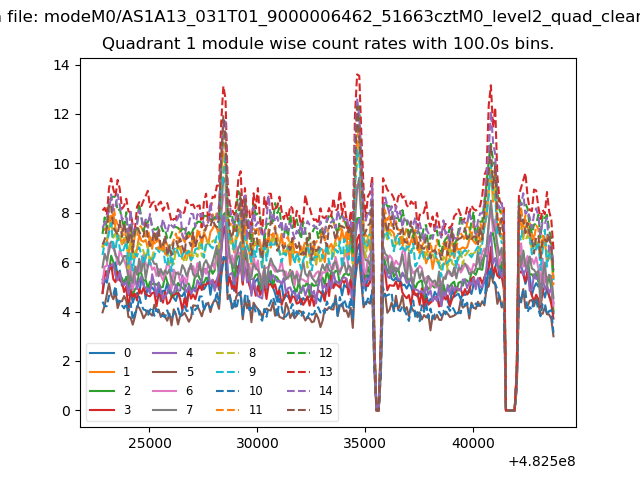
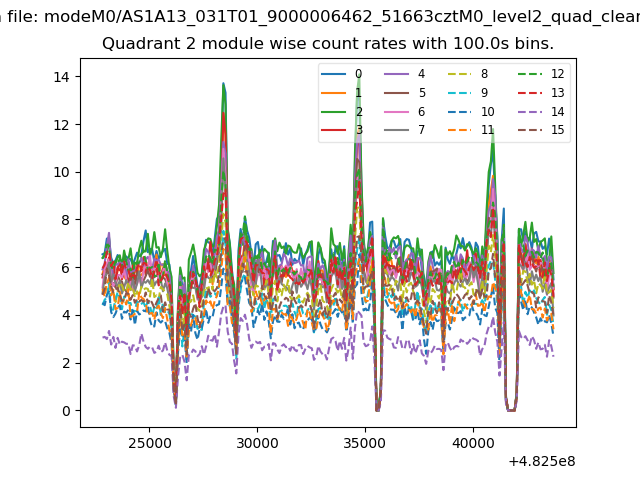
| Quadrant-wise count rates Data is divided into 100 sec bins |
 |
|
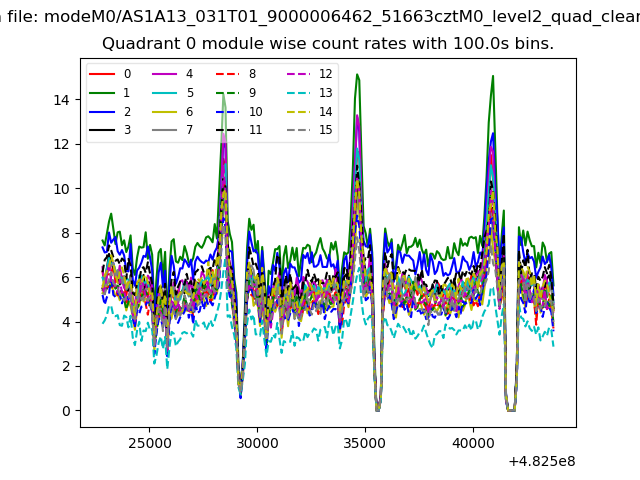
| Module-wise count rates for Quadrant A Data is divided into 100 sec bins |
 |
 |
| Module-wise count rates for Quadrant B Data is divided into 100 sec bins |
 |
 |
| Module-wise count rates for Quadrant C Data is divided into 100 sec bins |
 |
 |
| Module-wise count rates for Quadrant D Data is divided into 100 sec bins |
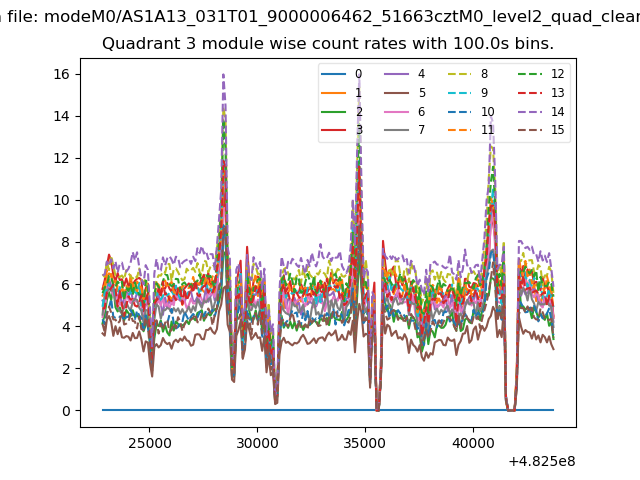 |
 |
| Parameter | Plot |
|---|---|
| CZT HV Monitor | 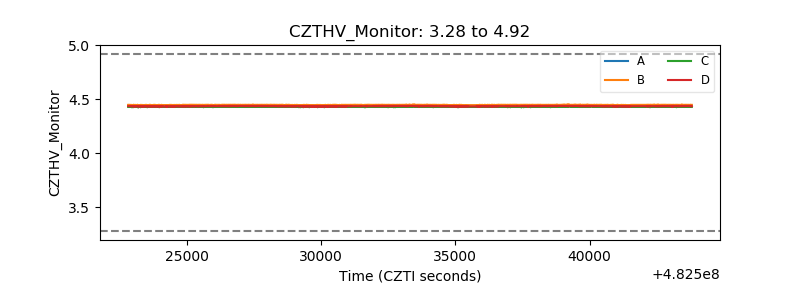 |
| D_VDD | 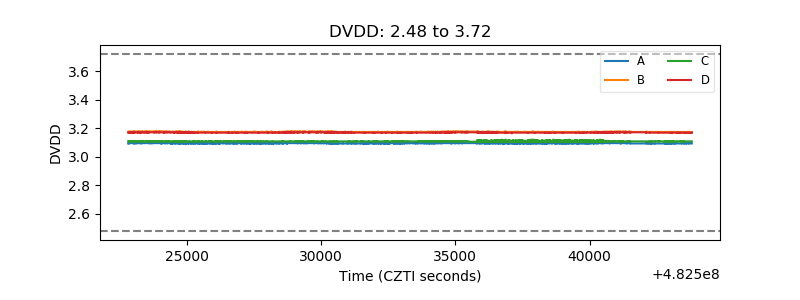 |
| Temperature 1 | 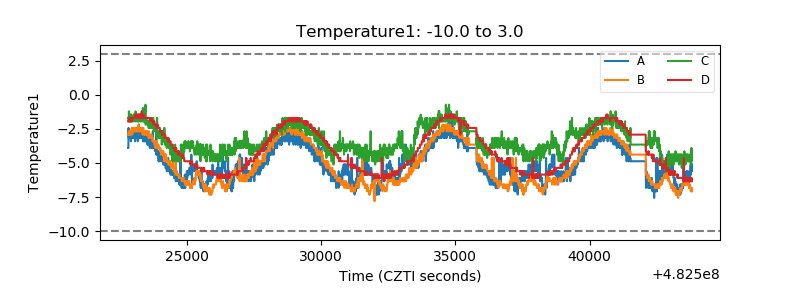 |
| Veto HV Monitor | 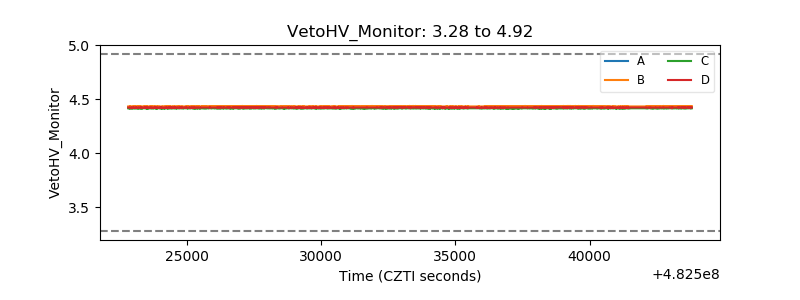 |
| Veto LLD | 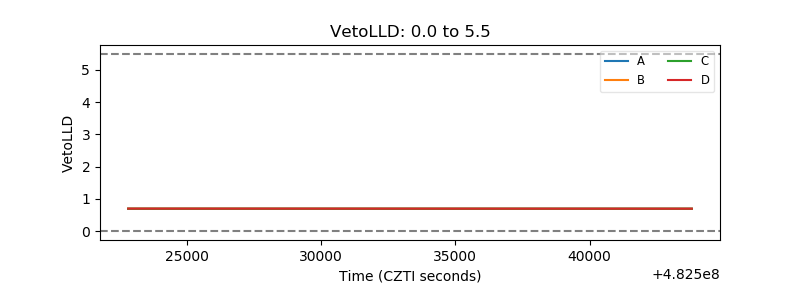 |
| Alpha Counter | 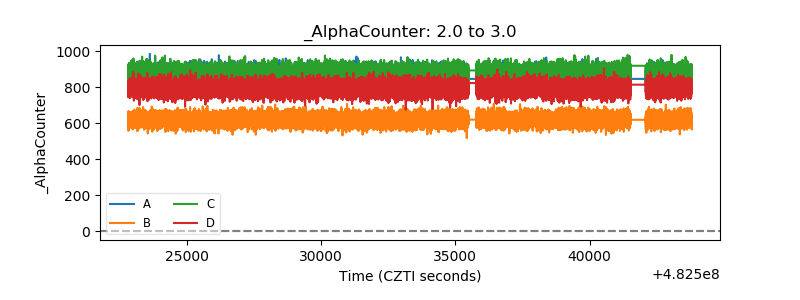 |
| _CPM_Rate | 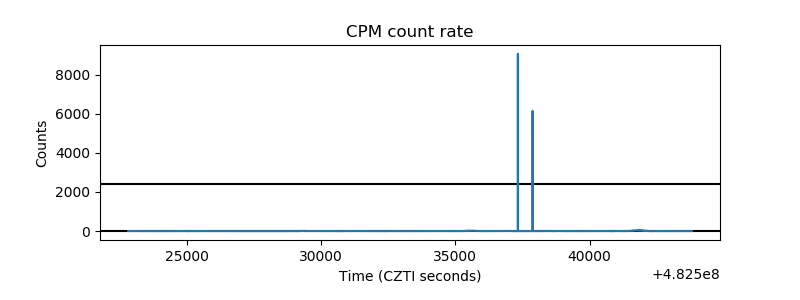 |
| CZT Counter | 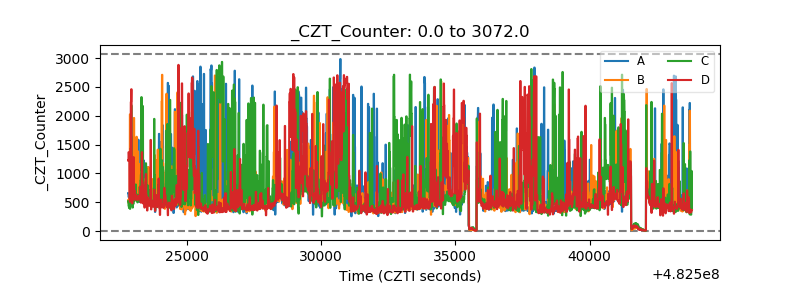 |
| +2.5 Volts monitor | 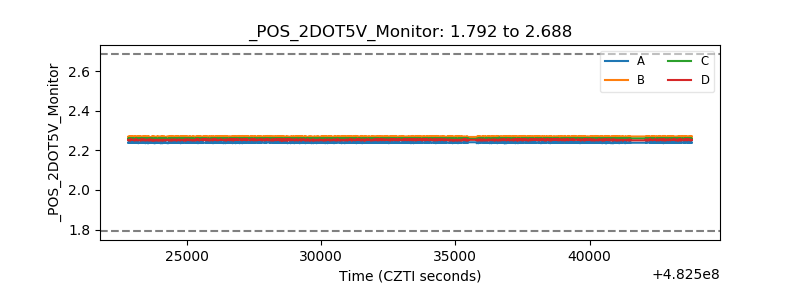 |
| +5 Volts monitor | 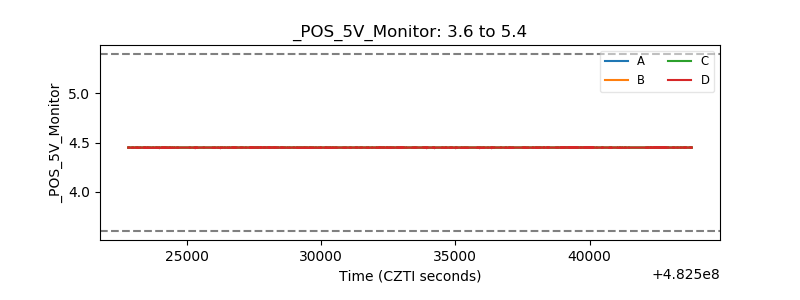 |
| _ROLL_ROT | 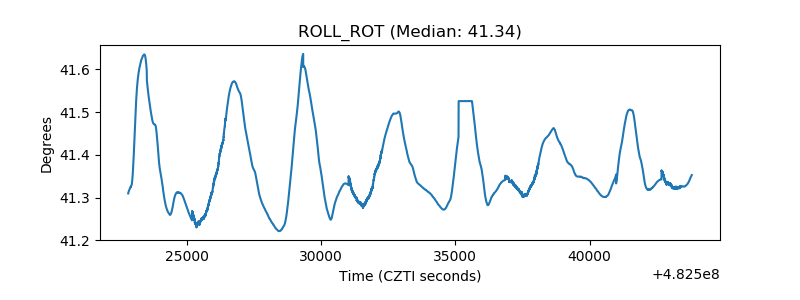 |
| _Roll_DEC | 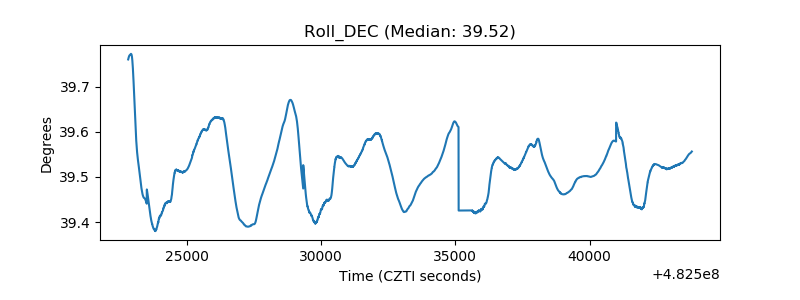 |
| _Roll_RA | 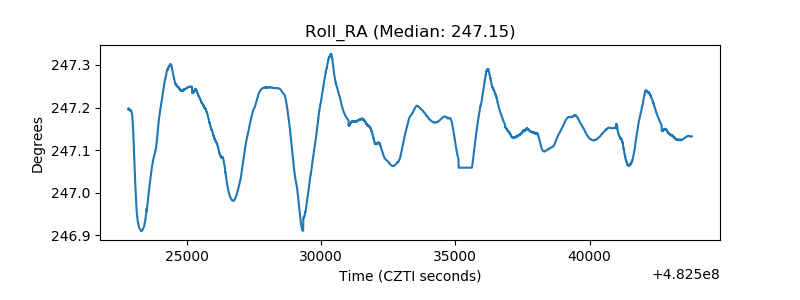 |
| Veto Counter | 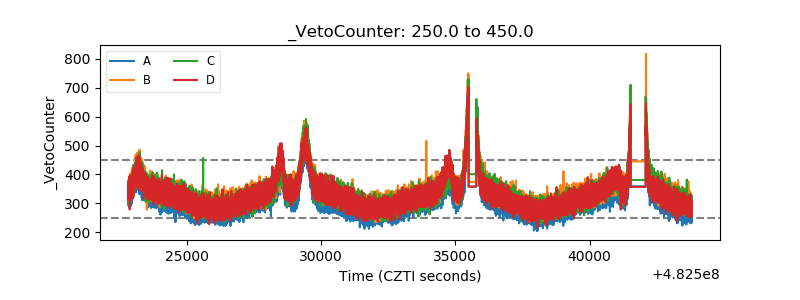 |