| Param | Original file | Final file |
|---|---|---|
| Filename | modeM0/AS1A13_031T01_9000006462_51664cztM0_level2.fits | modeM0/AS1A13_031T01_9000006462_51664cztM0_level2_quad_clean.evt |
| Size (bytes) | 565,009,920 | 101,275,200 |
| Size | 538.8 MB | 96.6 MB |
| Events in quadrant A | 5,795,298 | 631,293 |
| Events in quadrant B | 4,969,704 | 685,256 |
| Events in quadrant C | 5,780,542 | 624,743 |
| Events in quadrant D | 3,811,540 | 624,398 |
| Mode M9 | |||
|---|---|---|---|
| Quadrant | BADHDUFLAG | Total packets | Discarded packets |
| A | 0 | 12 | 0 |
| B | 0 | 12 | 0 |
| C | 0 | 12 | 0 |
| D | 0 | 12 | 0 |
| Mode M0 | |||
|---|---|---|---|
| Quadrant | BADHDUFLAG | Total packets | Discarded packets |
| A | 0 | 22345 | 2 |
| B | 0 | 19851 | 3 |
| C | 0 | 22272 | 2 |
| D | 0 | 16725 | 2 |
| Mode SS | |||
|---|---|---|---|
| Quadrant | BADHDUFLAG | Total packets | Discarded packets |
| A | 0 | 150 | 0 |
| B | 0 | 150 | 0 |
| C | 0 | 150 | 0 |
| D | 0 | 150 | 0 |
| Quadrant | Total seconds | Saturated seconds | Saturation percentage |
|---|---|---|---|
| A | 7184 | 697 | 9.702116% |
| B | 7183 | 556 | 7.740498% |
| C | 7184 | 643 | 8.950445% |
| D | 7184 | 164 | 2.282851% |
Noise dominated data is calculated using 1-second bins in cleaned event files. If a bin has >2000 counts, and if more than 50% of those come from <1% of pixels, then it is considered to be noise-dominated and hence unusable.
| Quadrant | # 1 sec bins | Bins with >0 counts | Bins with >2000 counts | High rate bins dominated by noise | Noise dominated (total time) | Noise dominated (detector-on time) | Marked lightcurve |
|---|---|---|---|---|---|---|---|
| A | 8504 | 7186 | 577 | 577 | 6.79% | 8.03% | 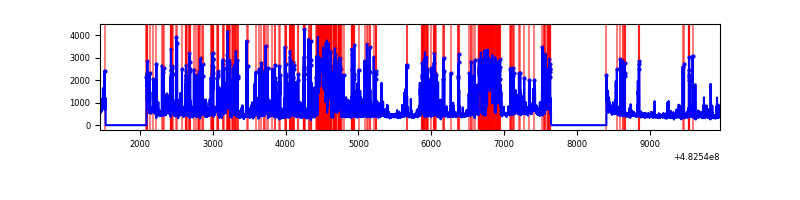 |
| B | 8503 | 7184 | 322 | 322 | 3.79% | 4.48% | 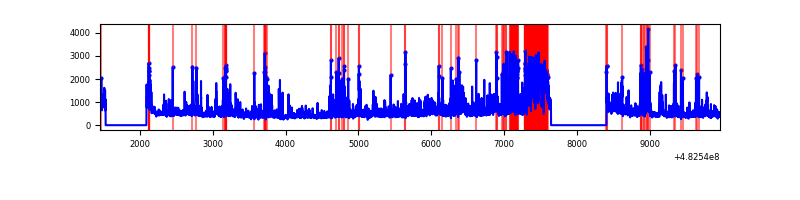 |
| C | 8504 | 7186 | 522 | 522 | 6.14% | 7.26% | 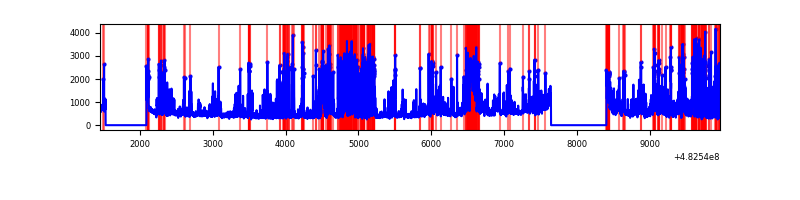 |
| D | 8504 | 7186 | 130 | 130 | 1.53% | 1.81% | 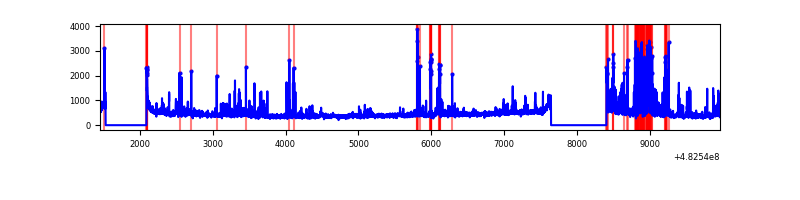 |
Top three noisy pixels from each quadrant. If the there are fewer than three noisy pixels in the level2.evt file, extra rows are filled as -1
| Pixel properties | Quadrant properties | ||||||
|---|---|---|---|---|---|---|---|
| Quadrant | DetID | PixID | Counts | Sigma | Mean | Median | Sigma |
| A | 7 | 64 | 1972393 | 10669.11 | 736 | 716 | 184.8 |
| A | 13 | 248 | 520795 | 2814.25 | 736 | 716 | 184.8 |
| A | 12 | 3 | 86917 | 466.45 | 736 | 716 | 184.8 |
| B | 1 | 223 | 667533 | 4177.07 | 734 | 707 | 159.6 |
| B | 1 | 207 | 214967 | 1342.15 | 734 | 707 | 159.6 |
| B | 12 | 32 | 213380 | 1332.21 | 734 | 707 | 159.6 |
| C | 15 | 189 | 1147387 | 5794.85 | 727 | 724 | 197.9 |
| C | 14 | 245 | 861029 | 4347.69 | 727 | 724 | 197.9 |
| C | 12 | 254 | 268949 | 1355.52 | 727 | 724 | 197.9 |
| D | 2 | 249 | 424076 | 2043.15 | 736 | 709 | 207.2 |
| D | 8 | 176 | 202087 | 971.84 | 736 | 709 | 207.2 |
| D | 5 | 173 | 60716 | 289.59 | 736 | 709 | 207.2 |
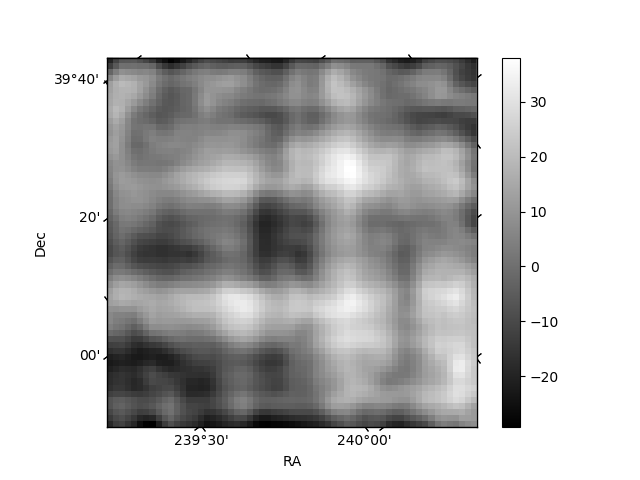
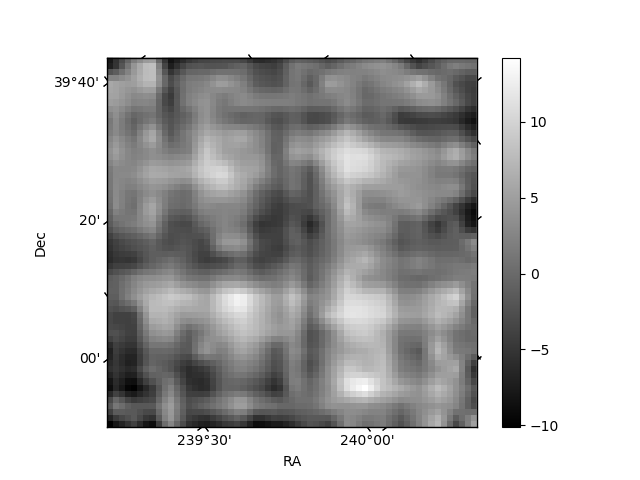
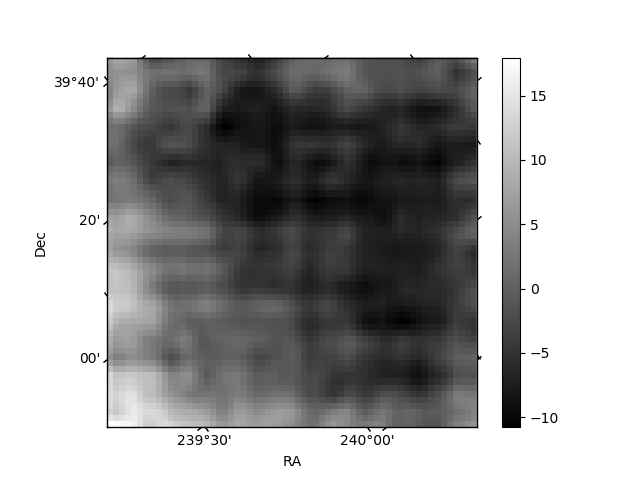
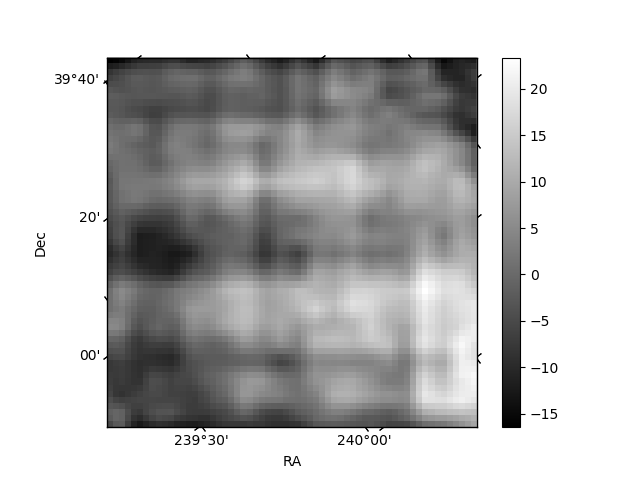
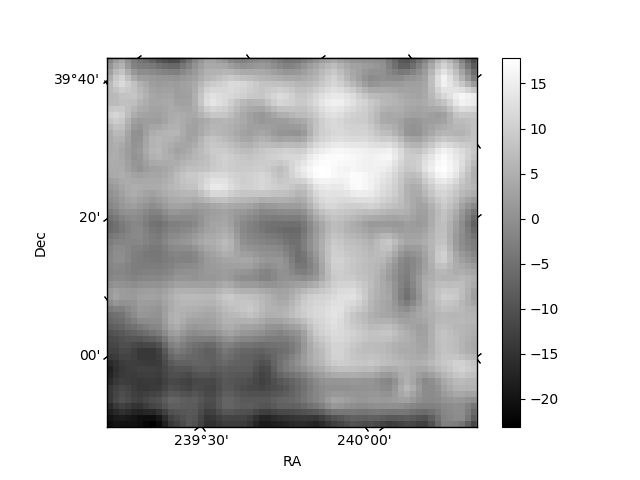
Histogram calculated using DETX and DETY for each event in the final _common_clean file
| Quadrant A | 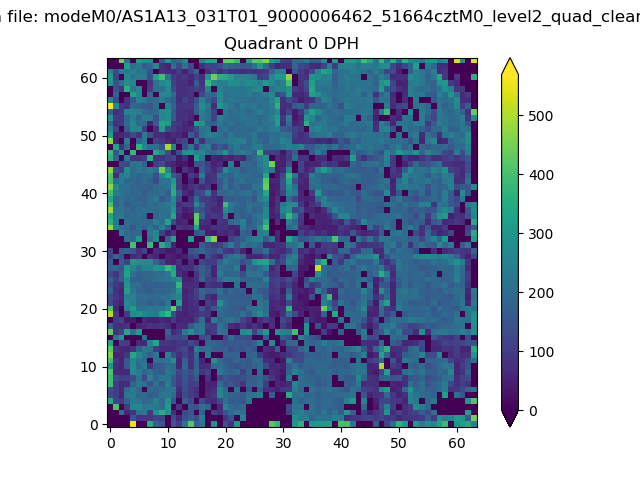 |
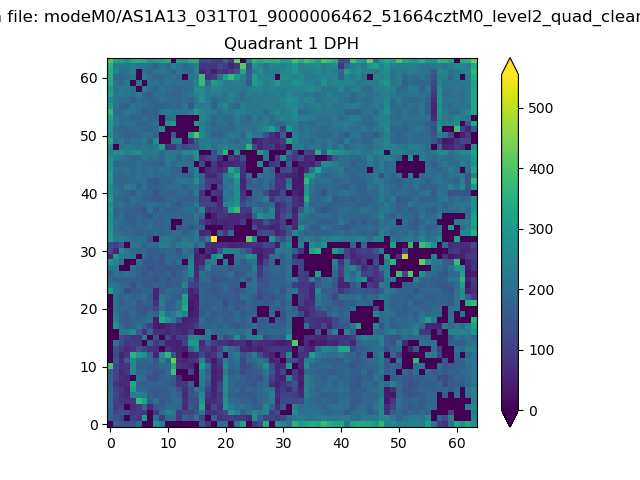 |
Quadrant B |
|---|---|---|---|
| Quadrant D | 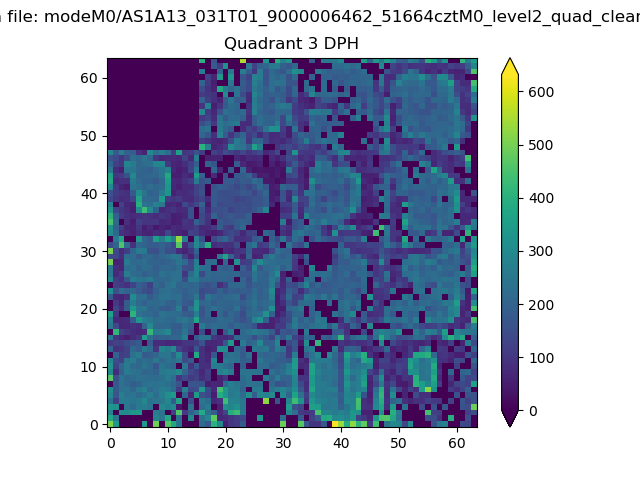 |
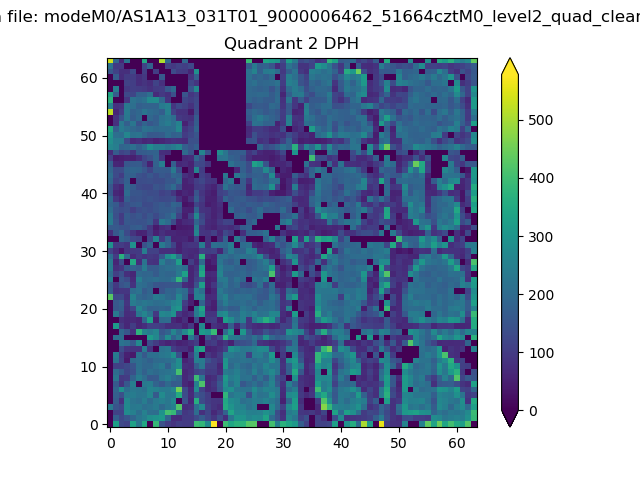 |
Quadrant C |
| Plot type | Count rate plots | Images |
|---|---|---|
| Comparison with Poisson distribution Blue bars denote a histogram of data divided into 1 sec bins. Red curve is a Poisson curve with rate = median count rate of data. |
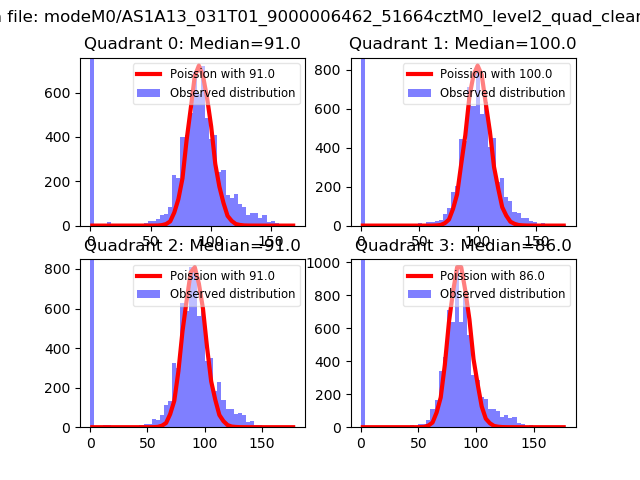 |
 |
| Quadrant-wise count rates Data is divided into 100 sec bins |
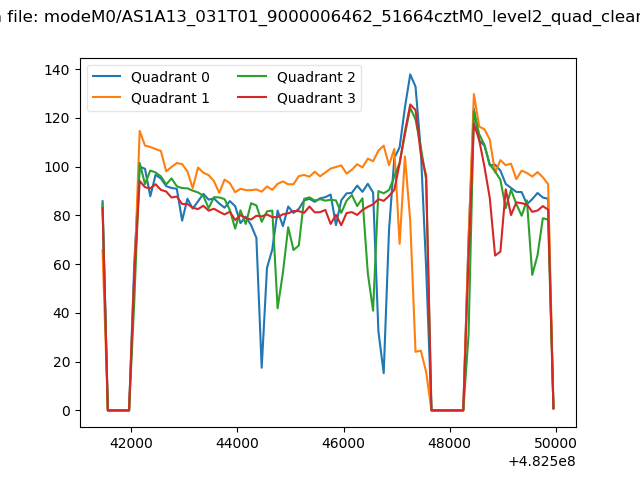 |
|
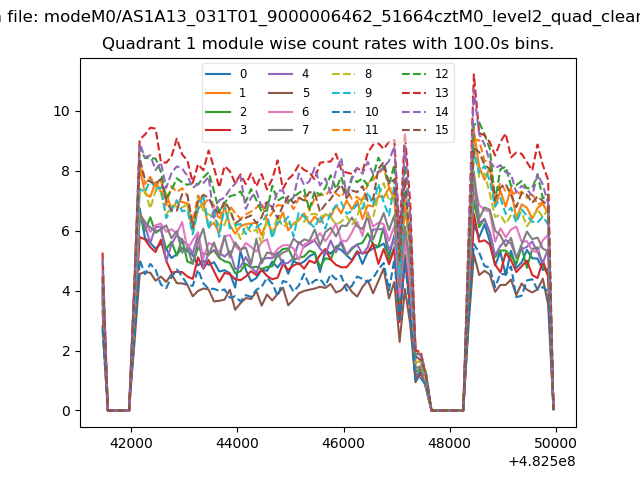
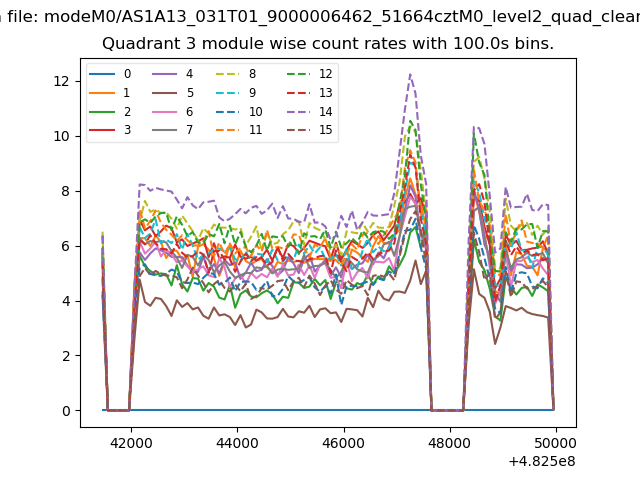
| Module-wise count rates for Quadrant A Data is divided into 100 sec bins |
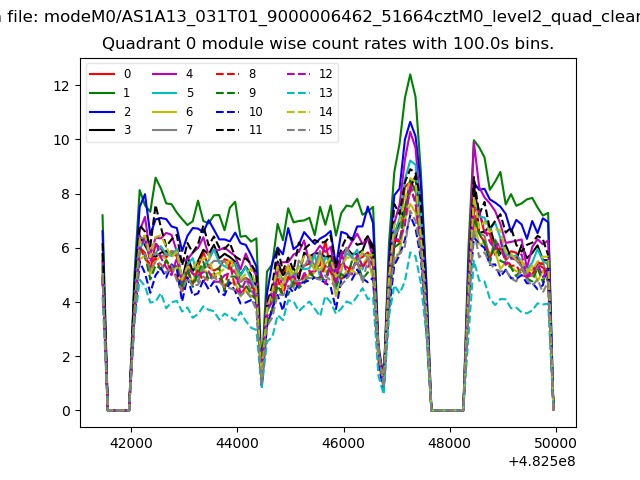 |
 |
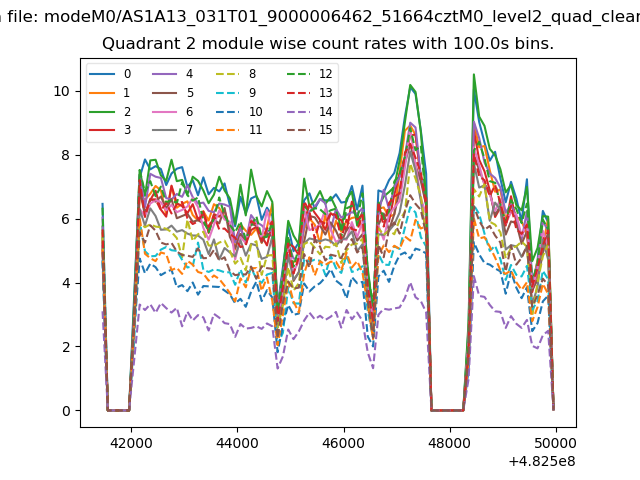
| Module-wise count rates for Quadrant B Data is divided into 100 sec bins |
 |
 |
| Module-wise count rates for Quadrant C Data is divided into 100 sec bins |
 |
 |
| Module-wise count rates for Quadrant D Data is divided into 100 sec bins |
 |
 |
| Parameter | Plot |
|---|---|
| CZT HV Monitor | 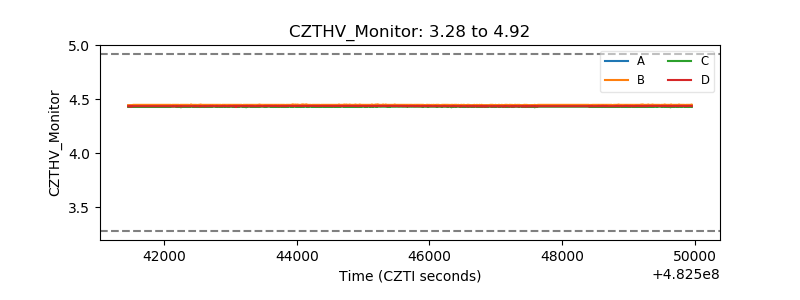 |
| D_VDD | 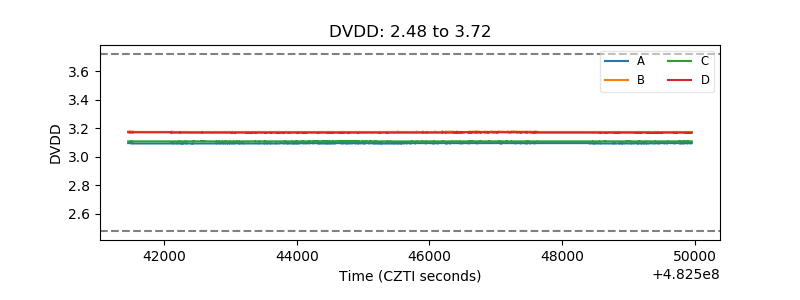 |
| Temperature 1 | 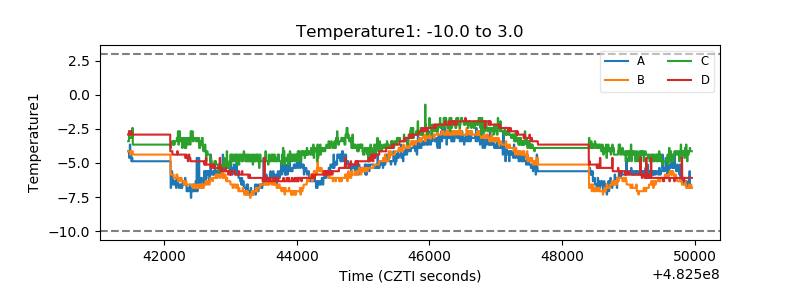 |
| Veto HV Monitor | 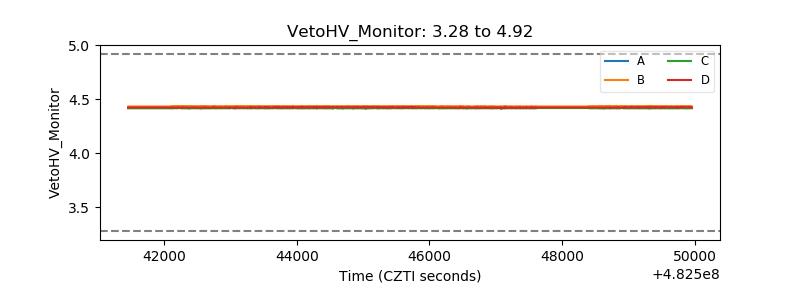 |
| Veto LLD | 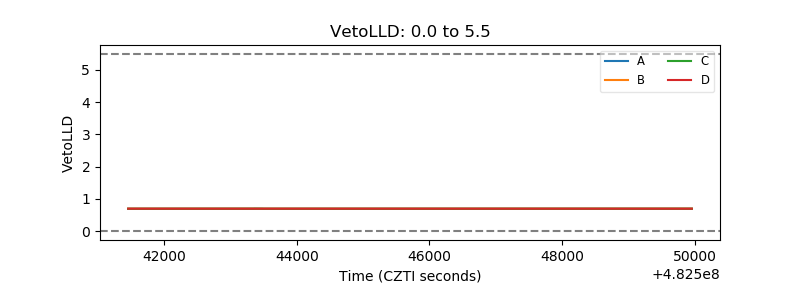 |
| Alpha Counter | 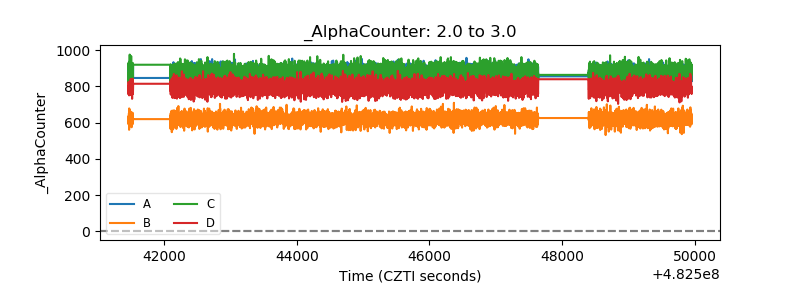 |
| _CPM_Rate | 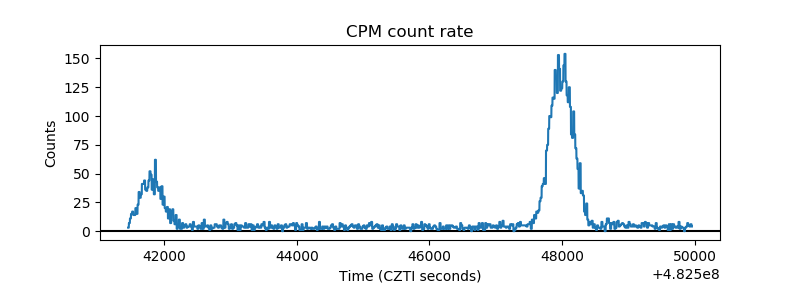 |
| CZT Counter | 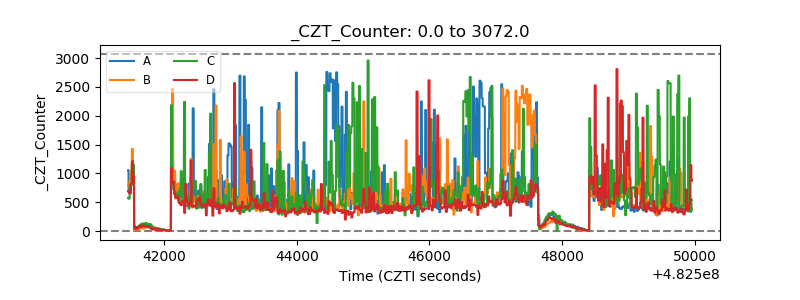 |
| +2.5 Volts monitor | 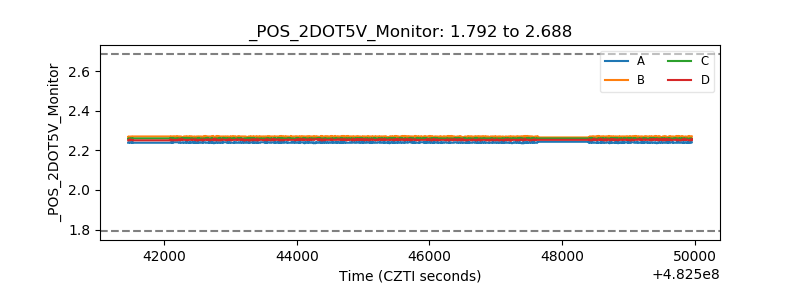 |
| +5 Volts monitor | 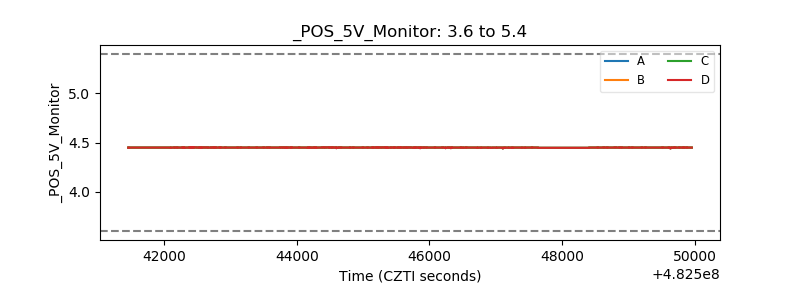 |
| _ROLL_ROT | 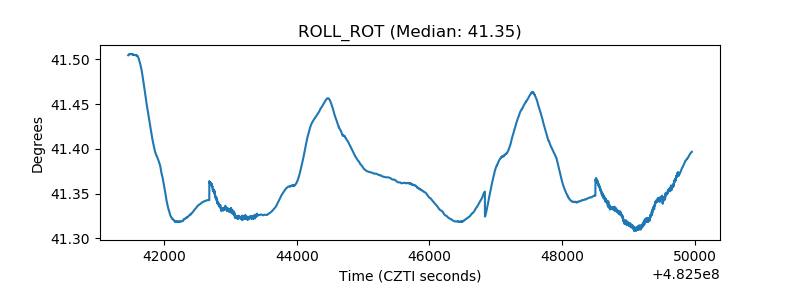 |
| _Roll_DEC | 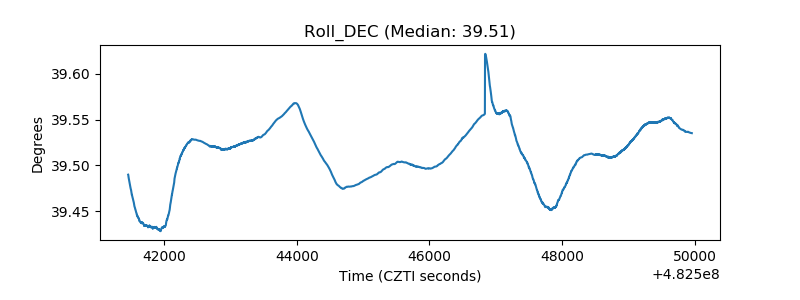 |
| _Roll_RA | 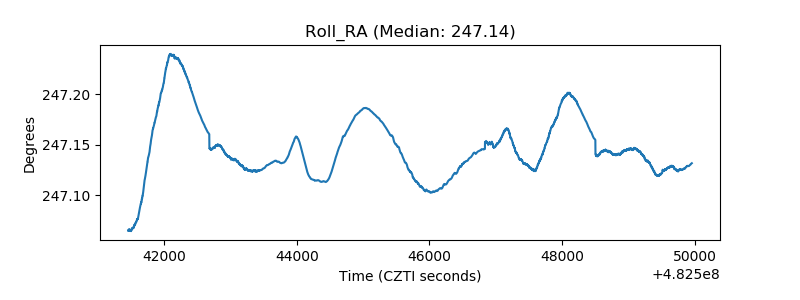 |
| Veto Counter | 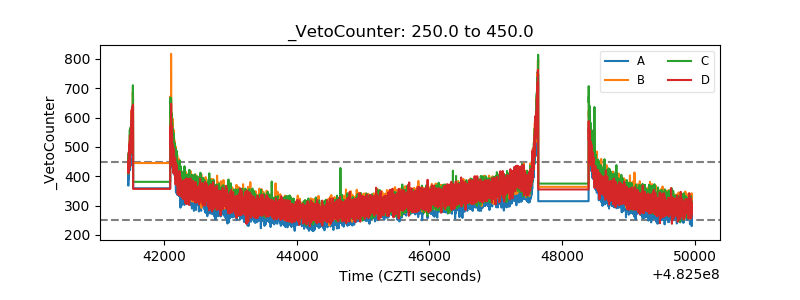 |