| Param | Original file | Final file |
|---|---|---|
| Filename | modeM0/AS1A13_031T01_9000006462_51665cztM0_level2.fits | modeM0/AS1A13_031T01_9000006462_51665cztM0_level2_quad_clean.evt |
| Size (bytes) | 519,226,560 | 96,347,520 |
| Size | 495.2 MB | 91.9 MB |
| Events in quadrant A | 4,029,724 | 637,535 |
| Events in quadrant B | 4,918,085 | 659,493 |
| Events in quadrant C | 5,993,367 | 570,496 |
| Events in quadrant D | 3,758,048 | 582,318 |
| Mode M9 | |||
|---|---|---|---|
| Quadrant | BADHDUFLAG | Total packets | Discarded packets |
| A | 0 | 9 | 0 |
| B | 0 | 9 | 0 |
| C | 0 | 9 | 0 |
| D | 0 | 9 | 0 |
| Mode M0 | |||
|---|---|---|---|
| Quadrant | BADHDUFLAG | Total packets | Discarded packets |
| A | 0 | 16726 | 1 |
| B | 0 | 19302 | 1 |
| C | 0 | 22554 | 1 |
| D | 0 | 16152 | 1 |
| Mode SS | |||
|---|---|---|---|
| Quadrant | BADHDUFLAG | Total packets | Discarded packets |
| A | 0 | 136 | 0 |
| B | 0 | 136 | 0 |
| C | 0 | 136 | 0 |
| D | 0 | 136 | 0 |
| Quadrant | Total seconds | Saturated seconds | Saturation percentage |
|---|---|---|---|
| A | 6705 | 204 | 3.042506% |
| B | 6706 | 450 | 6.710409% |
| C | 6706 | 871 | 12.988369% |
| D | 6706 | 241 | 3.593797% |
Noise dominated data is calculated using 1-second bins in cleaned event files. If a bin has >2000 counts, and if more than 50% of those come from <1% of pixels, then it is considered to be noise-dominated and hence unusable.
| Quadrant | # 1 sec bins | Bins with >0 counts | Bins with >2000 counts | High rate bins dominated by noise | Noise dominated (total time) | Noise dominated (detector-on time) | Marked lightcurve |
|---|---|---|---|---|---|---|---|
| A | 7615 | 6706 | 160 | 160 | 2.10% | 2.39% | 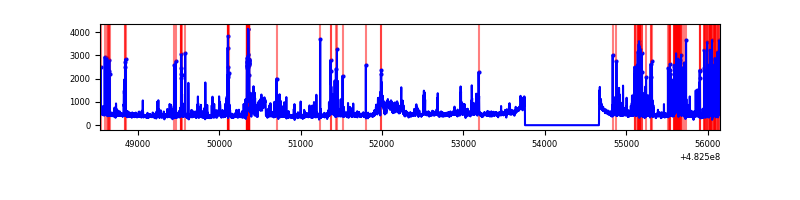 |
| B | 7616 | 6706 | 287 | 287 | 3.77% | 4.28% | 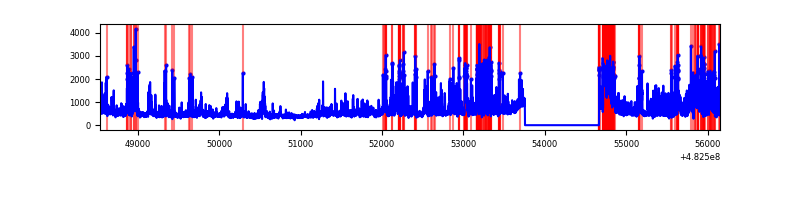 |
| C | 7616 | 6707 | 741 | 741 | 9.73% | 11.05% | 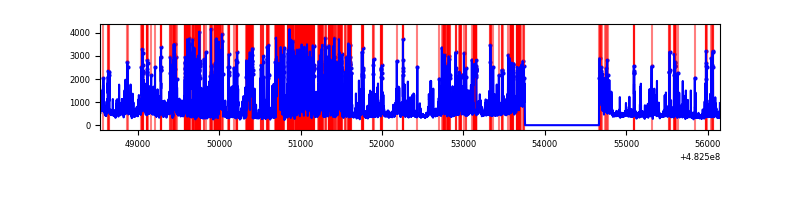 |
| D | 7616 | 6707 | 201 | 201 | 2.64% | 3.00% | 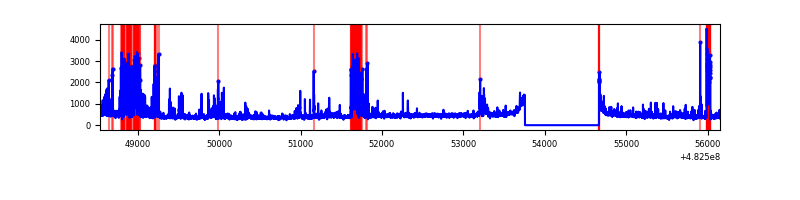 |
Top three noisy pixels from each quadrant. If the there are fewer than three noisy pixels in the level2.evt file, extra rows are filled as -1
| Pixel properties | Quadrant properties | ||||||
|---|---|---|---|---|---|---|---|
| Quadrant | DetID | PixID | Counts | Sigma | Mean | Median | Sigma |
| A | 7 | 64 | 678404 | 3910.96 | 697 | 681 | 173.3 |
| A | 12 | 3 | 224909 | 1293.96 | 697 | 681 | 173.3 |
| A | 5 | 240 | 119354 | 684.83 | 697 | 681 | 173.3 |
| B | 5 | 172 | 562833 | 3824.94 | 682 | 661 | 147.0 |
| B | 1 | 223 | 552526 | 3754.81 | 682 | 661 | 147.0 |
| B | 4 | 170 | 133442 | 903.42 | 682 | 661 | 147.0 |
| C | 15 | 189 | 2156562 | 11830.45 | 652 | 648 | 182.2 |
| C | 12 | 254 | 406294 | 2225.96 | 652 | 648 | 182.2 |
| C | 13 | 3 | 310124 | 1698.23 | 652 | 648 | 182.2 |
| D | 2 | 249 | 540926 | 2839.22 | 672 | 647 | 190.3 |
| D | 8 | 176 | 150853 | 789.35 | 672 | 647 | 190.3 |
| D | 6 | 42 | 107614 | 562.12 | 672 | 647 | 190.3 |
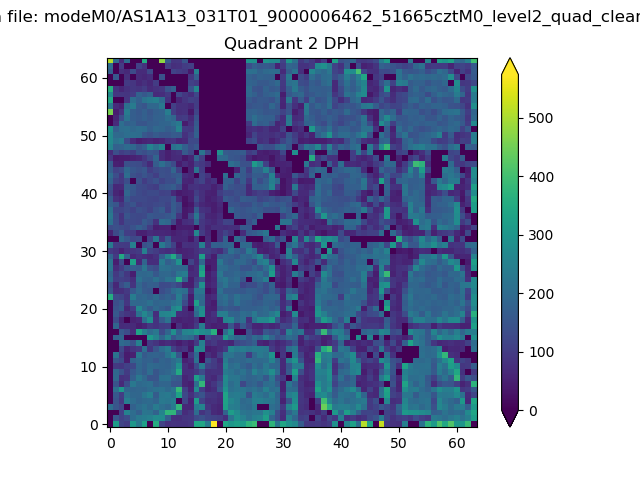
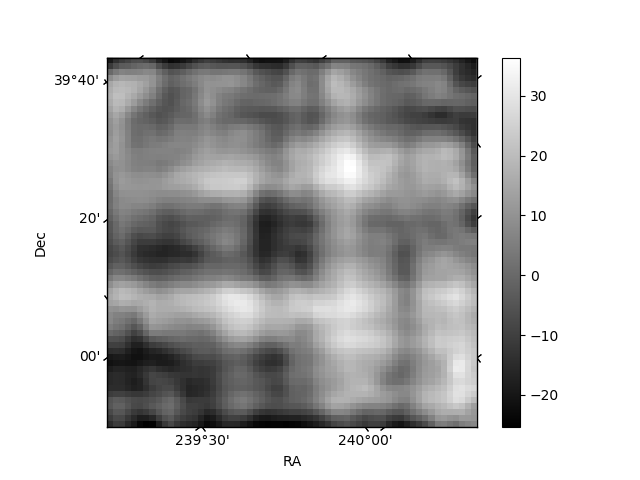
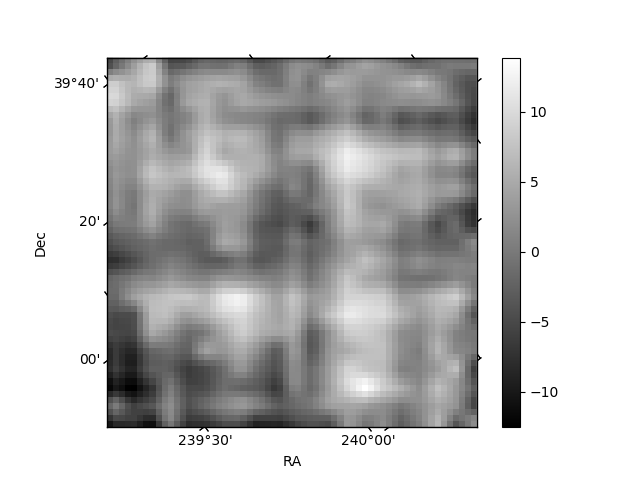
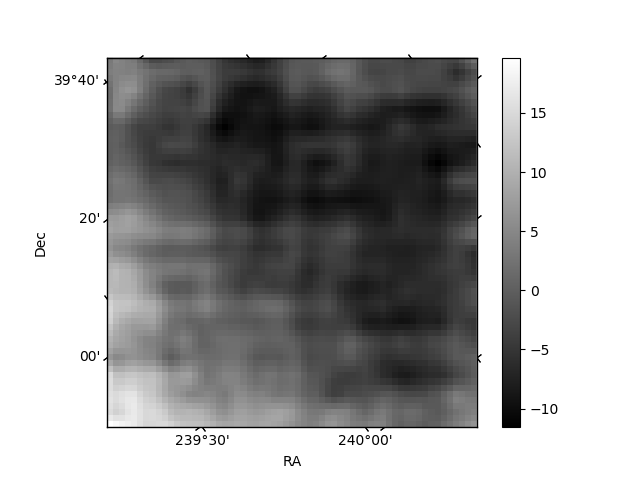
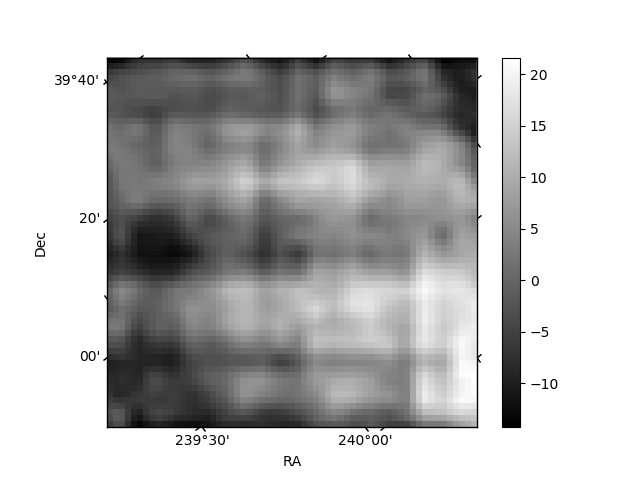
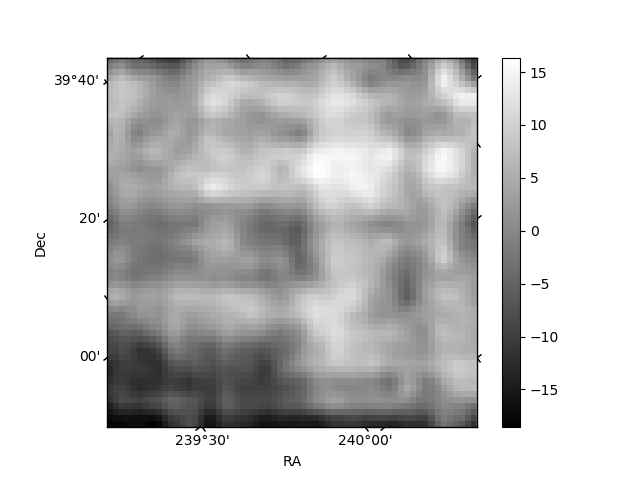
Histogram calculated using DETX and DETY for each event in the final _common_clean file
| Quadrant A | 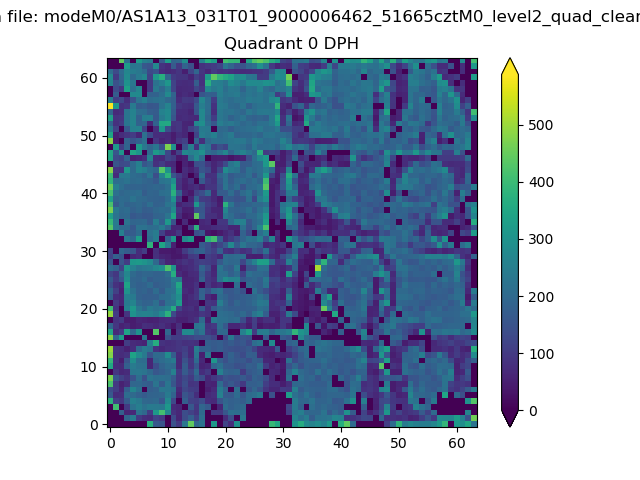 |
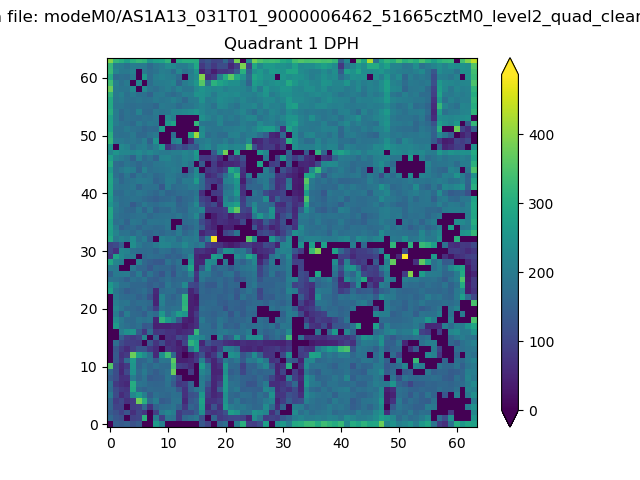 |
Quadrant B |
|---|---|---|---|
| Quadrant D | 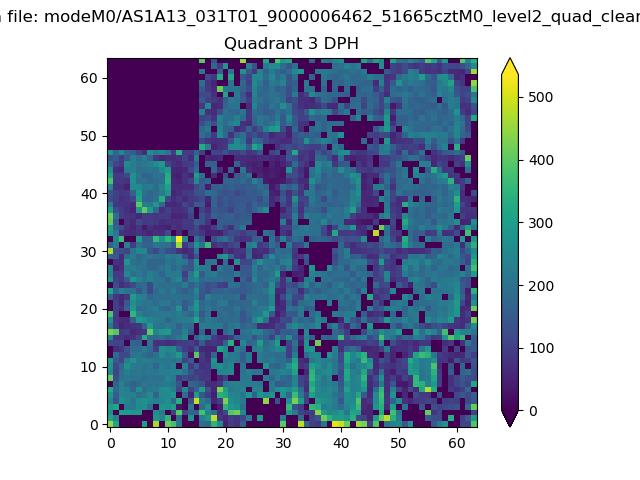 |
 |
Quadrant C |
| Plot type | Count rate plots | Images |
|---|---|---|
| Comparison with Poisson distribution Blue bars denote a histogram of data divided into 1 sec bins. Red curve is a Poisson curve with rate = median count rate of data. |
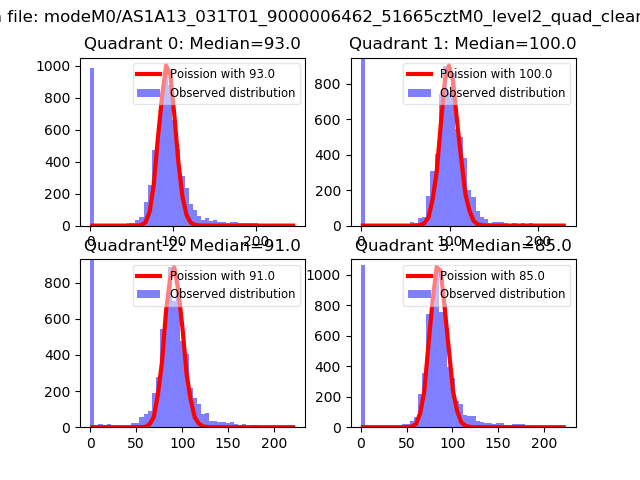 |
 |
| Quadrant-wise count rates Data is divided into 100 sec bins |
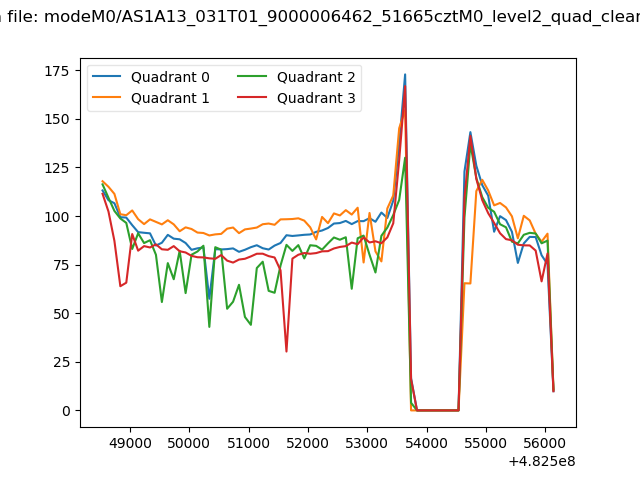 |
|
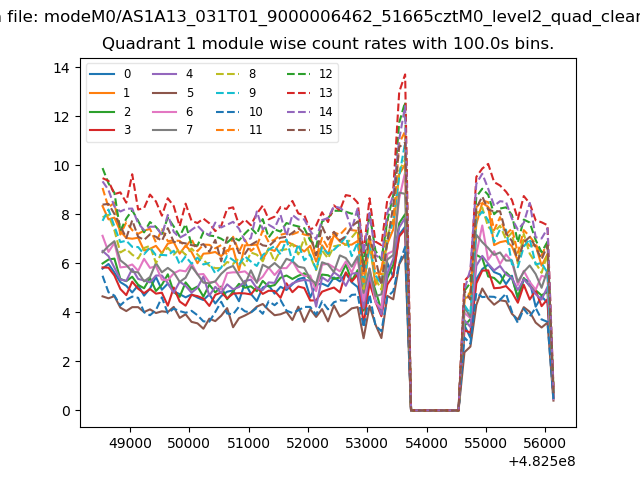
| Module-wise count rates for Quadrant A Data is divided into 100 sec bins |
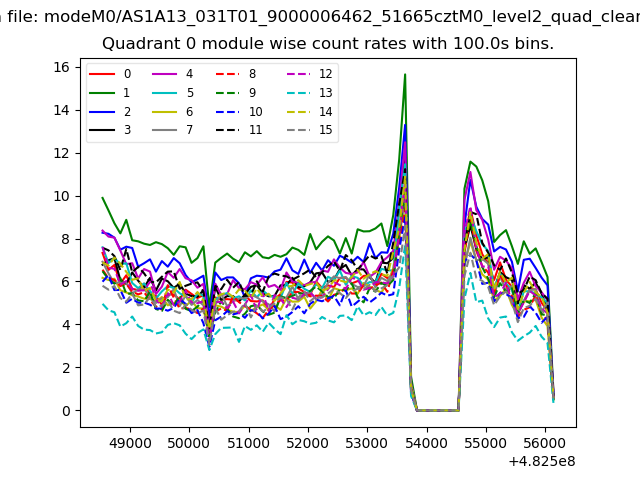 |
 |
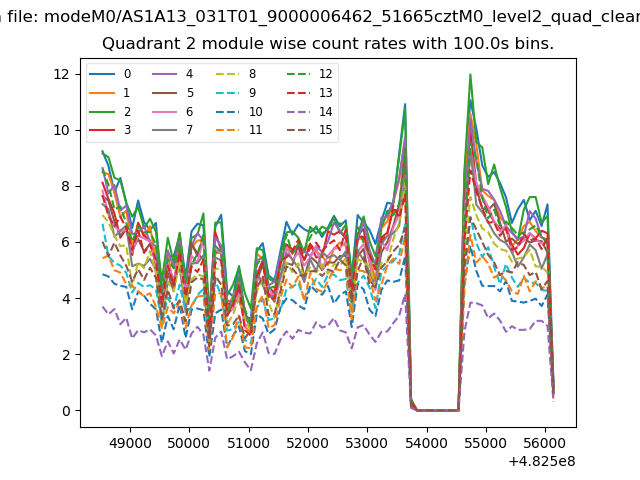
| Module-wise count rates for Quadrant B Data is divided into 100 sec bins |
 |
 |
| Module-wise count rates for Quadrant C Data is divided into 100 sec bins |
 |
 |
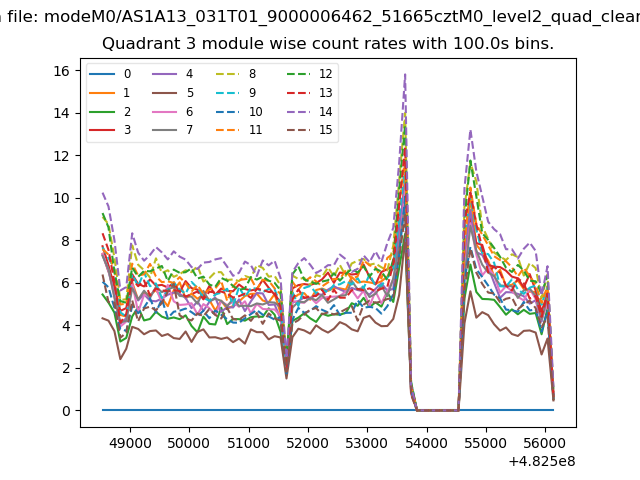
| Module-wise count rates for Quadrant D Data is divided into 100 sec bins |
 |
 |
| Parameter | Plot |
|---|---|
| CZT HV Monitor | 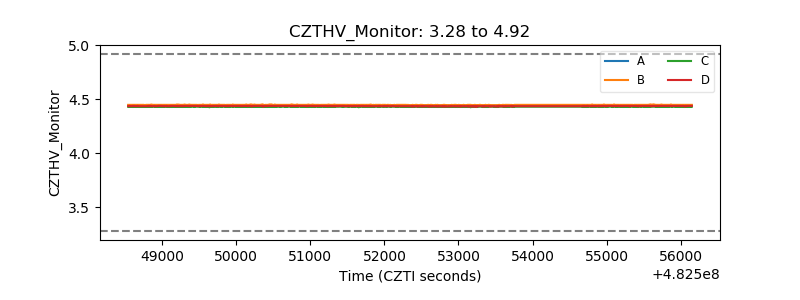 |
| D_VDD | 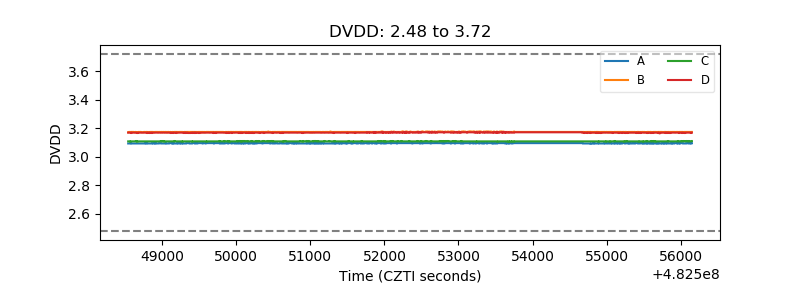 |
| Temperature 1 | 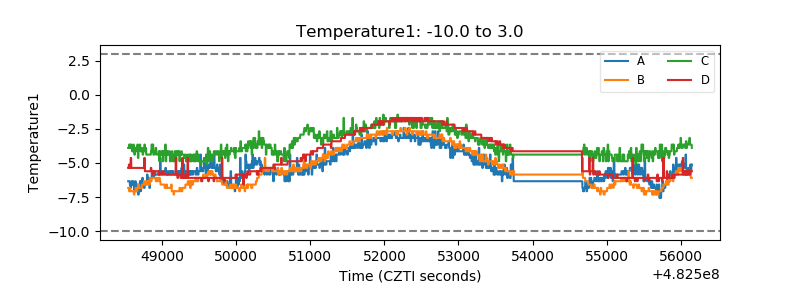 |
| Veto HV Monitor | 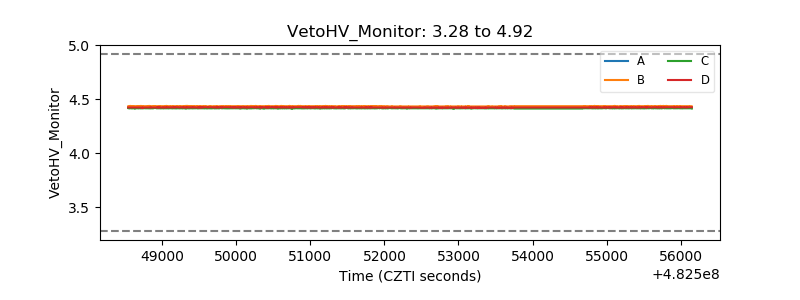 |
| Veto LLD | 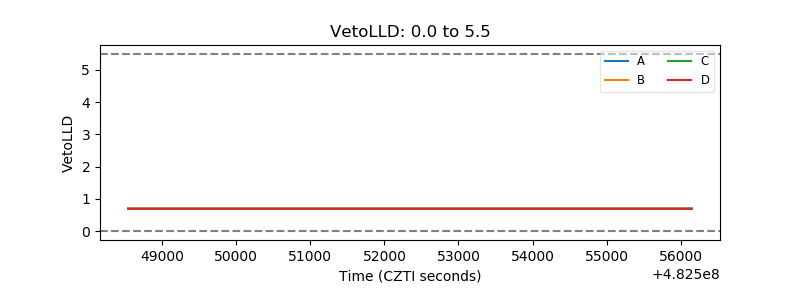 |
| Alpha Counter | 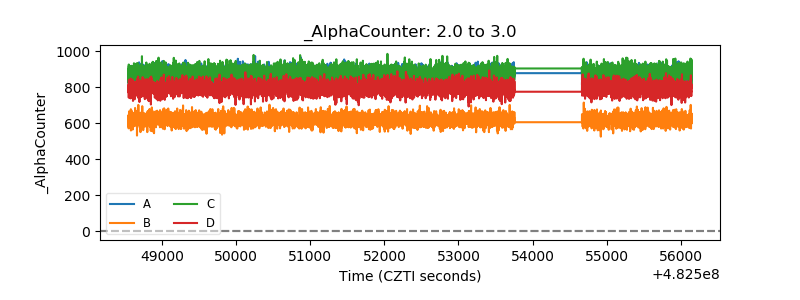 |
| _CPM_Rate | 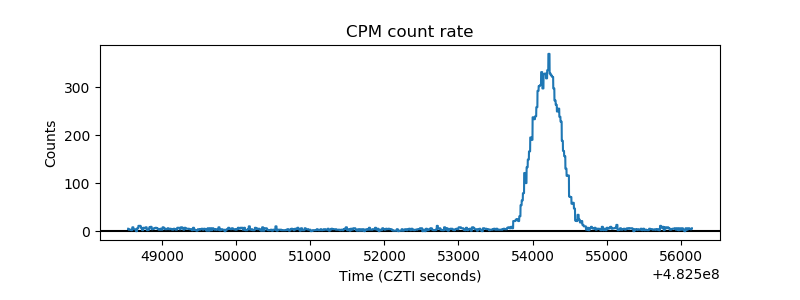 |
| CZT Counter | 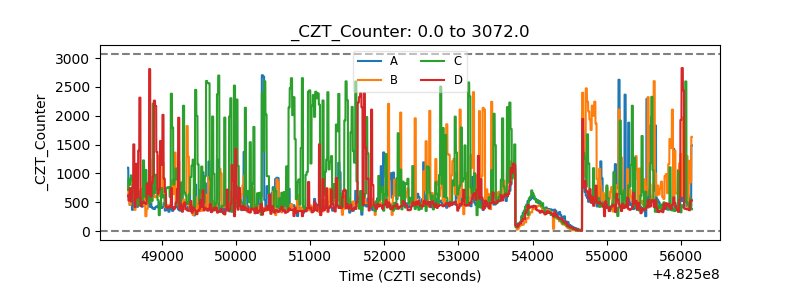 |
| +2.5 Volts monitor | 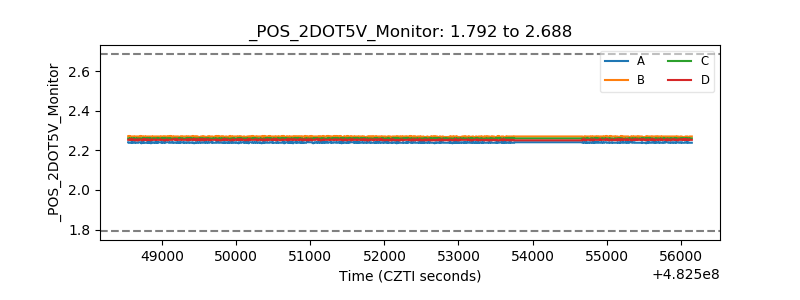 |
| +5 Volts monitor | 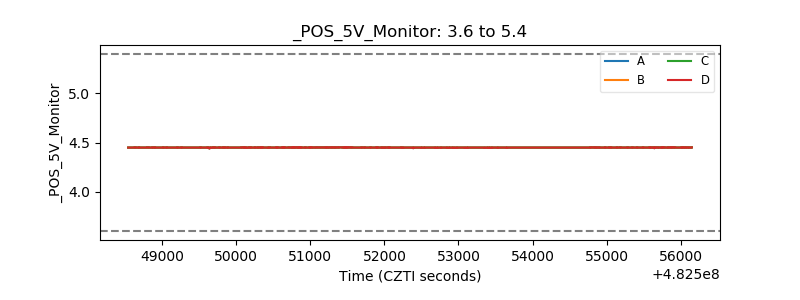 |
| _ROLL_ROT | 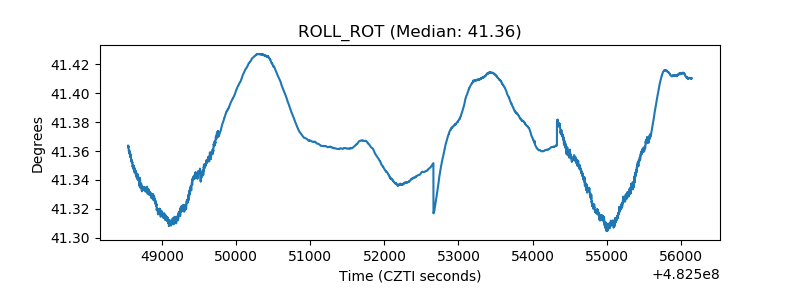 |
| _Roll_DEC | 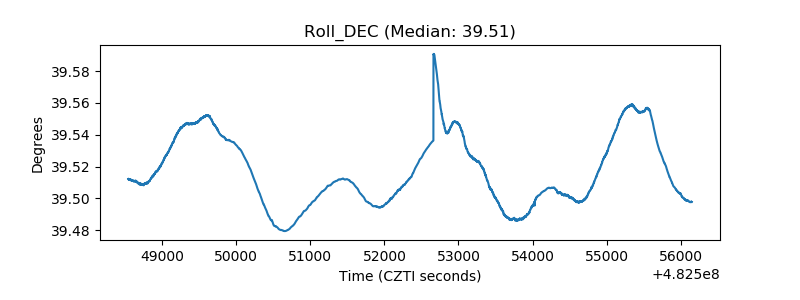 |
| _Roll_RA | 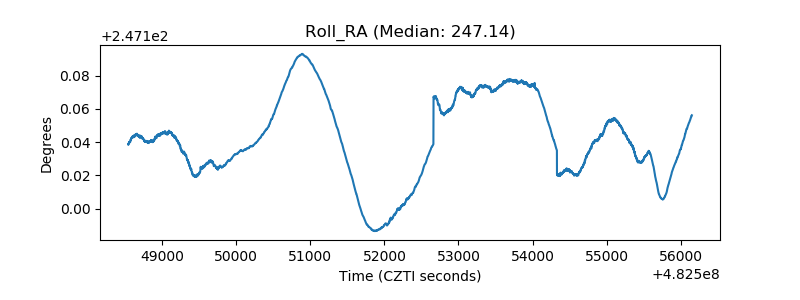 |
| Veto Counter | 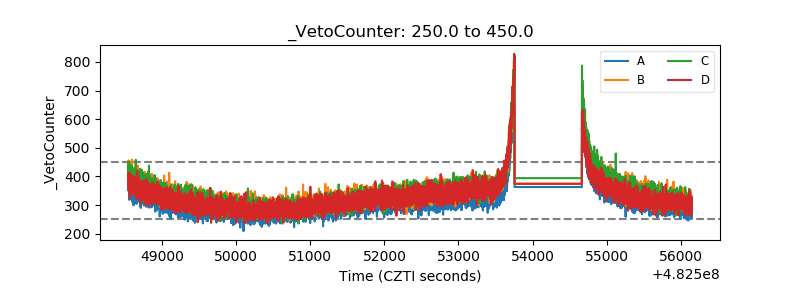 |