| Param | Original file | Final file |
|---|---|---|
| Filename | modeM0/AS1A13_031T01_9000006462_51667cztM0_level2.fits | modeM0/AS1A13_031T01_9000006462_51667cztM0_level2_quad_clean.evt |
| Size (bytes) | 666,388,800 | 99,020,160 |
| Size | 635.5 MB | 94.4 MB |
| Events in quadrant A | 8,753,901 | 523,946 |
| Events in quadrant B | 5,129,668 | 725,081 |
| Events in quadrant C | 5,821,363 | 623,038 |
| Events in quadrant D | 4,410,128 | 629,688 |
| Mode M9 | |||
|---|---|---|---|
| Quadrant | BADHDUFLAG | Total packets | Discarded packets |
| A | 0 | 19 | 0 |
| B | 0 | 19 | 0 |
| C | 0 | 19 | 0 |
| D | 0 | 19 | 0 |
| Mode M0 | |||
|---|---|---|---|
| Quadrant | BADHDUFLAG | Total packets | Discarded packets |
| A | 0 | 30992 | 3 |
| B | 0 | 20068 | 2 |
| C | 0 | 22368 | 2 |
| D | 0 | 18302 | 2 |
| Mode SS | |||
|---|---|---|---|
| Quadrant | BADHDUFLAG | Total packets | Discarded packets |
| A | 0 | 148 | 0 |
| B | 0 | 148 | 0 |
| C | 0 | 148 | 0 |
| D | 0 | 148 | 0 |
| Quadrant | Total seconds | Saturated seconds | Saturation percentage |
|---|---|---|---|
| A | 7122 | 2118 | 29.738837% |
| B | 7122 | 408 | 5.728728% |
| C | 7123 | 828 | 11.624316% |
| D | 7123 | 267 | 3.748421% |
Noise dominated data is calculated using 1-second bins in cleaned event files. If a bin has >2000 counts, and if more than 50% of those come from <1% of pixels, then it is considered to be noise-dominated and hence unusable.
| Quadrant | # 1 sec bins | Bins with >0 counts | Bins with >2000 counts | High rate bins dominated by noise | Noise dominated (total time) | Noise dominated (detector-on time) | Marked lightcurve |
|---|---|---|---|---|---|---|---|
| A | 9087 | 7123 | 1973 | 1973 | 21.71% | 27.70% | 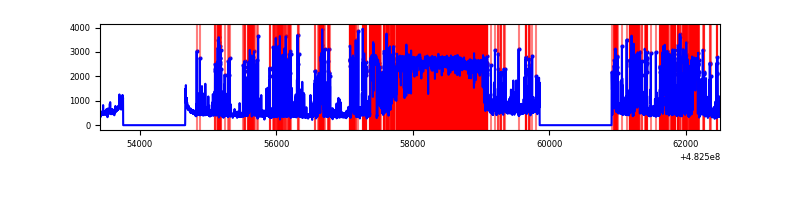 |
| B | 9087 | 7123 | 235 | 235 | 2.59% | 3.30% | 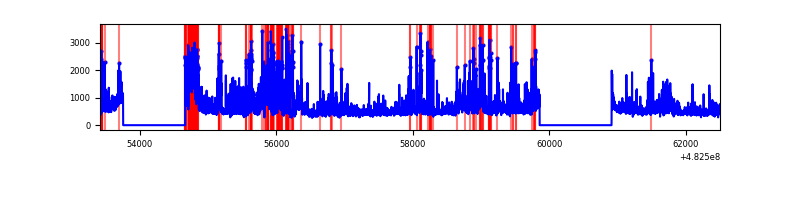 |
| C | 9088 | 7125 | 705 | 705 | 7.76% | 9.89% | 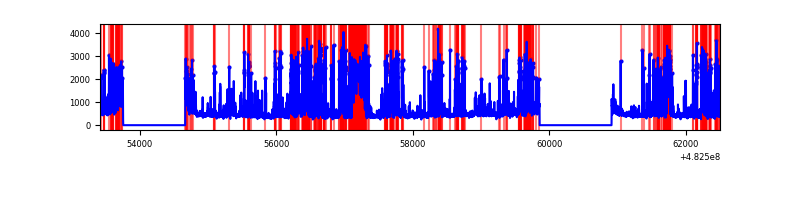 |
| D | 9088 | 7125 | 259 | 259 | 2.85% | 3.64% | 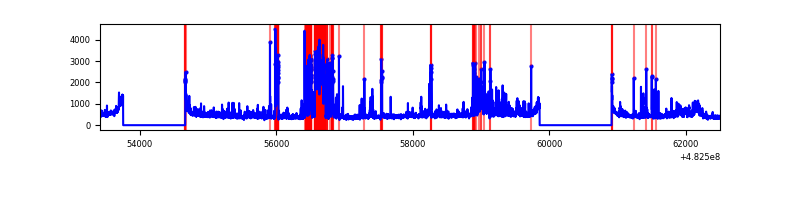 |
Top three noisy pixels from each quadrant. If the there are fewer than three noisy pixels in the level2.evt file, extra rows are filled as -1
| Pixel properties | Quadrant properties | ||||||
|---|---|---|---|---|---|---|---|
| Quadrant | DetID | PixID | Counts | Sigma | Mean | Median | Sigma |
| A | 7 | 64 | 5635865 | 36278.58 | 623 | 610 | 155.3 |
| A | 12 | 3 | 119218 | 763.57 | 623 | 610 | 155.3 |
| A | 5 | 240 | 102936 | 658.75 | 623 | 610 | 155.3 |
| B | 5 | 172 | 849375 | 5255.9 | 749 | 723 | 161.5 |
| B | 1 | 223 | 139004 | 856.41 | 749 | 723 | 161.5 |
| B | 4 | 170 | 130938 | 806.45 | 749 | 723 | 161.5 |
| C | 15 | 189 | 2155073 | 10893.54 | 714 | 708 | 197.8 |
| C | 13 | 3 | 283927 | 1432.1 | 714 | 708 | 197.8 |
| C | 0 | 209 | 151185 | 760.89 | 714 | 708 | 197.8 |
| D | 6 | 42 | 734156 | 3581.11 | 733 | 708 | 204.8 |
| D | 8 | 176 | 291566 | 1420.13 | 733 | 708 | 204.8 |
| D | 1 | 3 | 120071 | 582.8 | 733 | 708 | 204.8 |
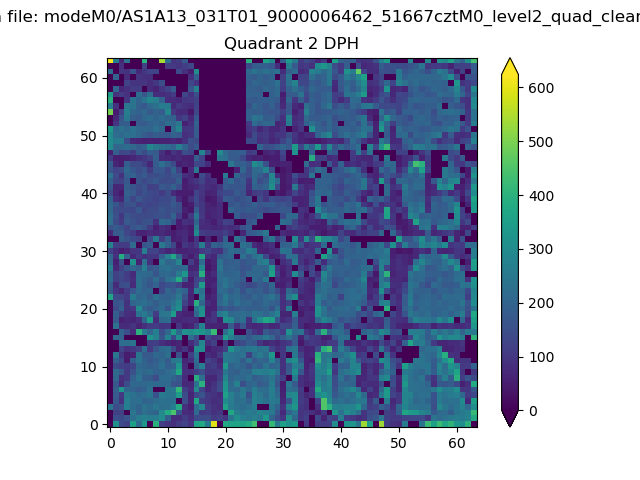
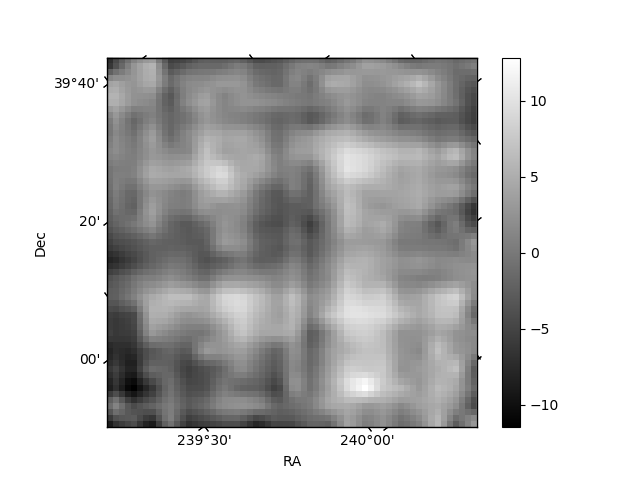
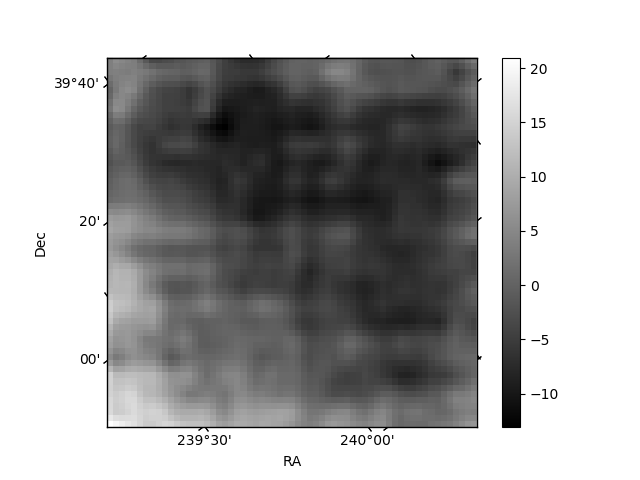
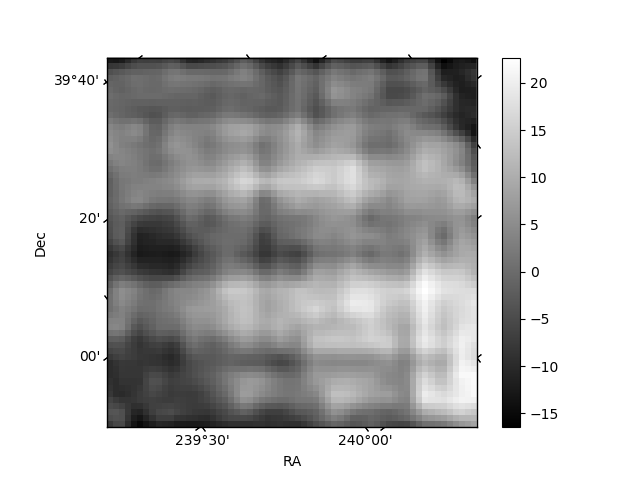
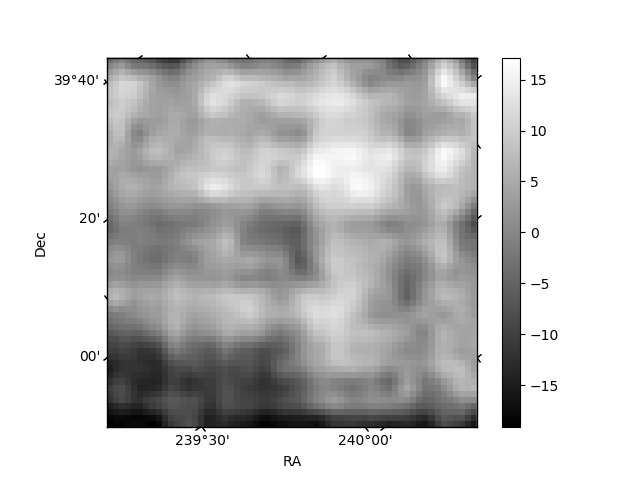
Histogram calculated using DETX and DETY for each event in the final _common_clean file
| Quadrant A | 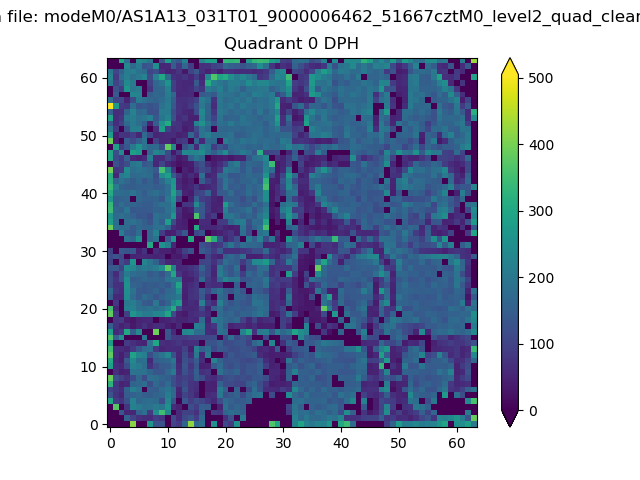 |
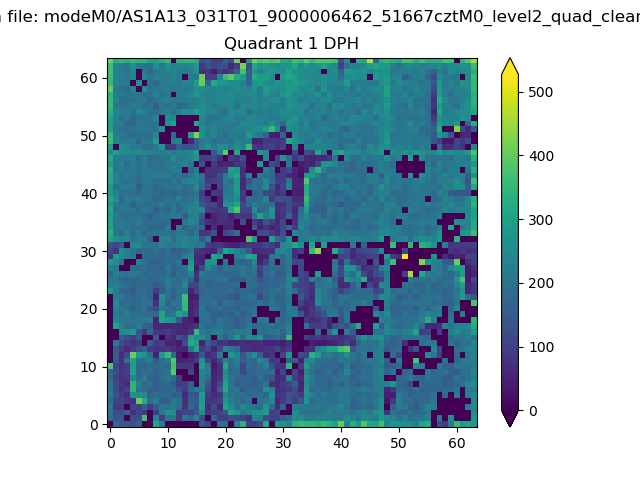 |
Quadrant B |
|---|---|---|---|
| Quadrant D | 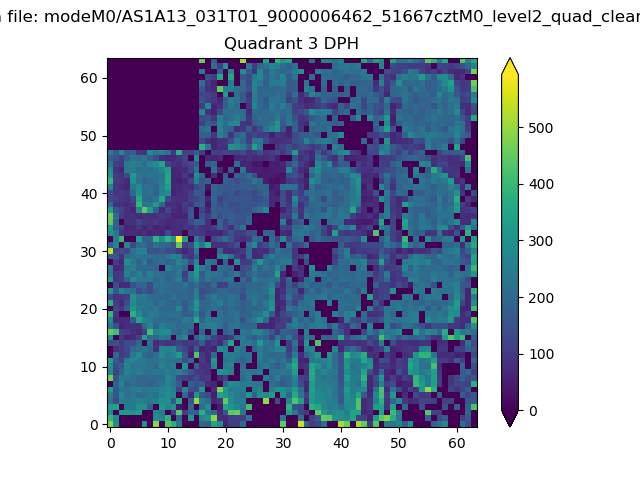 |
 |
Quadrant C |
| Plot type | Count rate plots | Images |
|---|---|---|
| Comparison with Poisson distribution Blue bars denote a histogram of data divided into 1 sec bins. Red curve is a Poisson curve with rate = median count rate of data. |
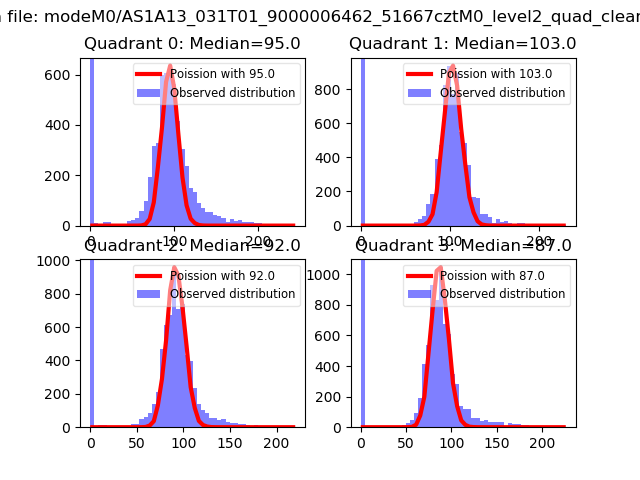 |
 |
| Quadrant-wise count rates Data is divided into 100 sec bins |
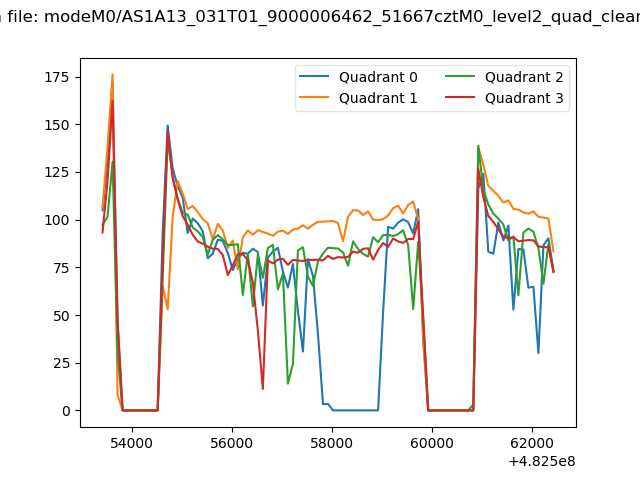 |
|
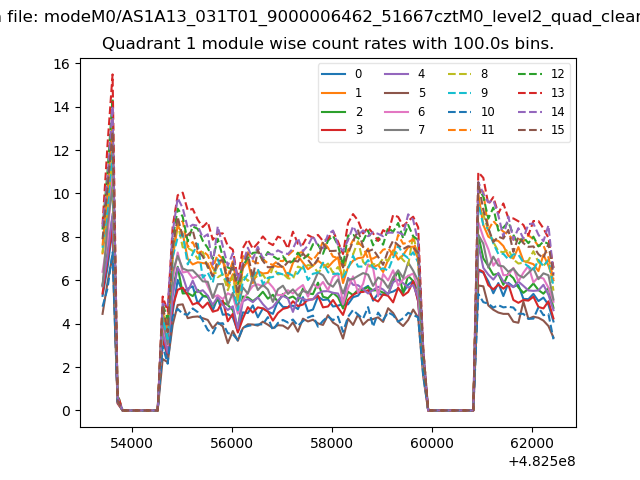
| Module-wise count rates for Quadrant A Data is divided into 100 sec bins |
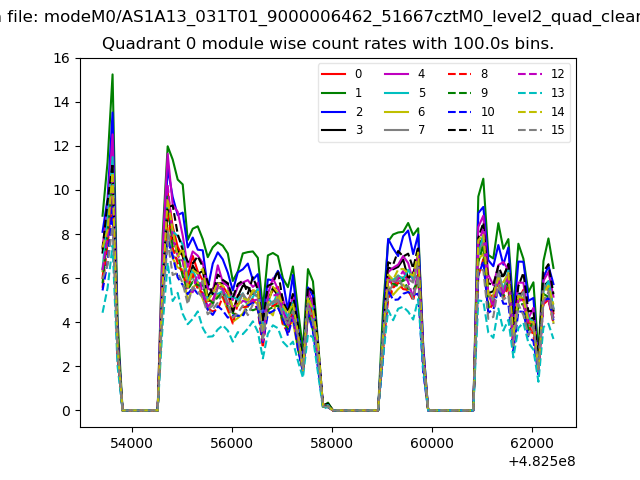 |
 |
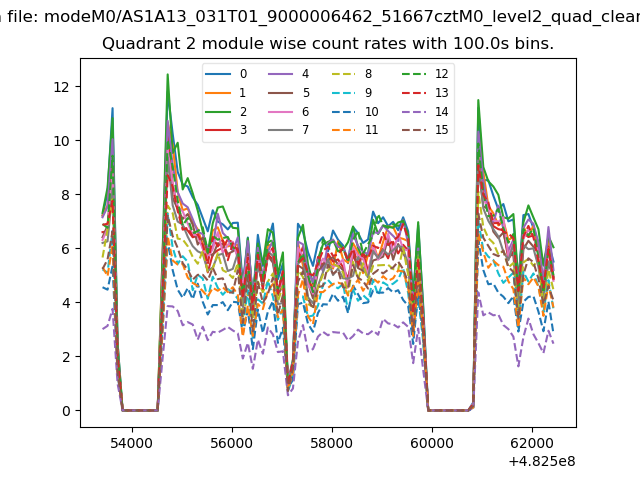
| Module-wise count rates for Quadrant B Data is divided into 100 sec bins |
 |
 |
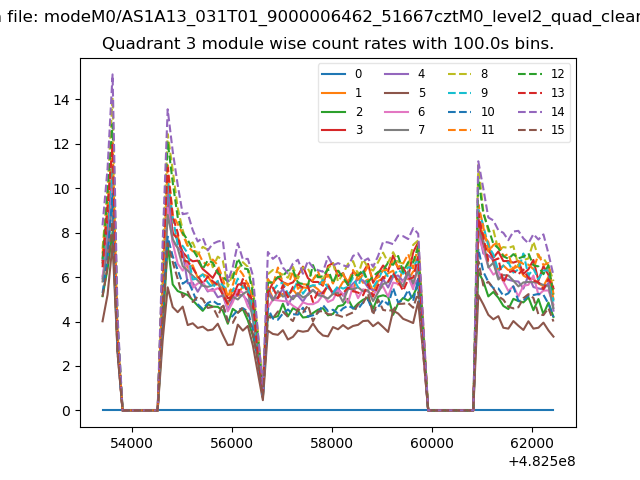
| Module-wise count rates for Quadrant C Data is divided into 100 sec bins |
 |
 |
| Module-wise count rates for Quadrant D Data is divided into 100 sec bins |
 |
 |
| Parameter | Plot |
|---|---|
| CZT HV Monitor | 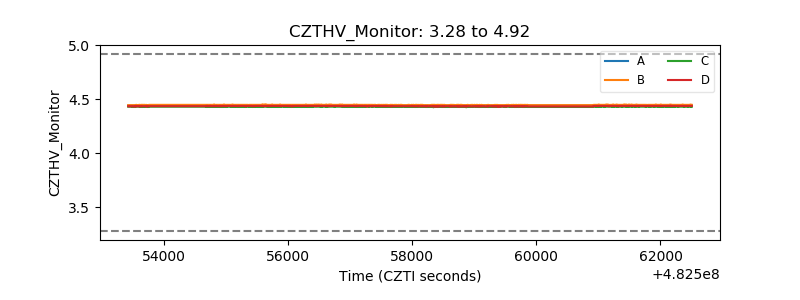 |
| D_VDD | 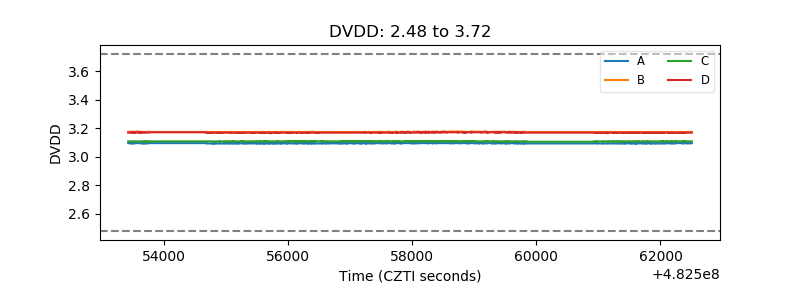 |
| Temperature 1 | 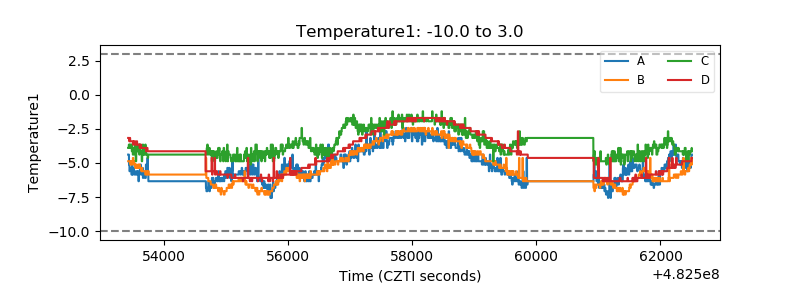 |
| Veto HV Monitor | 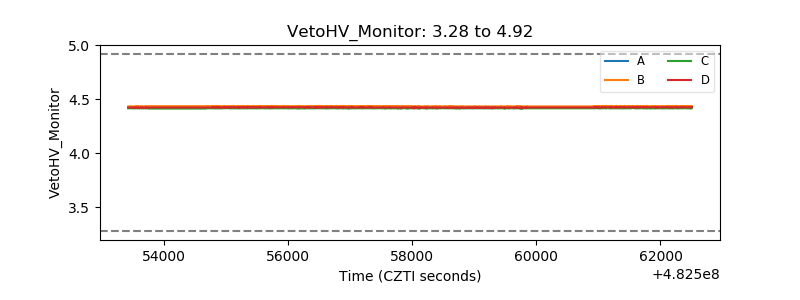 |
| Veto LLD | 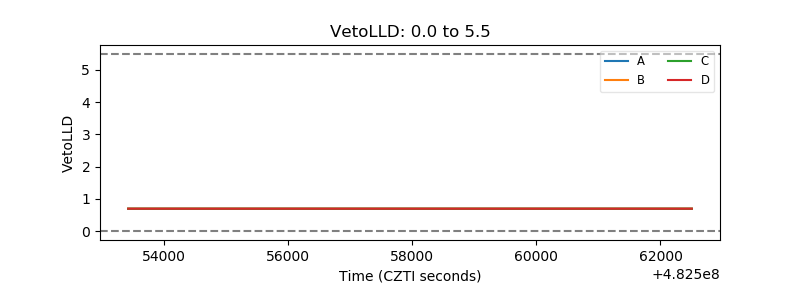 |
| Alpha Counter | 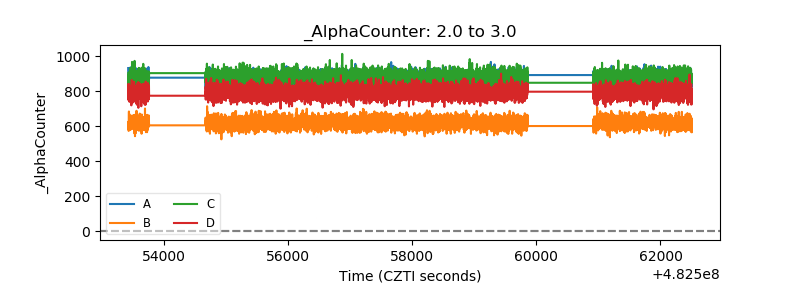 |
| _CPM_Rate | 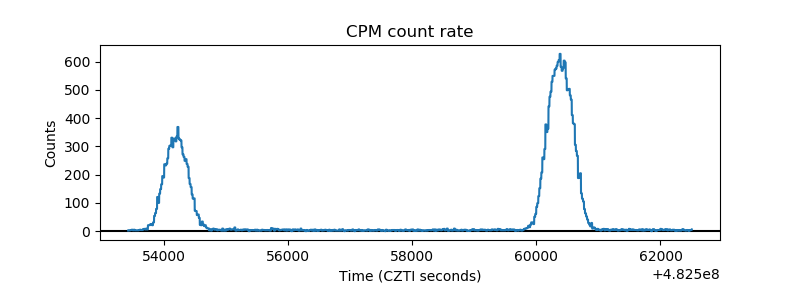 |
| CZT Counter | 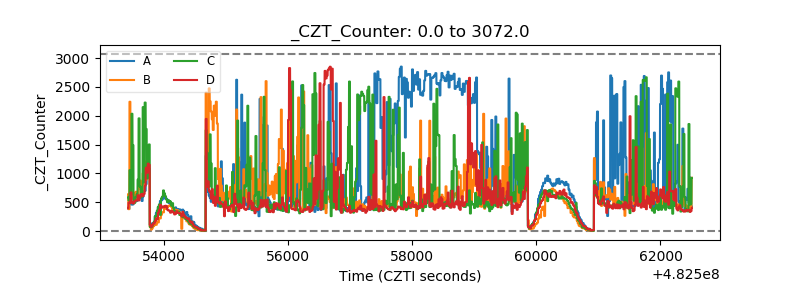 |
| +2.5 Volts monitor | 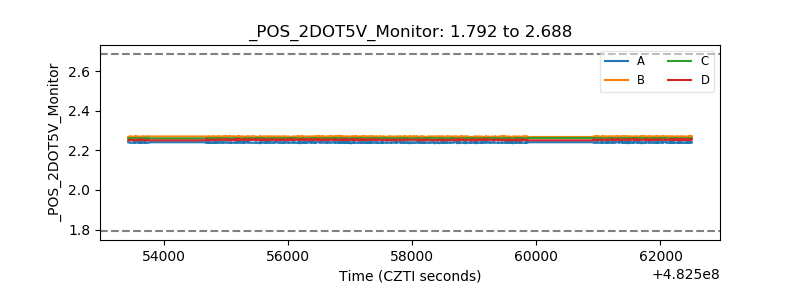 |
| +5 Volts monitor | 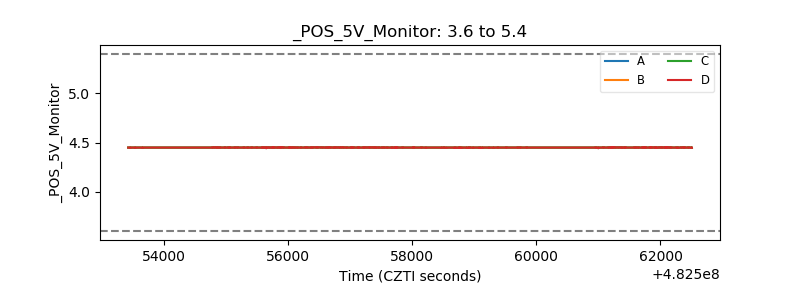 |
| _ROLL_ROT | 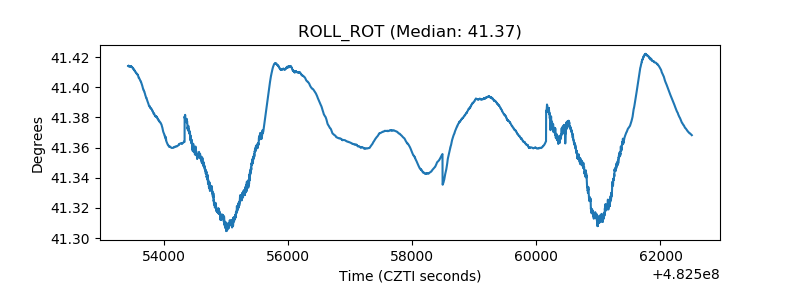 |
| _Roll_DEC | 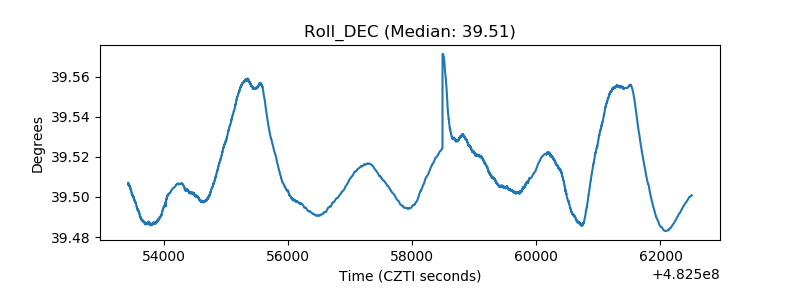 |
| _Roll_RA | 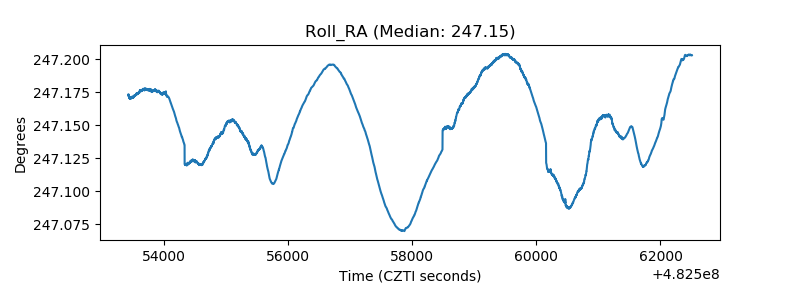 |
| Veto Counter | 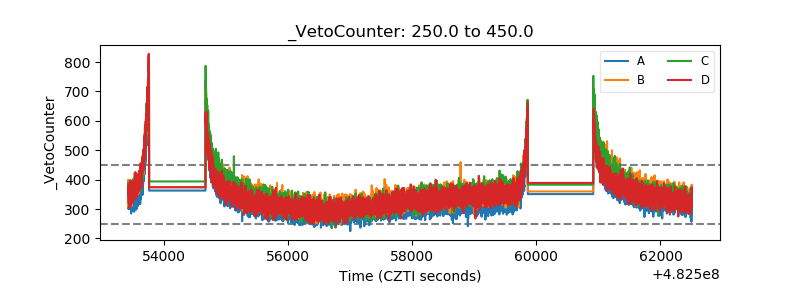 |