| Param | Original file | Final file |
|---|---|---|
| Filename | modeM0/AS1A13_031T01_9000006462_51669cztM0_level2.fits | modeM0/AS1A13_031T01_9000006462_51669cztM0_level2_quad_clean.evt |
| Size (bytes) | 504,964,800 | 89,723,520 |
| Size | 481.6 MB | 85.6 MB |
| Events in quadrant A | 4,592,556 | 577,169 |
| Events in quadrant B | 4,310,777 | 623,670 |
| Events in quadrant C | 5,457,327 | 540,514 |
| Events in quadrant D | 3,849,846 | 542,093 |
| Mode M9 | |||
|---|---|---|---|
| Quadrant | BADHDUFLAG | Total packets | Discarded packets |
| A | 0 | 11 | 0 |
| B | 0 | 11 | 0 |
| C | 0 | 11 | 0 |
| D | 0 | 11 | 0 |
| Mode M0 | |||
|---|---|---|---|
| Quadrant | BADHDUFLAG | Total packets | Discarded packets |
| A | 0 | 17755 | 1 |
| B | 0 | 17011 | 1 |
| C | 0 | 20527 | 1 |
| D | 0 | 15848 | 1 |
| Mode SS | |||
|---|---|---|---|
| Quadrant | BADHDUFLAG | Total packets | Discarded packets |
| A | 0 | 128 | 0 |
| B | 0 | 128 | 0 |
| C | 0 | 128 | 0 |
| D | 0 | 128 | 0 |
| Quadrant | Total seconds | Saturated seconds | Saturation percentage |
|---|---|---|---|
| A | 6200 | 458 | 7.387097% |
| B | 6200 | 489 | 7.887097% |
| C | 6201 | 751 | 12.110950% |
| D | 6200 | 198 | 3.193548% |
Noise dominated data is calculated using 1-second bins in cleaned event files. If a bin has >2000 counts, and if more than 50% of those come from <1% of pixels, then it is considered to be noise-dominated and hence unusable.
| Quadrant | # 1 sec bins | Bins with >0 counts | Bins with >2000 counts | High rate bins dominated by noise | Noise dominated (total time) | Noise dominated (detector-on time) | Marked lightcurve |
|---|---|---|---|---|---|---|---|
| A | 7320 | 6200 | 331 | 331 | 4.52% | 5.34% | 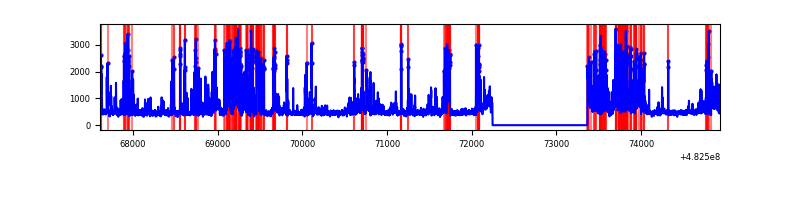 |
| B | 7320 | 6200 | 309 | 309 | 4.22% | 4.98% | 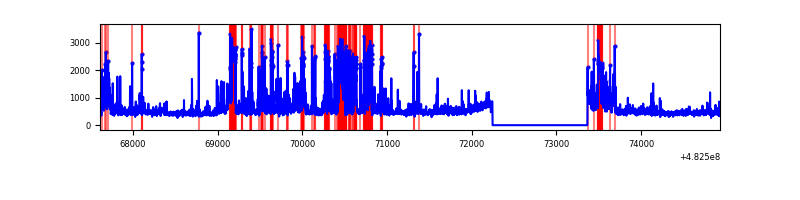 |
| C | 7321 | 6201 | 636 | 636 | 8.69% | 10.26% | 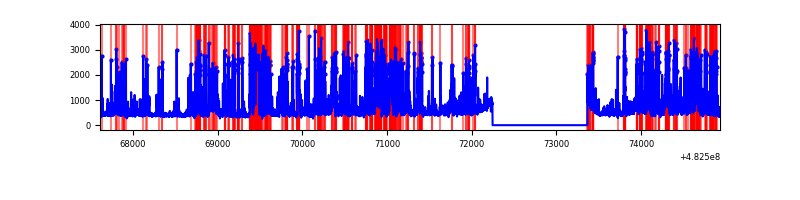 |
| D | 7320 | 6200 | 142 | 142 | 1.94% | 2.29% | 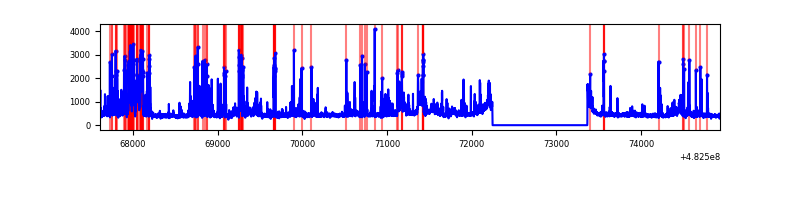 |
Top three noisy pixels from each quadrant. If the there are fewer than three noisy pixels in the level2.evt file, extra rows are filled as -1
| Pixel properties | Quadrant properties | ||||||
|---|---|---|---|---|---|---|---|
| Quadrant | DetID | PixID | Counts | Sigma | Mean | Median | Sigma |
| A | 7 | 64 | 1547054 | 9470.83 | 667 | 651 | 163.3 |
| A | 5 | 240 | 87193 | 530.02 | 667 | 651 | 163.3 |
| A | 12 | 3 | 58691 | 355.46 | 667 | 651 | 163.3 |
| B | 1 | 223 | 522187 | 3699.49 | 658 | 637 | 141.0 |
| B | 5 | 172 | 290519 | 2056.21 | 658 | 637 | 141.0 |
| B | 6 | 51 | 226143 | 1599.57 | 658 | 637 | 141.0 |
| C | 15 | 189 | 1521413 | 8807.58 | 629 | 625 | 172.7 |
| C | 12 | 254 | 777384 | 4498.57 | 629 | 625 | 172.7 |
| C | 13 | 3 | 287148 | 1659.39 | 629 | 625 | 172.7 |
| D | 8 | 176 | 555595 | 3096.28 | 651 | 628 | 179.2 |
| D | 3 | 12 | 349810 | 1948.16 | 651 | 628 | 179.2 |
| D | 2 | 249 | 227744 | 1267.13 | 651 | 628 | 179.2 |
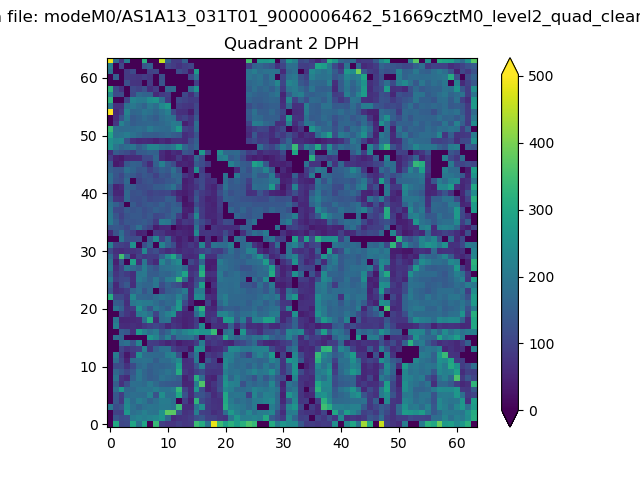
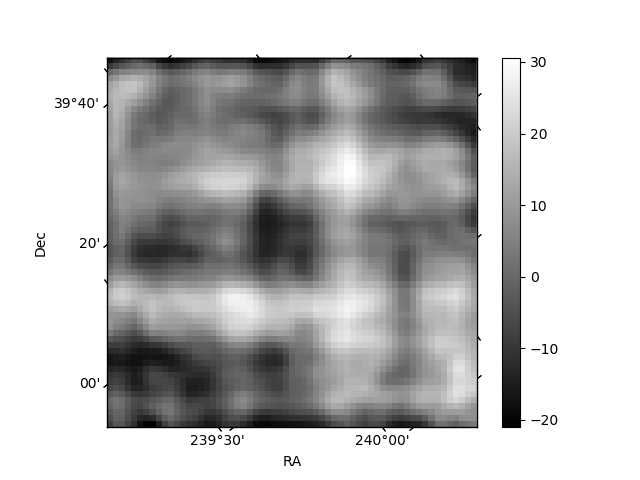
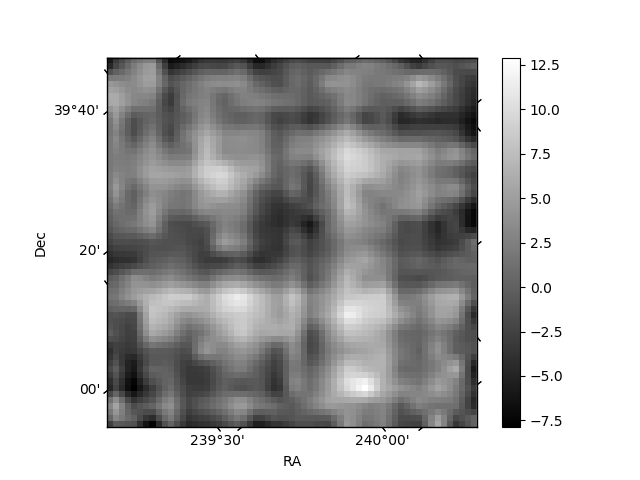
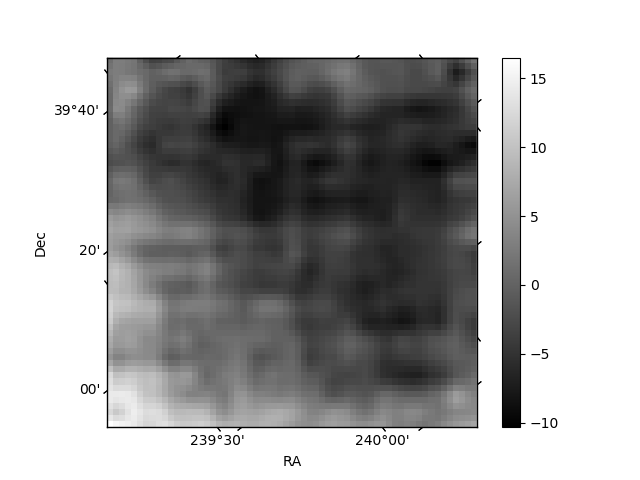
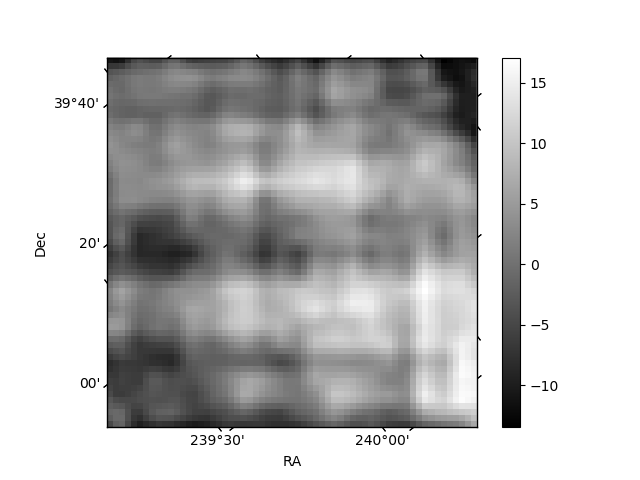
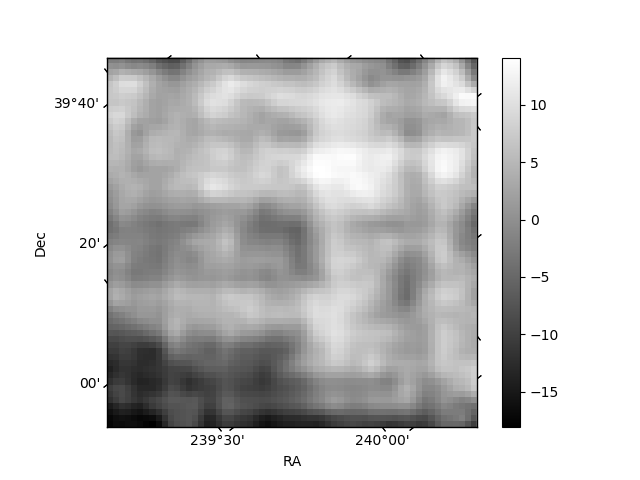
Histogram calculated using DETX and DETY for each event in the final _common_clean file
| Quadrant A | 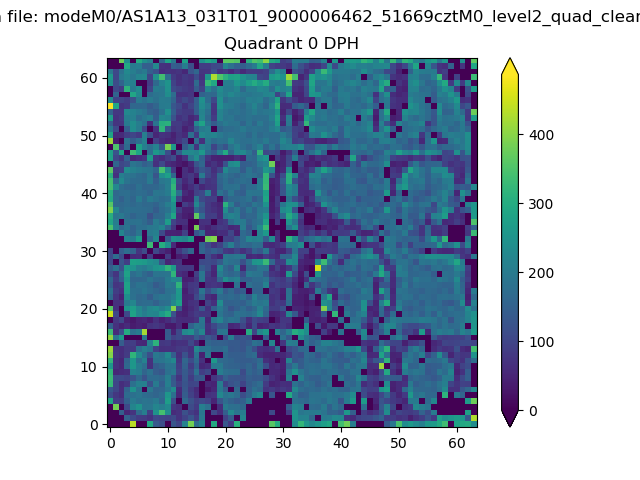 |
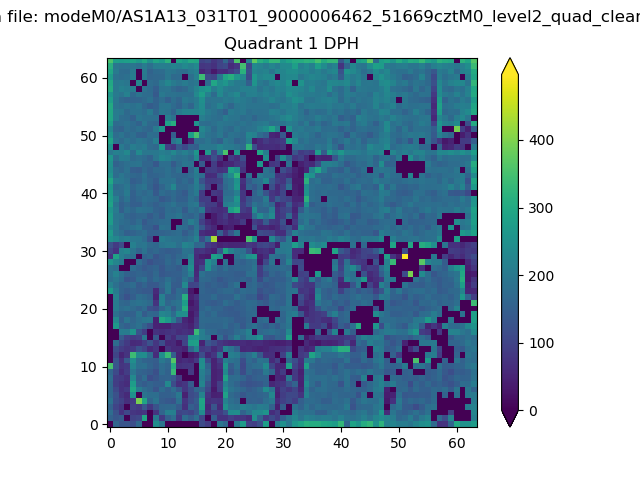 |
Quadrant B |
|---|---|---|---|
| Quadrant D | 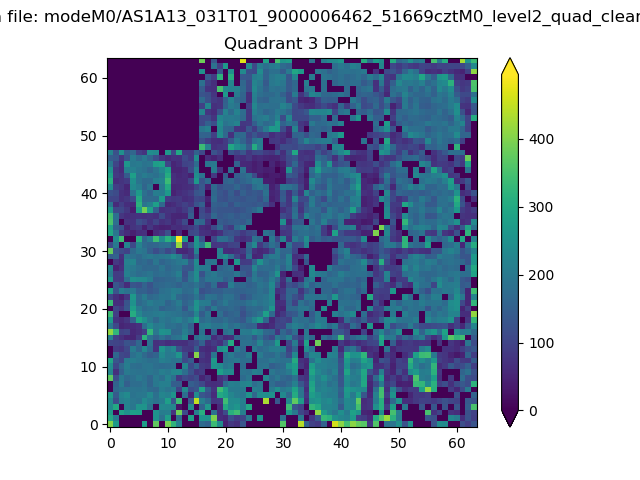 |
 |
Quadrant C |
| Plot type | Count rate plots | Images |
|---|---|---|
| Comparison with Poisson distribution Blue bars denote a histogram of data divided into 1 sec bins. Red curve is a Poisson curve with rate = median count rate of data. |
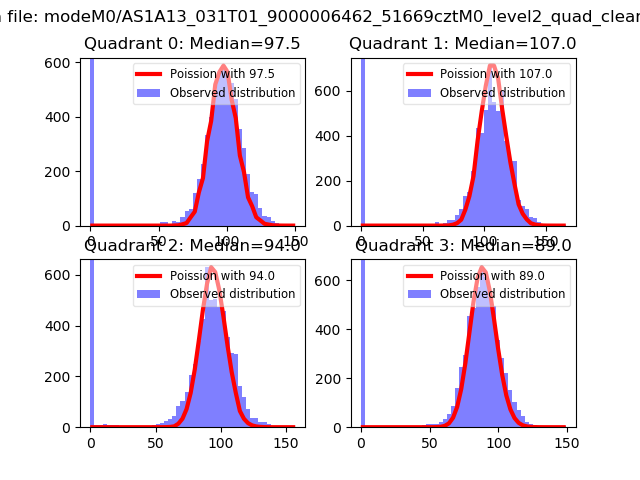 |
 |
| Quadrant-wise count rates Data is divided into 100 sec bins |
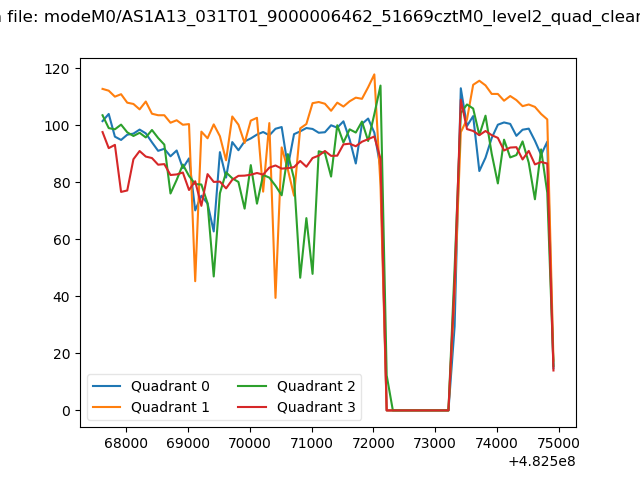 |
|
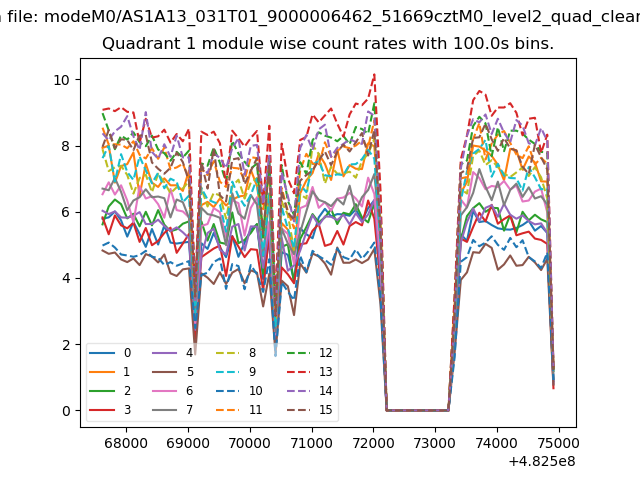
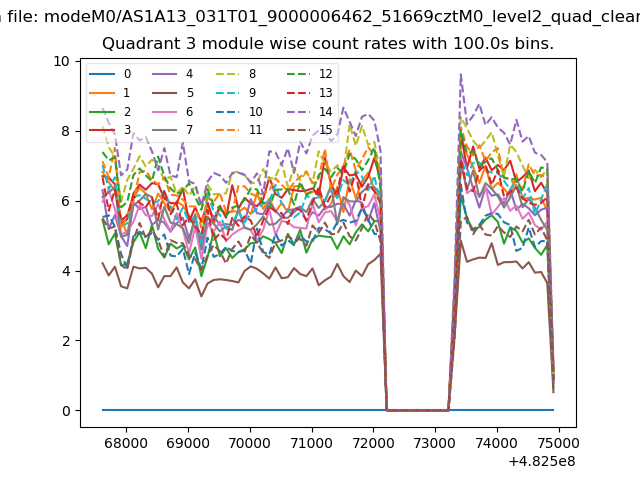
| Module-wise count rates for Quadrant A Data is divided into 100 sec bins |
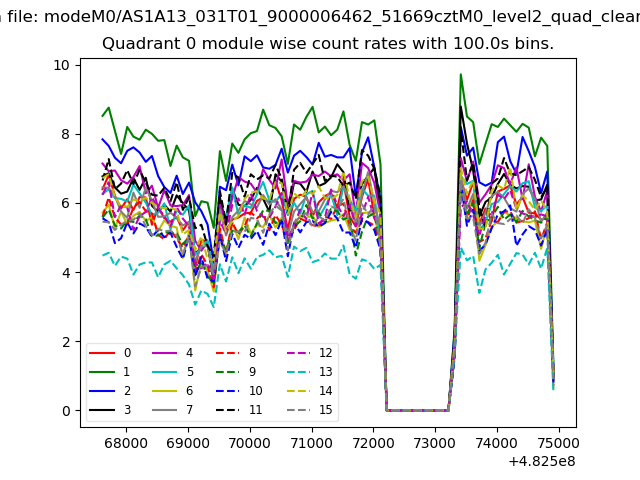 |
 |
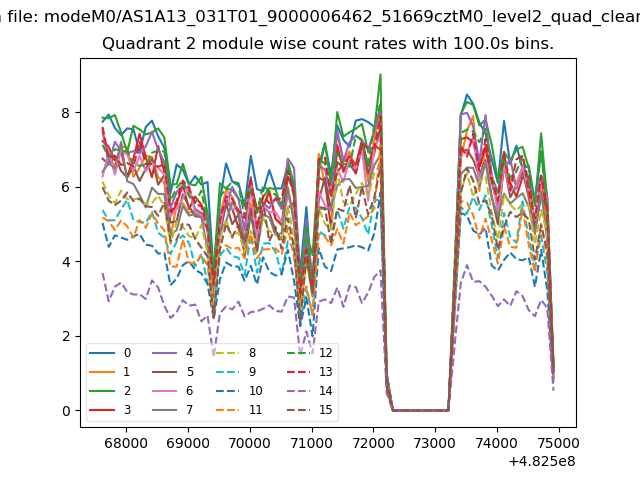
| Module-wise count rates for Quadrant B Data is divided into 100 sec bins |
 |
 |
| Module-wise count rates for Quadrant C Data is divided into 100 sec bins |
 |
 |
| Module-wise count rates for Quadrant D Data is divided into 100 sec bins |
 |
 |
| Parameter | Plot |
|---|---|
| CZT HV Monitor |  |
| D_VDD | 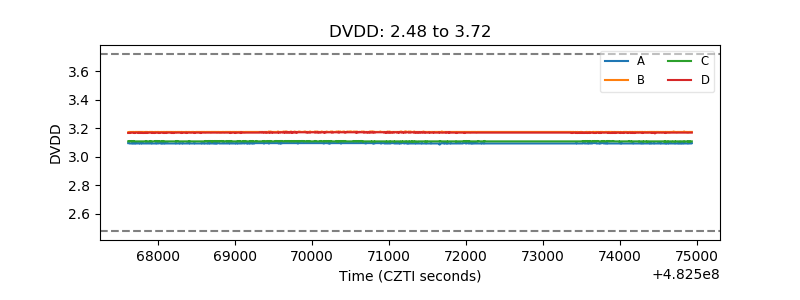 |
| Temperature 1 | 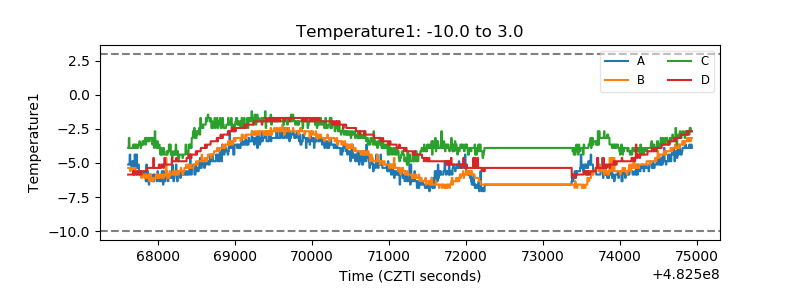 |
| Veto HV Monitor | 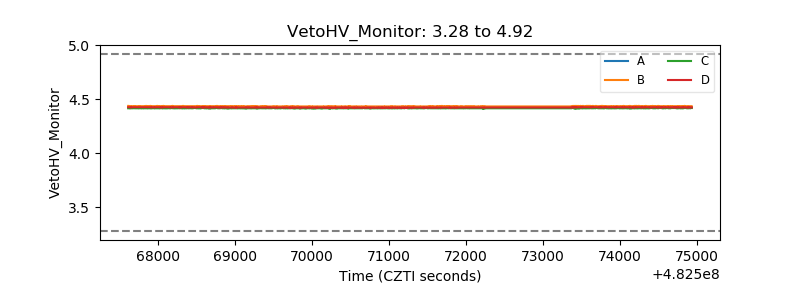 |
| Veto LLD | 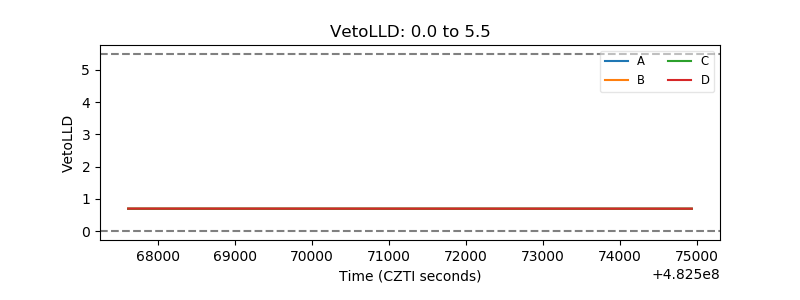 |
| Alpha Counter | 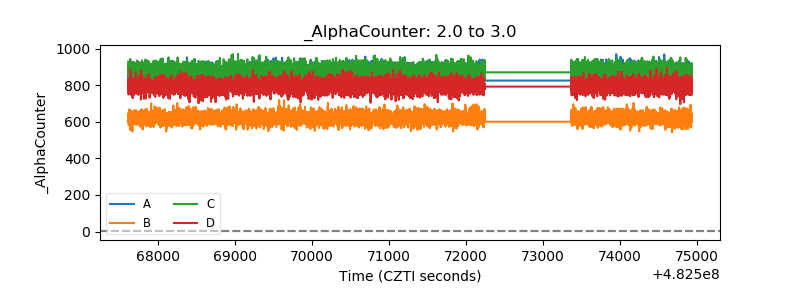 |
| _CPM_Rate | 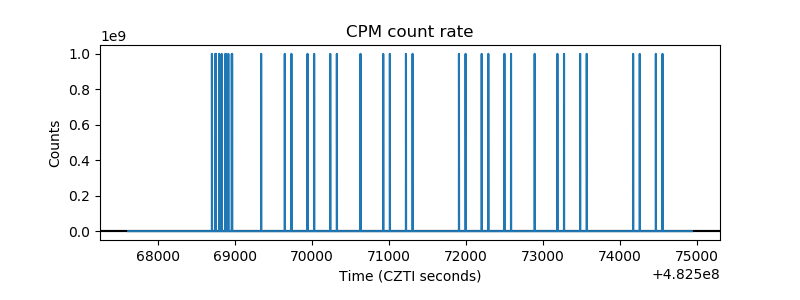 |
| CZT Counter | 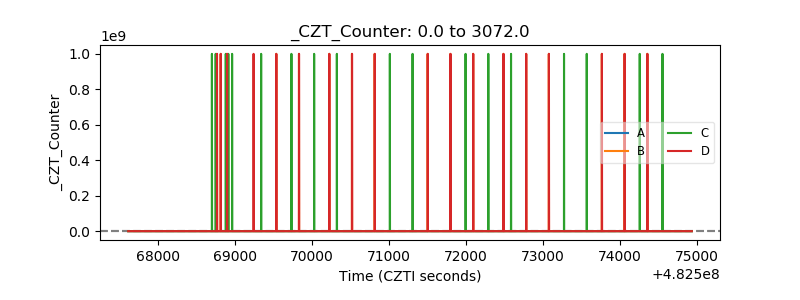 |
| +2.5 Volts monitor | 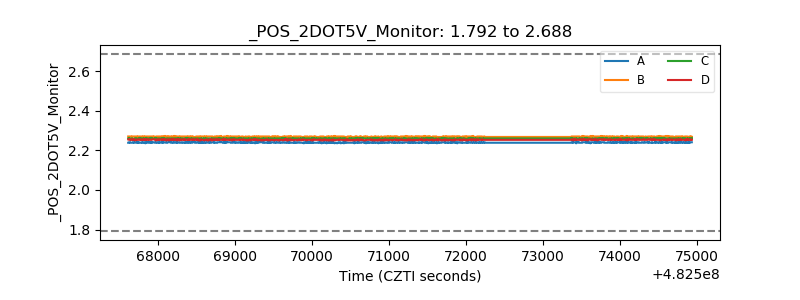 |
| +5 Volts monitor | 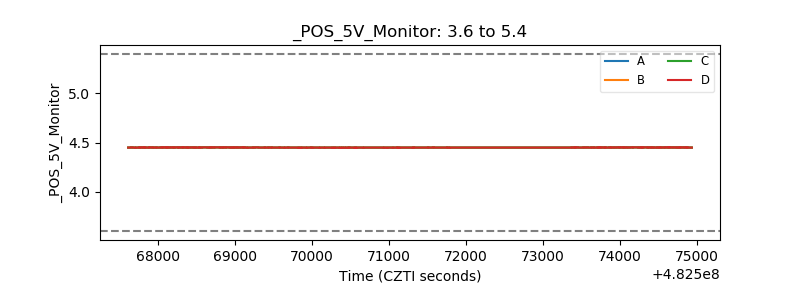 |
| _ROLL_ROT | 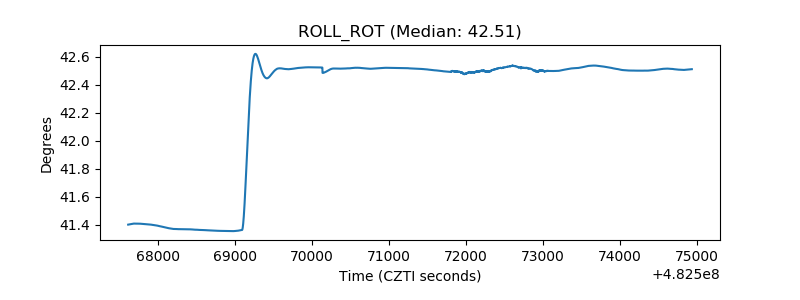 |
| _Roll_DEC | 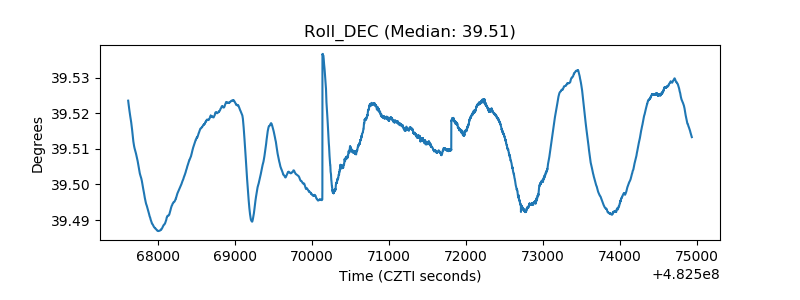 |
| _Roll_RA | 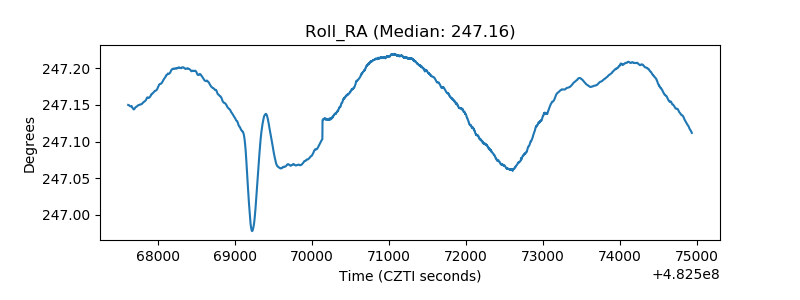 |
| Veto Counter | 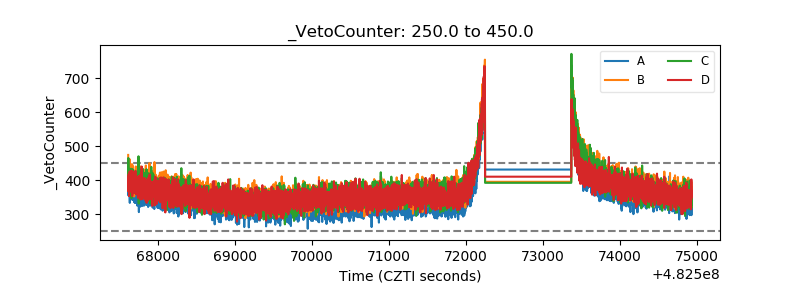 |