| Param | Original file | Final file |
|---|---|---|
| Filename | modeM0/AS1A13_031T01_9000006462_51670cztM0_level2.fits | modeM0/AS1A13_031T01_9000006462_51670cztM0_level2_quad_clean.evt |
| Size (bytes) | 2,705,788,800 | 446,261,760 |
| Size | 2.5 GB | 425.6 MB |
| Events in quadrant A | 29,088,440 | 2,708,310 |
| Events in quadrant B | 22,310,296 | 3,167,901 |
| Events in quadrant C | 27,699,768 | 2,699,530 |
| Events in quadrant D | 18,598,621 | 2,743,281 |
| Mode M9 | |||
|---|---|---|---|
| Quadrant | BADHDUFLAG | Total packets | Discarded packets |
| A | 0 | 60 | 0 |
| B | 0 | 60 | 0 |
| C | 0 | 60 | 0 |
| D | 0 | 60 | 0 |
| Mode M0 | |||
|---|---|---|---|
| Quadrant | BADHDUFLAG | Total packets | Discarded packets |
| A | 0 | 108311 | 6 |
| B | 0 | 88296 | 6 |
| C | 0 | 104736 | 12 |
| D | 0 | 78617 | 6 |
| Mode SS | |||
|---|---|---|---|
| Quadrant | BADHDUFLAG | Total packets | Discarded packets |
| A | 0 | 652 | 0 |
| B | 0 | 652 | 0 |
| C | 0 | 652 | 0 |
| D | 0 | 652 | 0 |
| Quadrant | Total seconds | Saturated seconds | Saturation percentage |
|---|---|---|---|
| A | 31894 | 4724 | 14.811563% |
| B | 31895 | 2193 | 6.875686% |
| C | 31894 | 4012 | 12.579168% |
| D | 31895 | 1085 | 3.401787% |
Noise dominated data is calculated using 1-second bins in cleaned event files. If a bin has >2000 counts, and if more than 50% of those come from <1% of pixels, then it is considered to be noise-dominated and hence unusable.
| Quadrant | # 1 sec bins | Bins with >0 counts | Bins with >2000 counts | High rate bins dominated by noise | Noise dominated (total time) | Noise dominated (detector-on time) | Marked lightcurve |
|---|---|---|---|---|---|---|---|
| A | 37959 | 31897 | 4108 | 4108 | 10.82% | 12.88% | 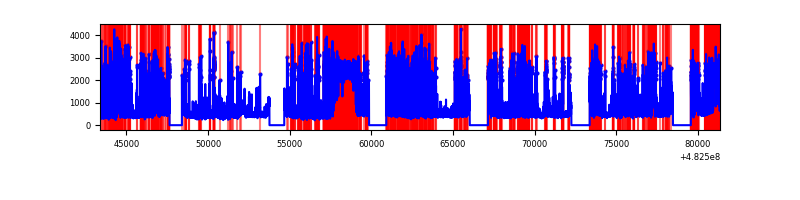 |
| B | 37960 | 31898 | 1347 | 1347 | 3.55% | 4.22% | 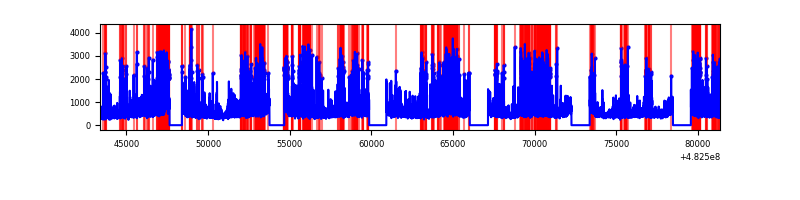 |
| C | 37960 | 31899 | 3406 | 3406 | 8.97% | 10.68% | 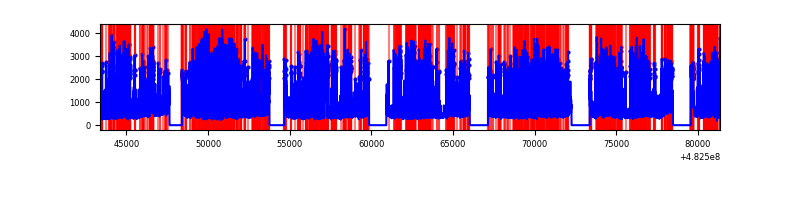 |
| D | 37960 | 31899 | 883 | 883 | 2.33% | 2.77% | 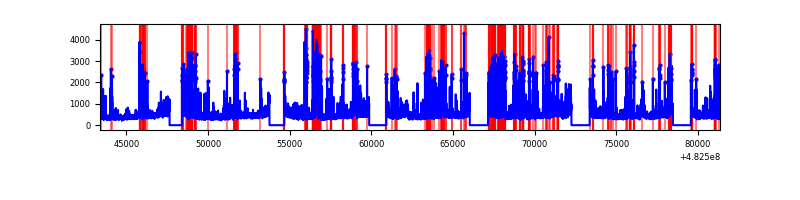 |
Top three noisy pixels from each quadrant. If the there are fewer than three noisy pixels in the level2.evt file, extra rows are filled as -1
| Pixel properties | Quadrant properties | ||||||
|---|---|---|---|---|---|---|---|
| Quadrant | DetID | PixID | Counts | Sigma | Mean | Median | Sigma |
| A | 7 | 64 | 13017931 | 16748.32 | 3180 | 3101 | 777.1 |
| A | 12 | 3 | 652285 | 835.41 | 3180 | 3101 | 777.1 |
| A | 13 | 248 | 617155 | 790.2 | 3180 | 3101 | 777.1 |
| B | 1 | 223 | 2175030 | 3072.37 | 3324 | 3207 | 706.9 |
| B | 5 | 172 | 1862161 | 2629.77 | 3324 | 3207 | 706.9 |
| B | 4 | 170 | 643099 | 905.22 | 3324 | 3207 | 706.9 |
| C | 15 | 189 | 9204167 | 10622.01 | 3167 | 3136 | 866.2 |
| C | 12 | 254 | 1476278 | 1700.65 | 3167 | 3136 | 866.2 |
| C | 13 | 3 | 1170012 | 1347.08 | 3167 | 3136 | 866.2 |
| D | 8 | 176 | 1666563 | 1811.85 | 3293 | 3168 | 918.1 |
| D | 2 | 249 | 1132112 | 1229.7 | 3293 | 3168 | 918.1 |
| D | 3 | 12 | 902303 | 979.38 | 3293 | 3168 | 918.1 |
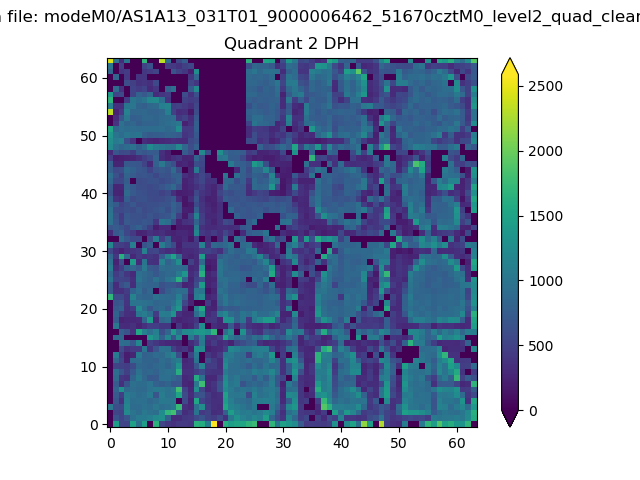
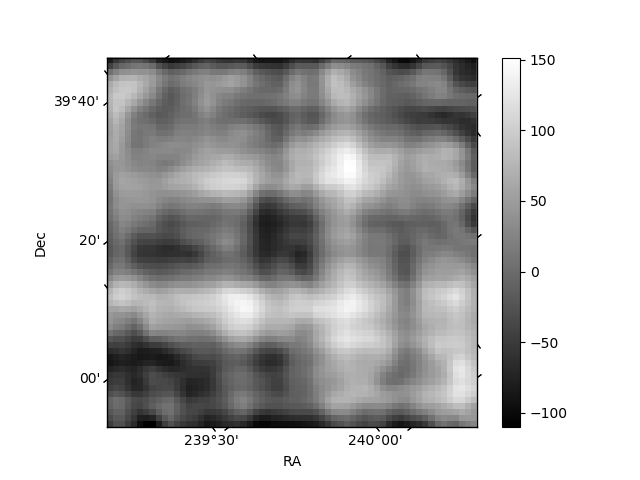
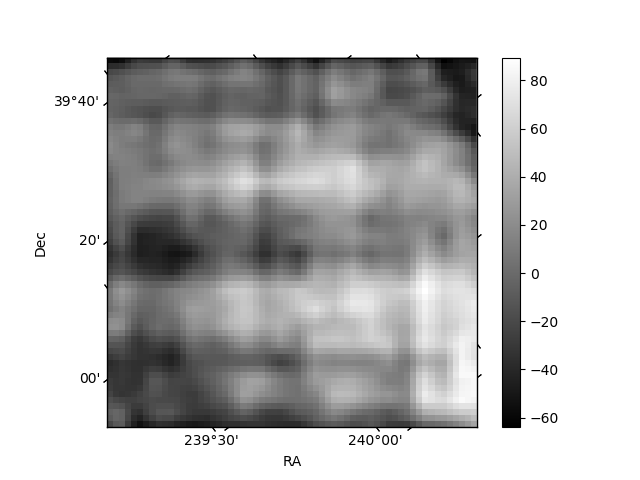
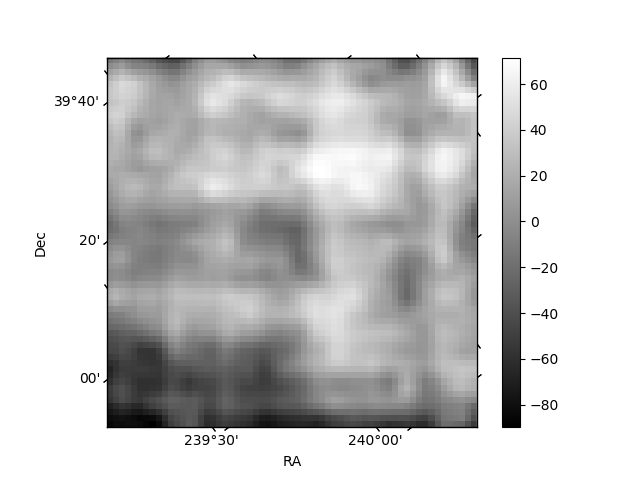
Histogram calculated using DETX and DETY for each event in the final _common_clean file
| Quadrant A | 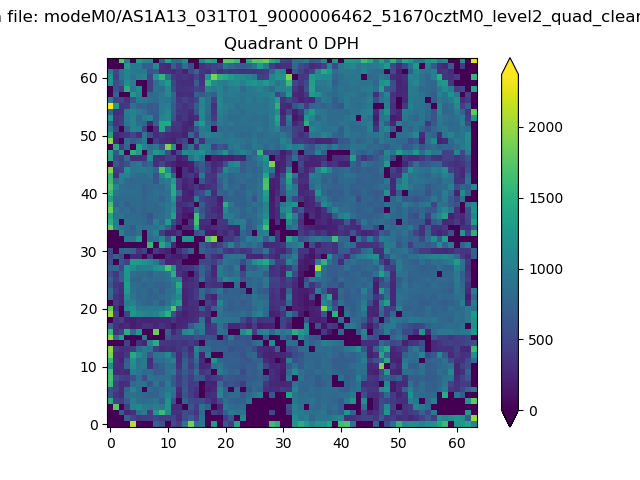 |
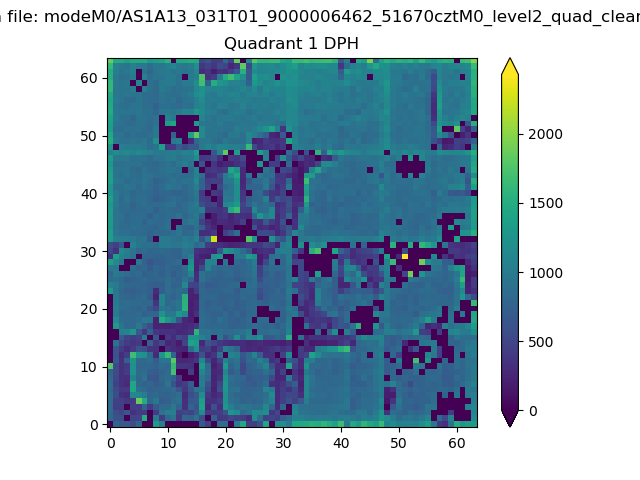 |
Quadrant B |
|---|---|---|---|
| Quadrant D | 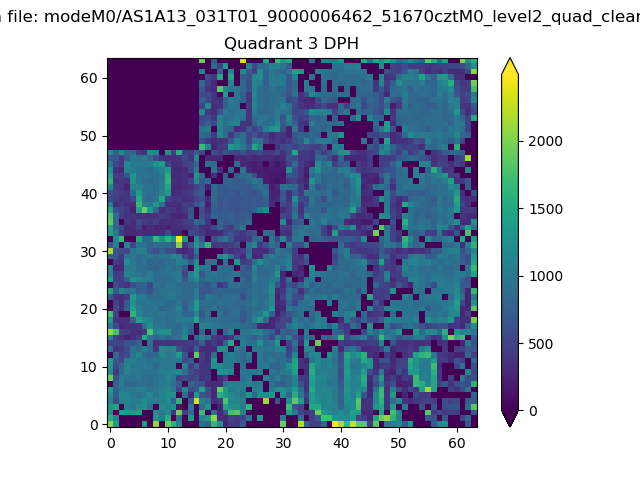 |
 |
Quadrant C |
| Plot type | Count rate plots | Images |
|---|---|---|
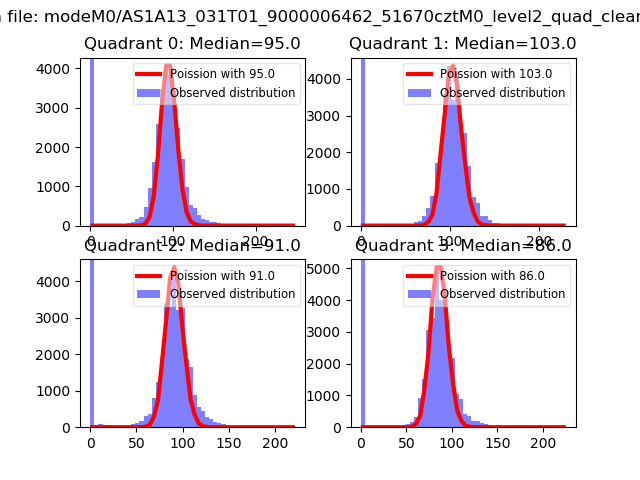
| Comparison with Poisson distribution Blue bars denote a histogram of data divided into 1 sec bins. Red curve is a Poisson curve with rate = median count rate of data. |
 |
 |
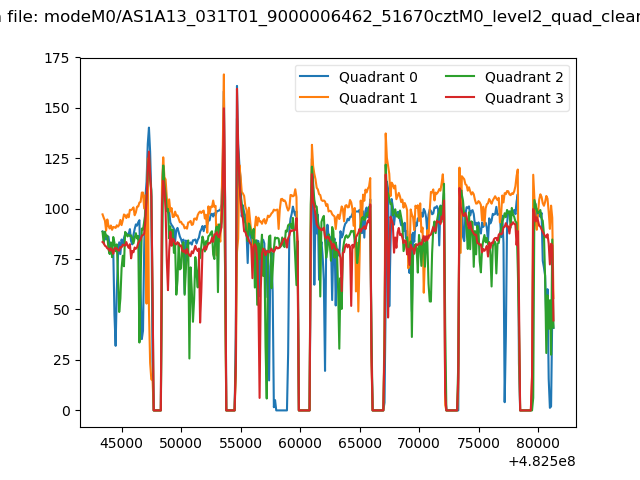
| Quadrant-wise count rates Data is divided into 100 sec bins |
 |
|
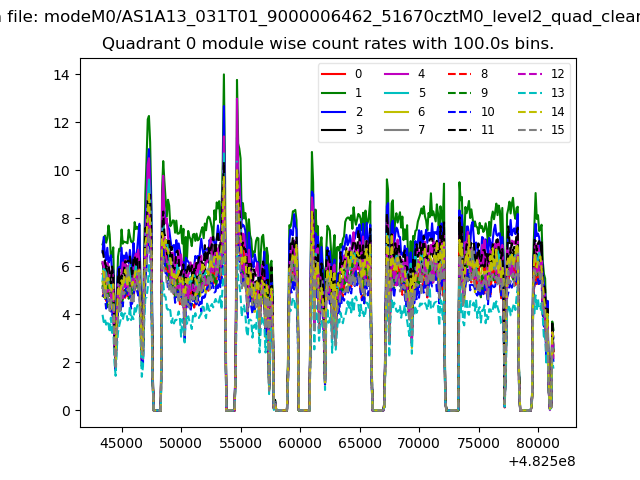
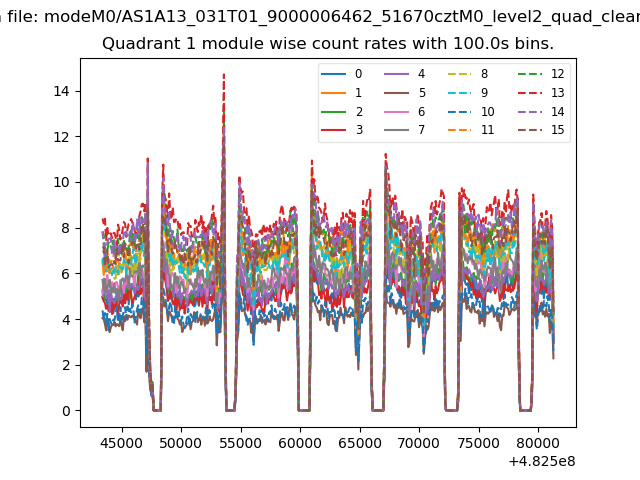
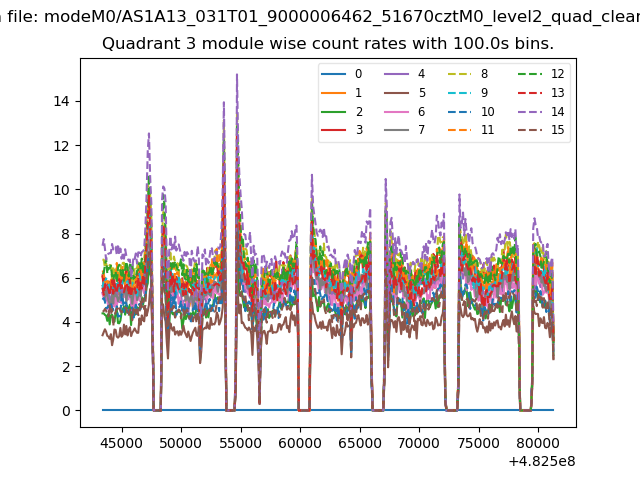
| Module-wise count rates for Quadrant A Data is divided into 100 sec bins |
 |
 |
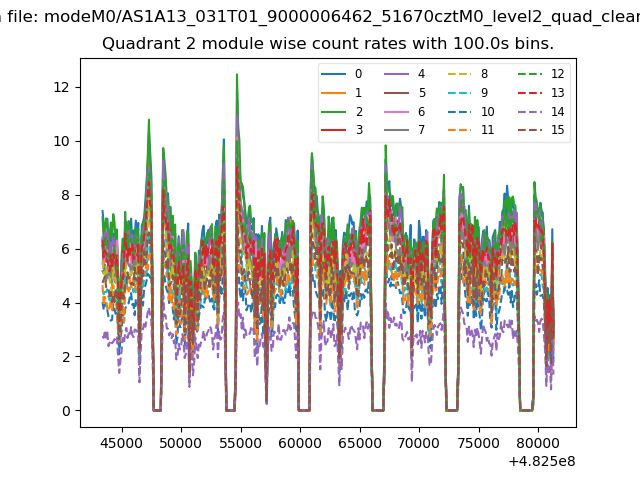
| Module-wise count rates for Quadrant B Data is divided into 100 sec bins |
 |
 |
| Module-wise count rates for Quadrant C Data is divided into 100 sec bins |
 |
 |
| Module-wise count rates for Quadrant D Data is divided into 100 sec bins |
 |
 |
| Parameter | Plot |
|---|---|
| CZT HV Monitor | 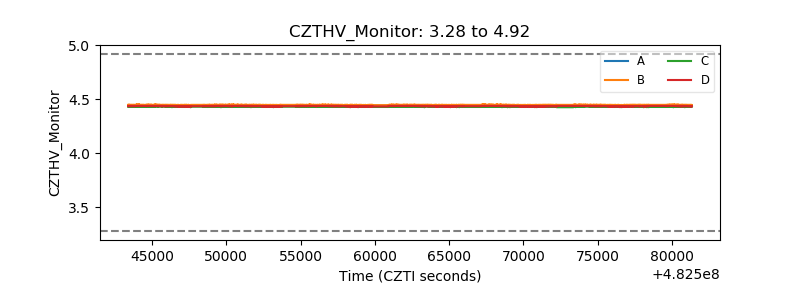 |
| D_VDD | 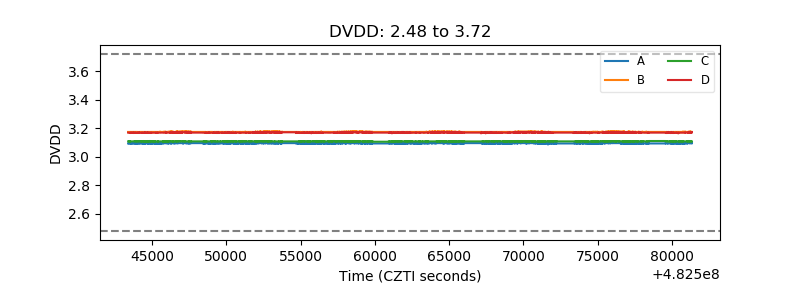 |
| Temperature 1 | 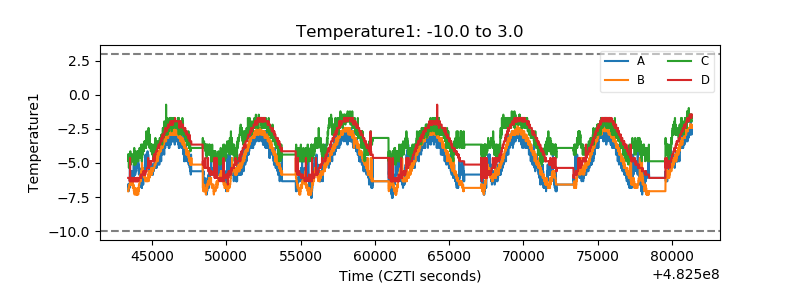 |
| Veto HV Monitor | 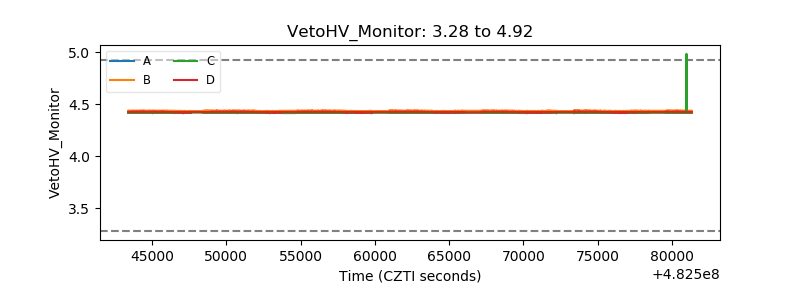 |
| Veto LLD | 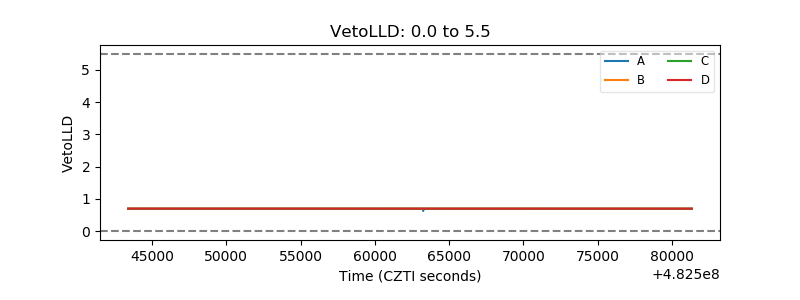 |
| Alpha Counter | 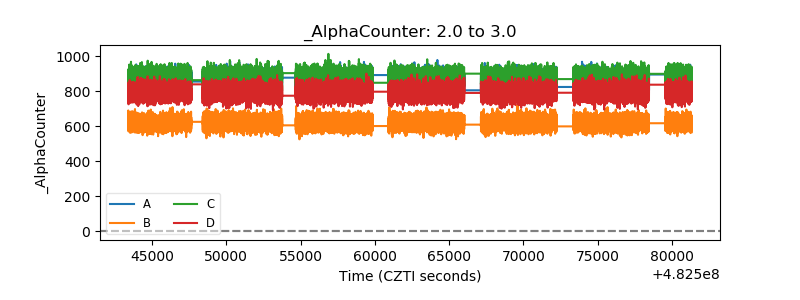 |
| _CPM_Rate | 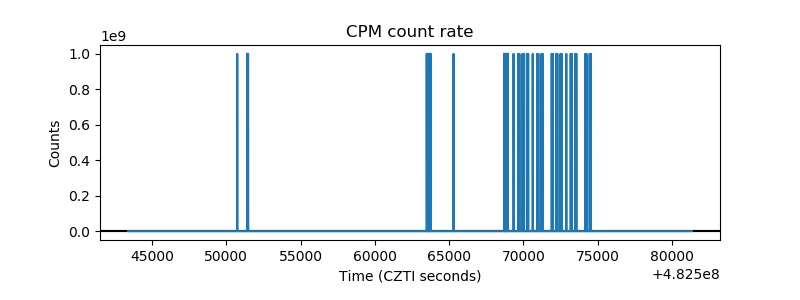 |
| CZT Counter | 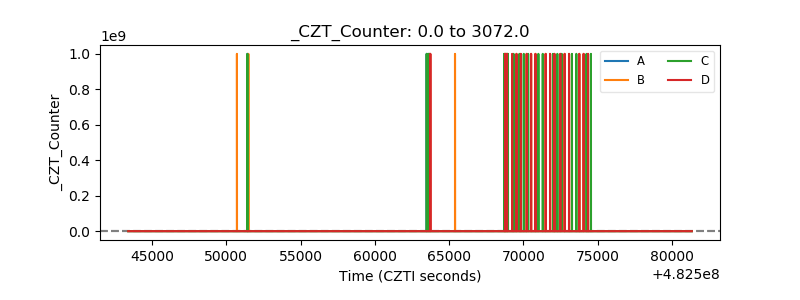 |
| +2.5 Volts monitor | 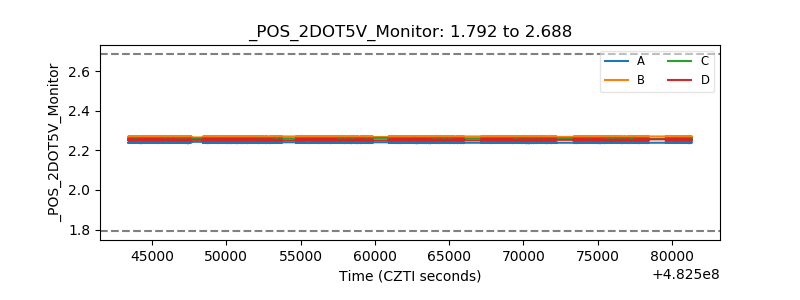 |
| +5 Volts monitor | 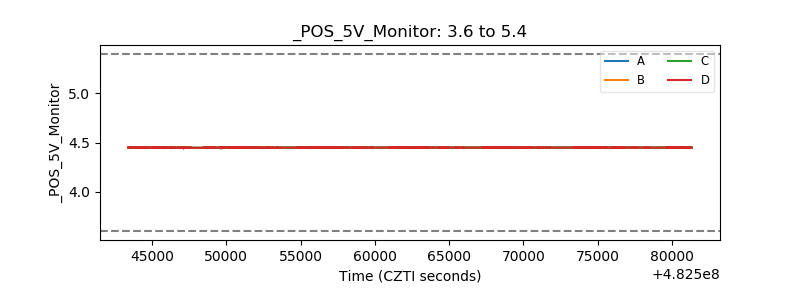 |
| _ROLL_ROT | 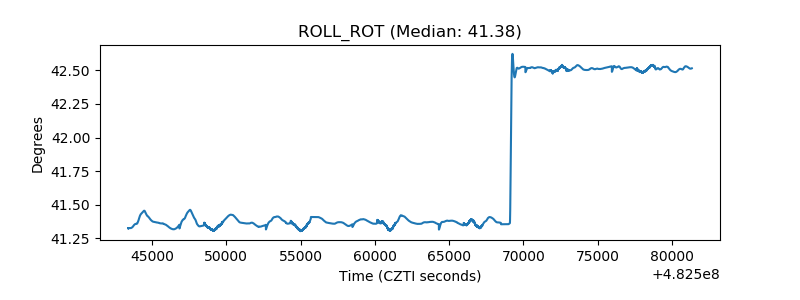 |
| _Roll_DEC | 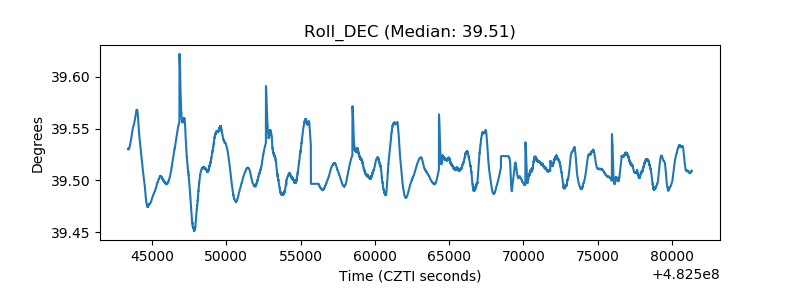 |
| _Roll_RA | 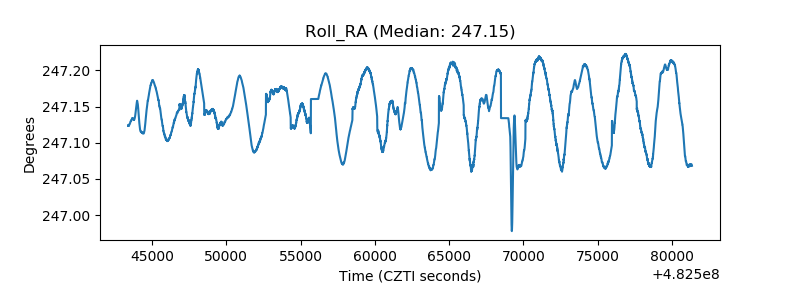 |
| Veto Counter | 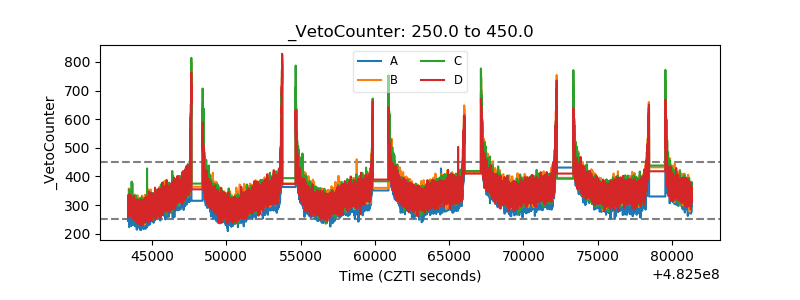 |