| Param | Original file | Final file |
|---|---|---|
| Filename | modeM0/AS1A13_031T01_9000006462_51671cztM0_level2.fits | modeM0/AS1A13_031T01_9000006462_51671cztM0_level2_quad_clean.evt |
| Size (bytes) | 847,938,240 | 85,734,720 |
| Size | 808.7 MB | 81.8 MB |
| Events in quadrant A | 9,295,535 | 511,092 |
| Events in quadrant B | 5,855,853 | 674,133 |
| Events in quadrant C | 11,777,141 | 326,555 |
| Events in quadrant D | 3,915,625 | 594,918 |
| Mode M9 | |||
|---|---|---|---|
| Quadrant | BADHDUFLAG | Total packets | Discarded packets |
| A | 0 | 9 | 0 |
| B | 0 | 10 | 0 |
| C | 0 | 10 | 0 |
| D | 0 | 10 | 0 |
| Mode M0 | |||
|---|---|---|---|
| Quadrant | BADHDUFLAG | Total packets | Discarded packets |
| A | 0 | 32430 | 2 |
| B | 0 | 22169 | 2 |
| C | 0 | 39677 | 10 |
| D | 0 | 16605 | 2 |
| Mode SS | |||
|---|---|---|---|
| Quadrant | BADHDUFLAG | Total packets | Discarded packets |
| A | 0 | 142 | 0 |
| B | 0 | 142 | 0 |
| C | 0 | 142 | 0 |
| D | 0 | 142 | 0 |
| Quadrant | Total seconds | Saturated seconds | Saturation percentage |
|---|---|---|---|
| A | 7021 | 2013 | 28.671129% |
| B | 7021 | 725 | 10.326164% |
| C | 7020 | 3577 | 50.954416% |
| D | 7020 | 282 | 4.017094% |
Noise dominated data is calculated using 1-second bins in cleaned event files. If a bin has >2000 counts, and if more than 50% of those come from <1% of pixels, then it is considered to be noise-dominated and hence unusable.
| Quadrant | # 1 sec bins | Bins with >0 counts | Bins with >2000 counts | High rate bins dominated by noise | Noise dominated (total time) | Noise dominated (detector-on time) | Marked lightcurve |
|---|---|---|---|---|---|---|---|
| A | 7916 | 7021 | 1713 | 1713 | 21.64% | 24.40% | 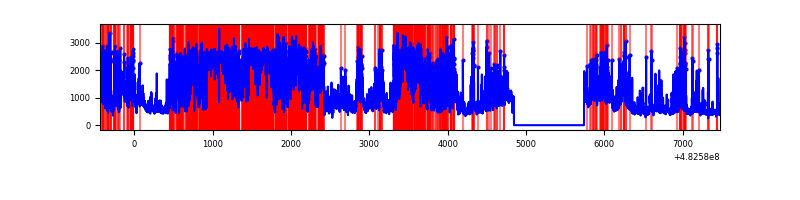 |
| B | 7916 | 7021 | 450 | 450 | 5.68% | 6.41% | 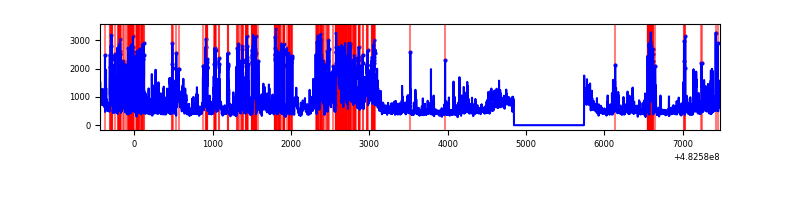 |
| C | 7914 | 7019 | 3499 | 3499 | 44.21% | 49.85% | 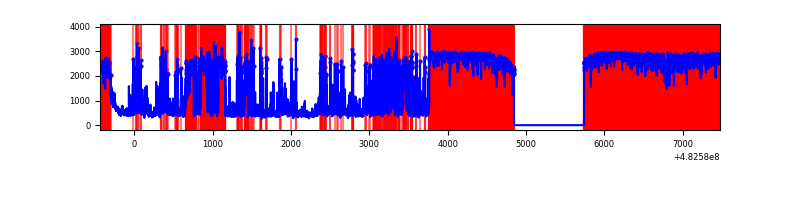 |
| D | 7915 | 7020 | 148 | 148 | 1.87% | 2.11% | 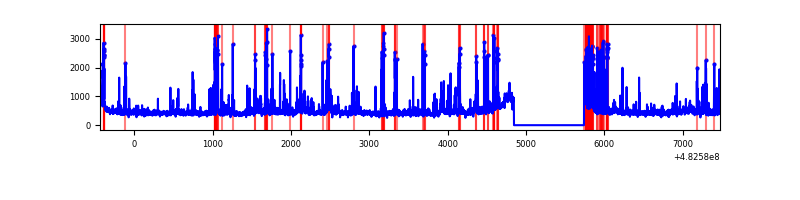 |
Top three noisy pixels from each quadrant. If the there are fewer than three noisy pixels in the level2.evt file, extra rows are filled as -1
| Pixel properties | Quadrant properties | ||||||
|---|---|---|---|---|---|---|---|
| Quadrant | DetID | PixID | Counts | Sigma | Mean | Median | Sigma |
| A | 7 | 64 | 5199458 | 30620.97 | 696 | 678 | 169.8 |
| A | 12 | 3 | 377452 | 2219.21 | 696 | 678 | 169.8 |
| A | 3 | 14 | 254015 | 1492.16 | 696 | 678 | 169.8 |
| B | 5 | 172 | 1347428 | 8404.31 | 749 | 722 | 160.2 |
| B | 1 | 223 | 342929 | 2135.59 | 749 | 722 | 160.2 |
| B | 10 | 128 | 176999 | 1100.08 | 749 | 722 | 160.2 |
| C | 5 | 250 | 7022424 | 52670.36 | 489 | 485 | 133.3 |
| C | 15 | 189 | 2187251 | 16402.55 | 489 | 485 | 133.3 |
| C | 0 | 192 | 179167 | 1340.26 | 489 | 485 | 133.3 |
| D | 3 | 12 | 228066 | 1108.35 | 749 | 720 | 205.1 |
| D | 2 | 120 | 171182 | 831.03 | 749 | 720 | 205.1 |
| D | 8 | 176 | 99701 | 482.55 | 749 | 720 | 205.1 |
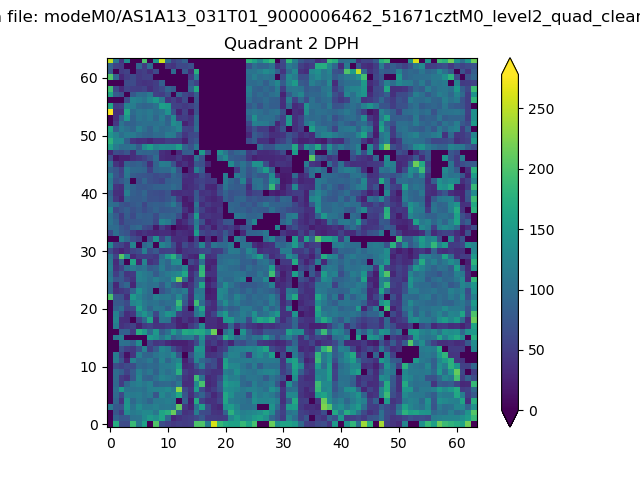
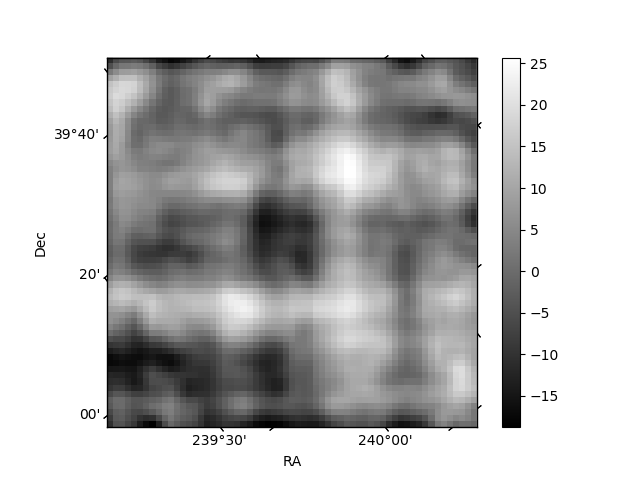
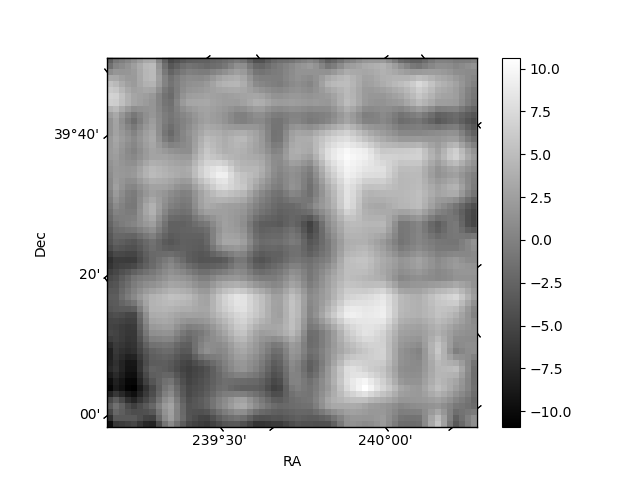
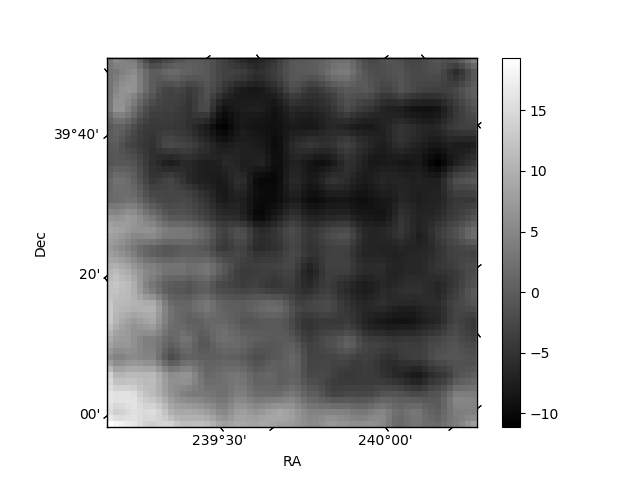
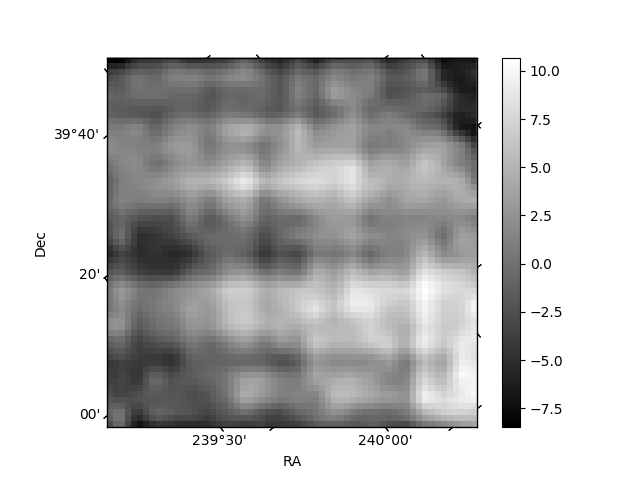
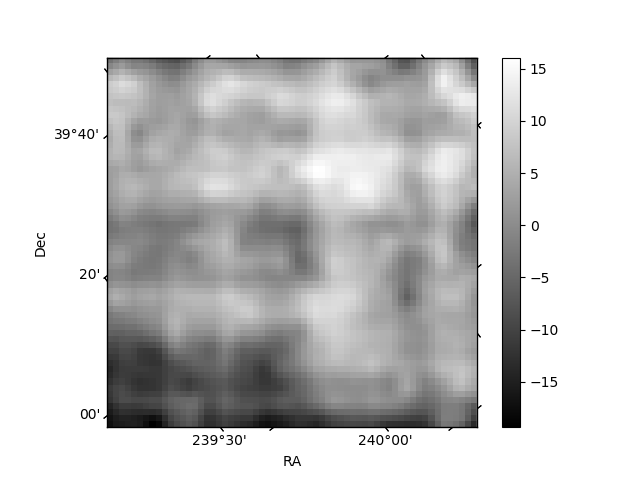
Histogram calculated using DETX and DETY for each event in the final _common_clean file
| Quadrant A | 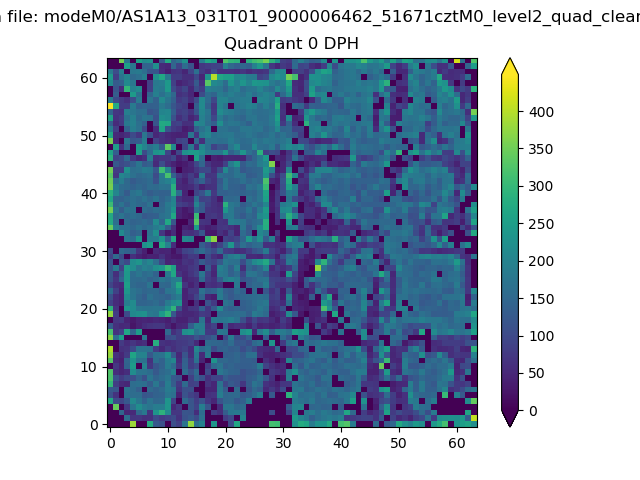 |
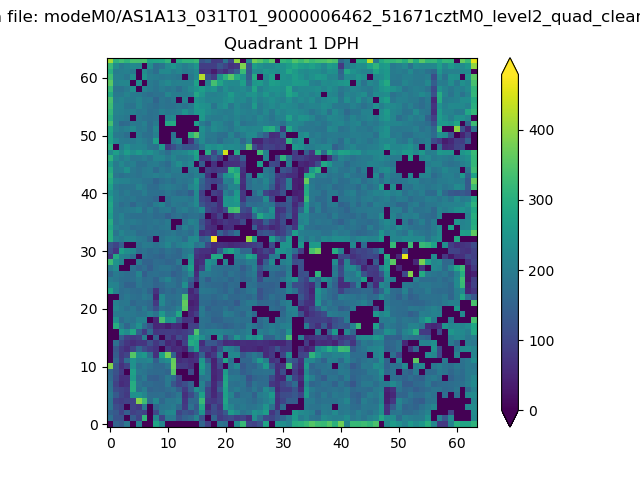 |
Quadrant B |
|---|---|---|---|
| Quadrant D | 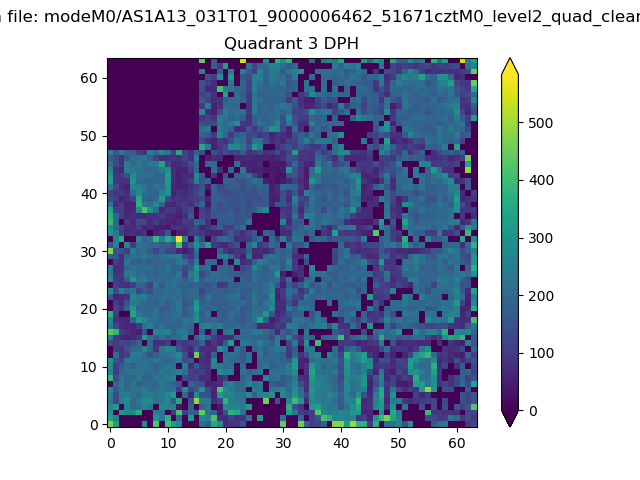 |
 |
Quadrant C |
| Plot type | Count rate plots | Images |
|---|---|---|
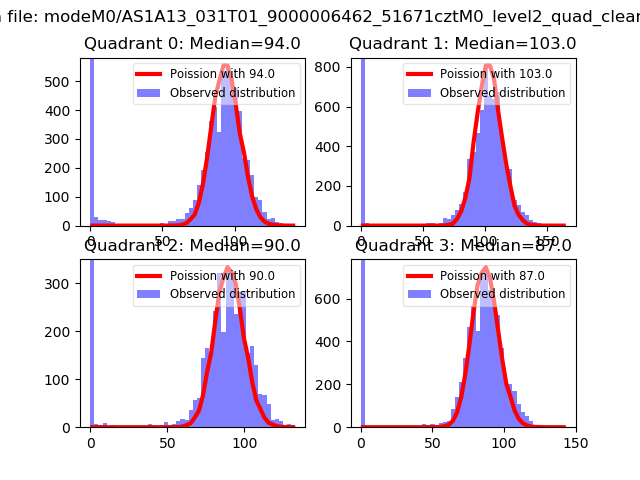
| Comparison with Poisson distribution Blue bars denote a histogram of data divided into 1 sec bins. Red curve is a Poisson curve with rate = median count rate of data. |
 |
 |
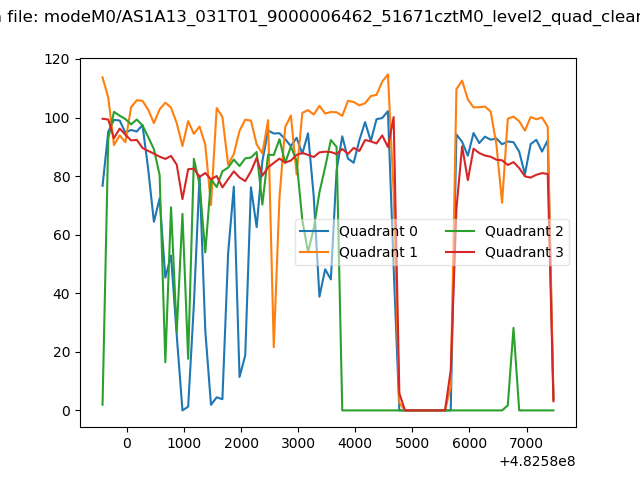
| Quadrant-wise count rates Data is divided into 100 sec bins |
 |
|
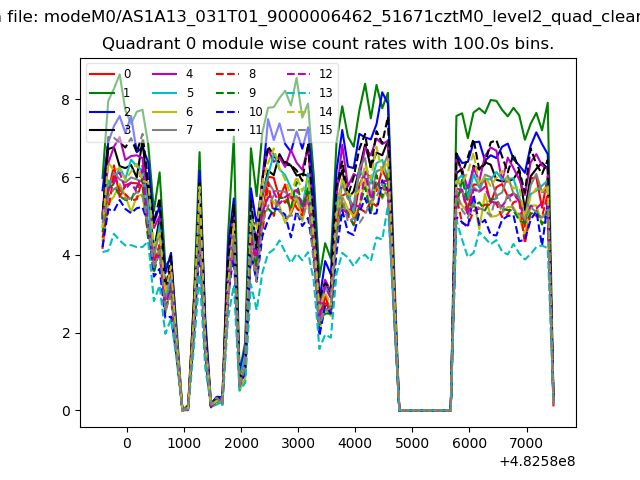
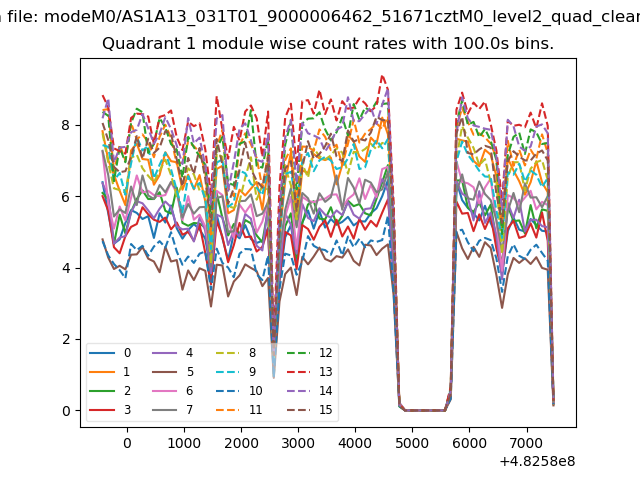
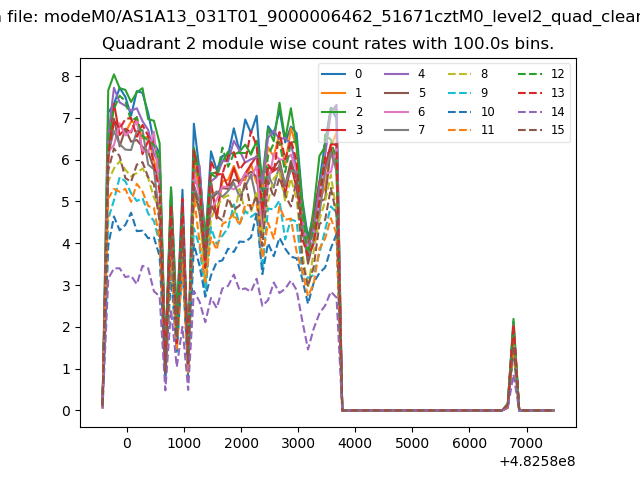
| Module-wise count rates for Quadrant A Data is divided into 100 sec bins |
 |
 |
| Module-wise count rates for Quadrant B Data is divided into 100 sec bins |
 |
 |
| Module-wise count rates for Quadrant C Data is divided into 100 sec bins |
 |
 |
| Module-wise count rates for Quadrant D Data is divided into 100 sec bins |
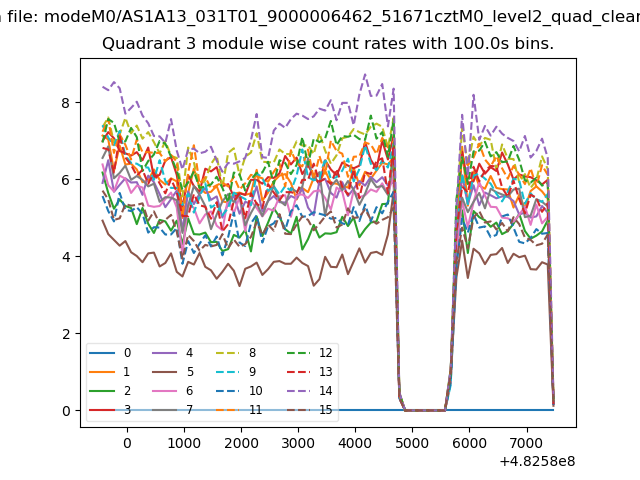 |
 |
| Parameter | Plot |
|---|---|
| CZT HV Monitor | 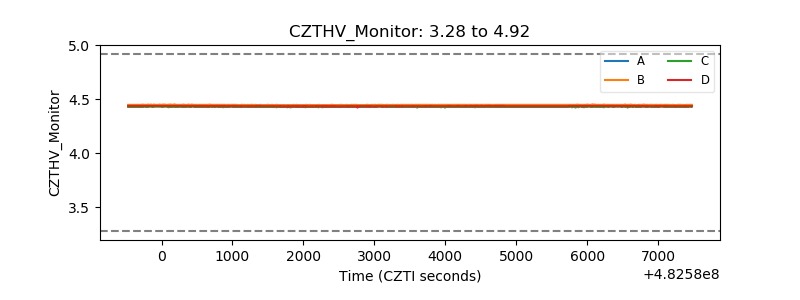 |
| D_VDD | 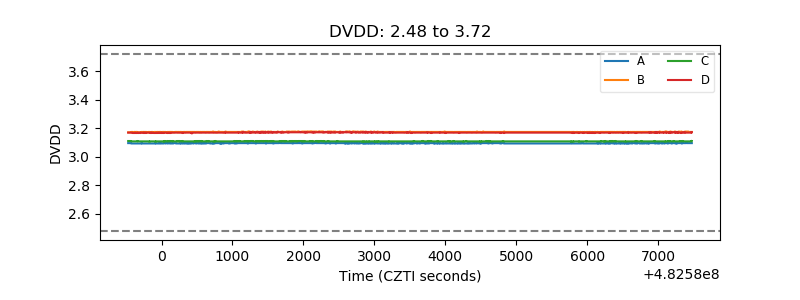 |
| Temperature 1 | 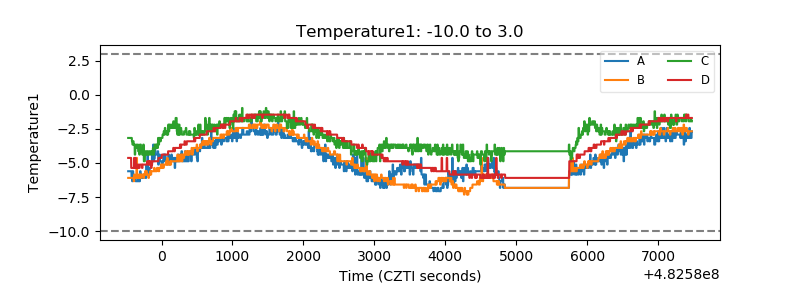 |
| Veto HV Monitor | 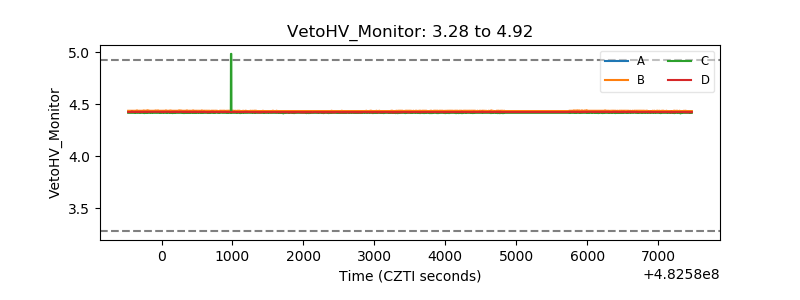 |
| Veto LLD | 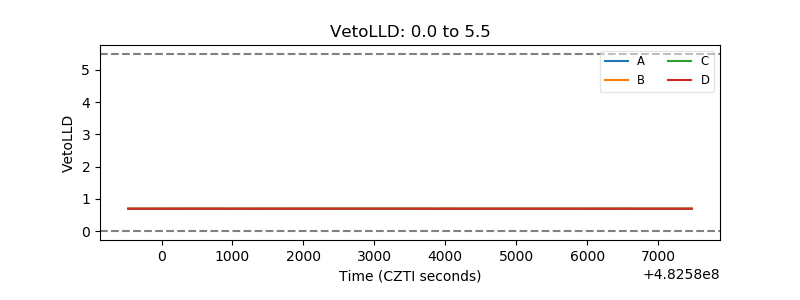 |
| Alpha Counter | 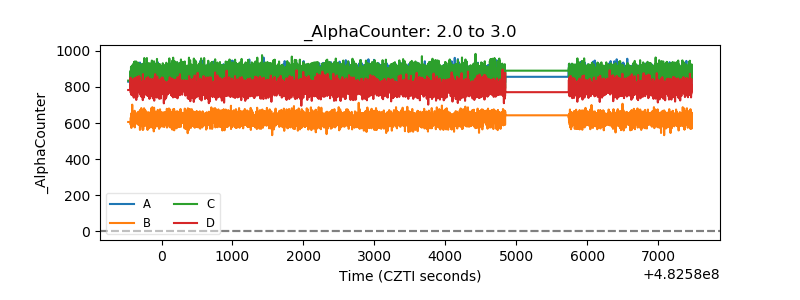 |
| _CPM_Rate | 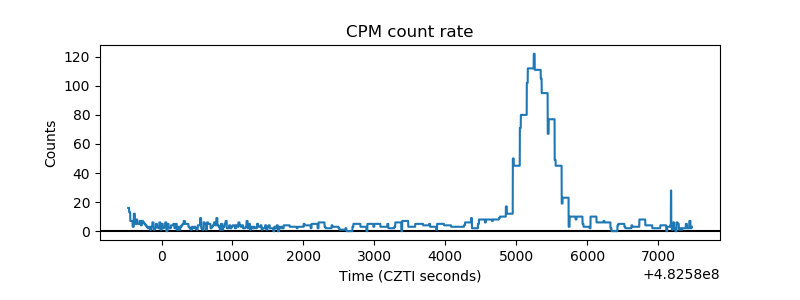 |
| CZT Counter | 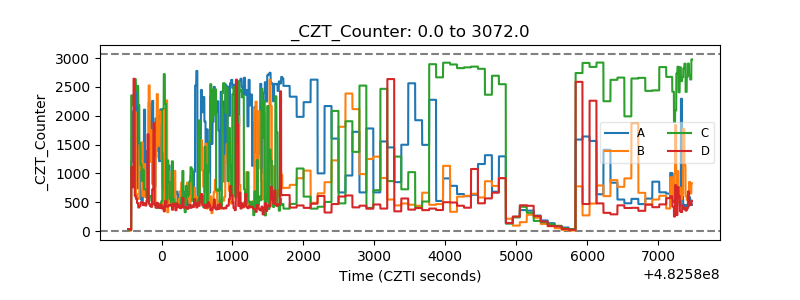 |
| +2.5 Volts monitor | 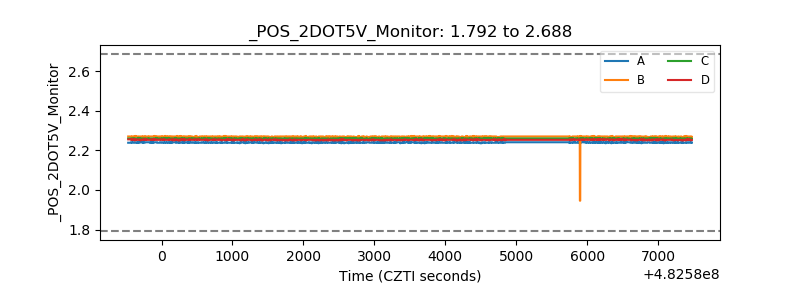 |
| +5 Volts monitor | 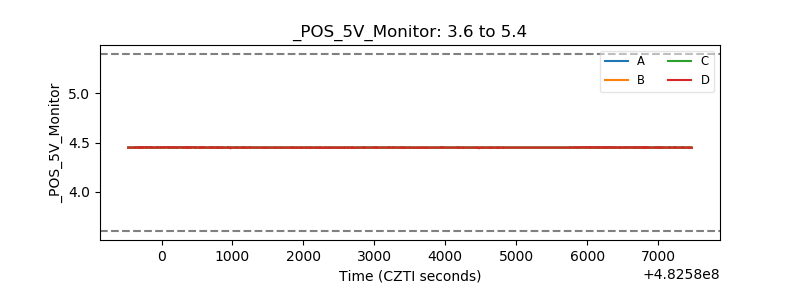 |
| _ROLL_ROT | 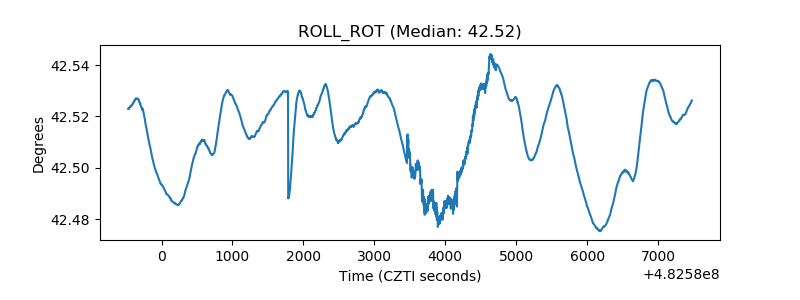 |
| _Roll_DEC | 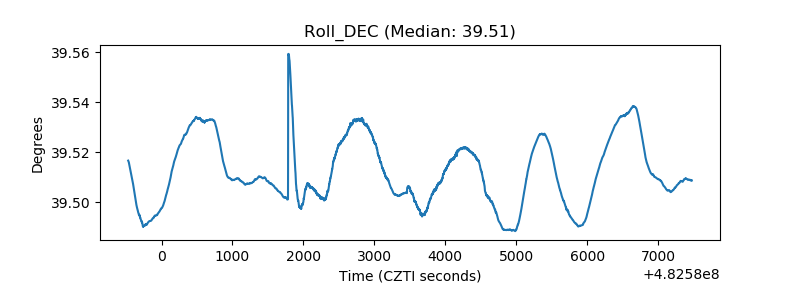 |
| _Roll_RA | 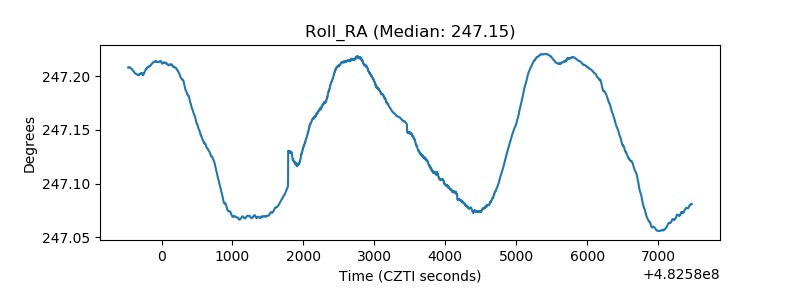 |
| Veto Counter | 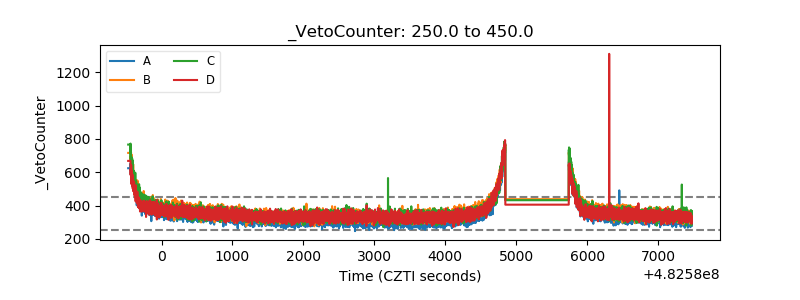 |