| Param | Original file | Final file |
|---|---|---|
| Filename | modeM0/AS1A13_031T01_9000006462_51672cztM0_level2.fits | modeM0/AS1A13_031T01_9000006462_51672cztM0_level2_quad_clean.evt |
| Size (bytes) | 874,045,440 | 80,945,280 |
| Size | 833.6 MB | 77.2 MB |
| Events in quadrant A | 6,419,476 | 581,937 |
| Events in quadrant B | 5,250,505 | 674,703 |
| Events in quadrant C | 16,198,303 | 119,182 |
| Events in quadrant D | 3,938,472 | 583,286 |
| Mode M9 | |||
|---|---|---|---|
| Quadrant | BADHDUFLAG | Total packets | Discarded packets |
| A | 0 | 5 | 0 |
| B | 0 | 5 | 0 |
| C | 0 | 5 | 0 |
| D | 0 | 5 | 0 |
| Mode M0 | |||
|---|---|---|---|
| Quadrant | BADHDUFLAG | Total packets | Discarded packets |
| A | 0 | 23849 | 1 |
| B | 0 | 20424 | 1 |
| C | 0 | 52709 | 9 |
| D | 0 | 16755 | 4 |
| Mode SS | |||
|---|---|---|---|
| Quadrant | BADHDUFLAG | Total packets | Discarded packets |
| A | 0 | 144 | 0 |
| B | 0 | 144 | 0 |
| C | 0 | 144 | 0 |
| D | 0 | 144 | 0 |
| Quadrant | Total seconds | Saturated seconds | Saturation percentage |
|---|---|---|---|
| A | 7058 | 1052 | 14.905072% |
| B | 7058 | 562 | 7.962596% |
| C | 7057 | 5753 | 81.521893% |
| D | 7056 | 298 | 4.223356% |
Noise dominated data is calculated using 1-second bins in cleaned event files. If a bin has >2000 counts, and if more than 50% of those come from <1% of pixels, then it is considered to be noise-dominated and hence unusable.
| Quadrant | # 1 sec bins | Bins with >0 counts | Bins with >2000 counts | High rate bins dominated by noise | Noise dominated (total time) | Noise dominated (detector-on time) | Marked lightcurve |
|---|---|---|---|---|---|---|---|
| A | 7538 | 7058 | 733 | 733 | 9.72% | 10.39% | 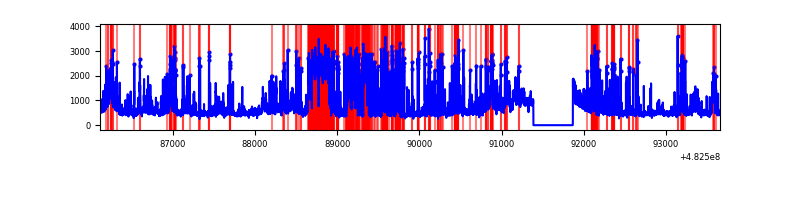 |
| B | 7538 | 7058 | 229 | 229 | 3.04% | 3.24% | 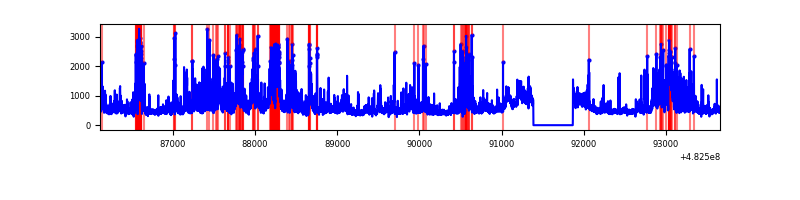 |
| C | 7538 | 7057 | 5691 | 5691 | 75.50% | 80.64% | 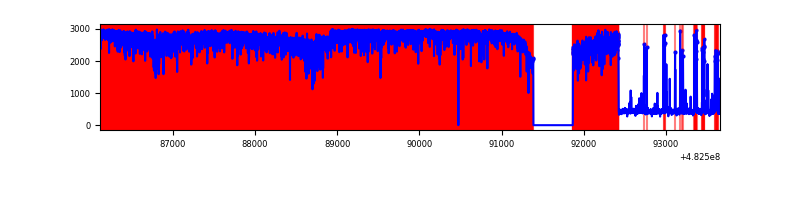 |
| D | 7538 | 7058 | 110 | 110 | 1.46% | 1.56% | 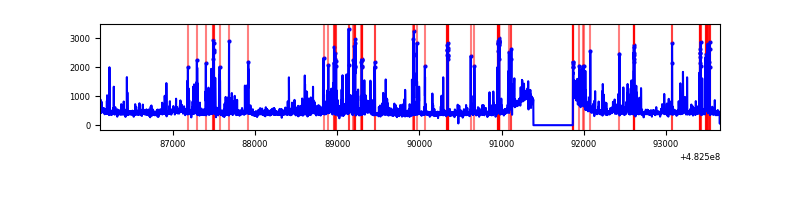 |
Top three noisy pixels from each quadrant. If the there are fewer than three noisy pixels in the level2.evt file, extra rows are filled as -1
| Pixel properties | Quadrant properties | ||||||
|---|---|---|---|---|---|---|---|
| Quadrant | DetID | PixID | Counts | Sigma | Mean | Median | Sigma |
| A | 7 | 64 | 2633758 | 14801.01 | 731 | 712 | 177.9 |
| A | 12 | 3 | 310288 | 1740.2 | 731 | 712 | 177.9 |
| A | 5 | 240 | 144333 | 807.33 | 731 | 712 | 177.9 |
| B | 10 | 44 | 703717 | 4340.63 | 753 | 723 | 162.0 |
| B | 5 | 172 | 236618 | 1456.53 | 753 | 723 | 162.0 |
| B | 1 | 223 | 218139 | 1342.43 | 753 | 723 | 162.0 |
| C | 5 | 250 | 13665584 | 147449.37 | 341 | 337 | 92.7 |
| C | 15 | 189 | 862727 | 9305.27 | 341 | 337 | 92.7 |
| C | 0 | 192 | 149422 | 1608.64 | 341 | 337 | 92.7 |
| D | 3 | 12 | 349940 | 1696.57 | 751 | 723 | 205.8 |
| D | 2 | 249 | 121390 | 586.23 | 751 | 723 | 205.8 |
| D | 1 | 3 | 77831 | 374.61 | 751 | 723 | 205.8 |
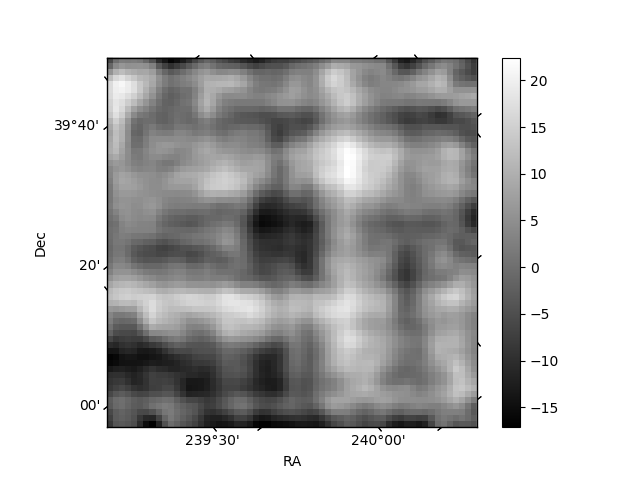
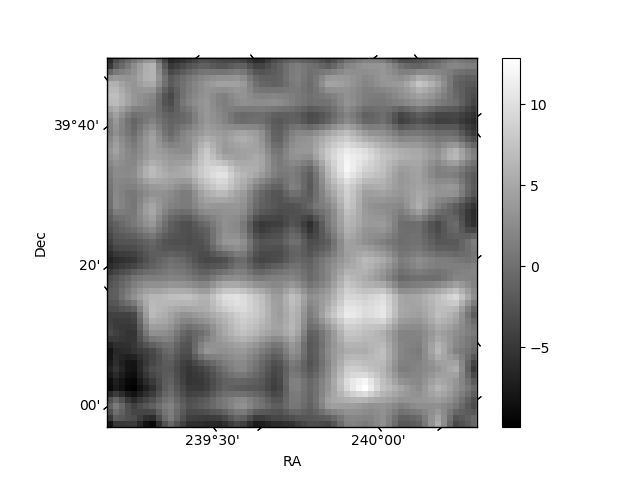
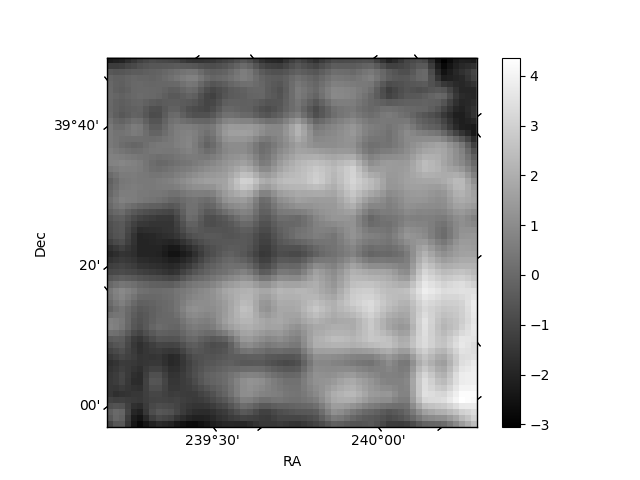
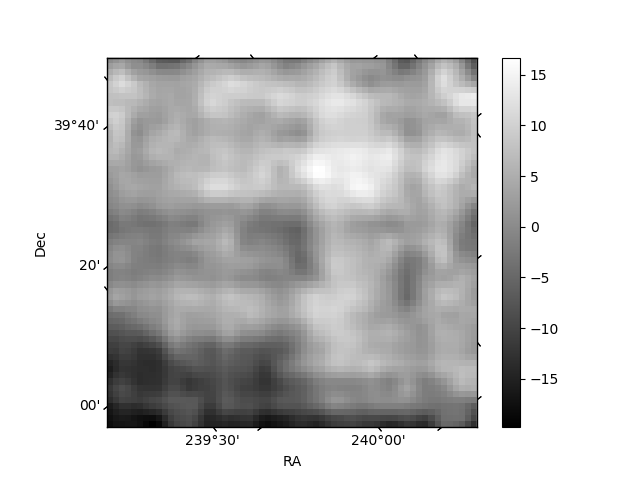
Histogram calculated using DETX and DETY for each event in the final _common_clean file
| Quadrant A | 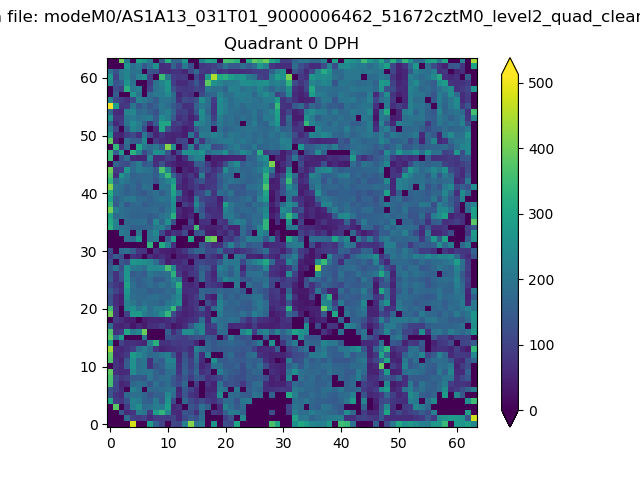 |
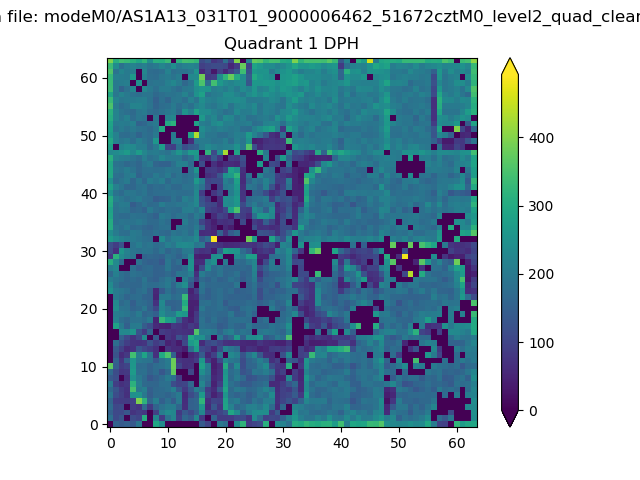 |
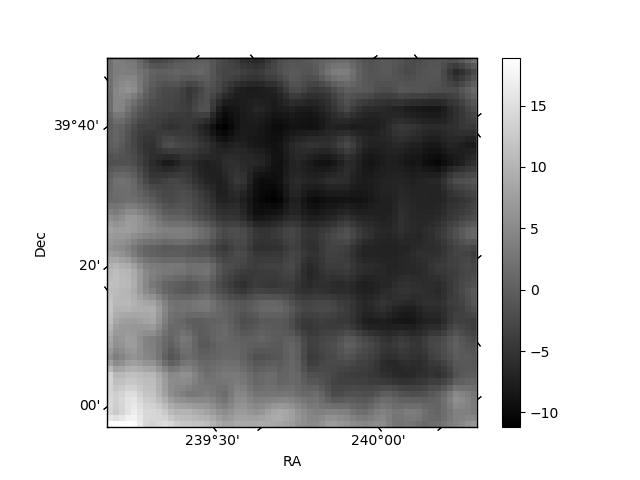
Quadrant B |
|---|---|---|---|
| Quadrant D | 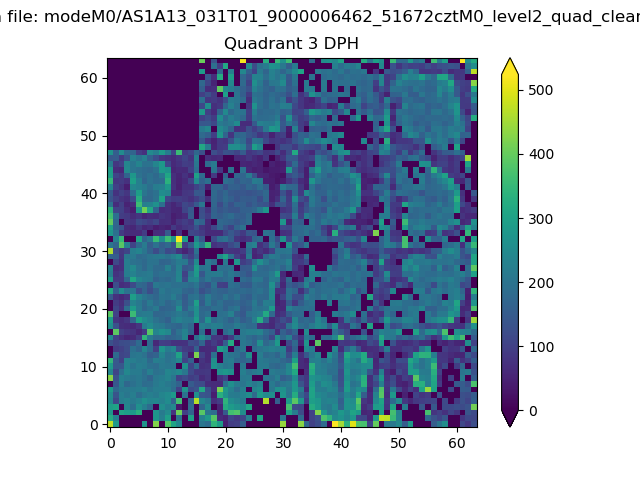 |
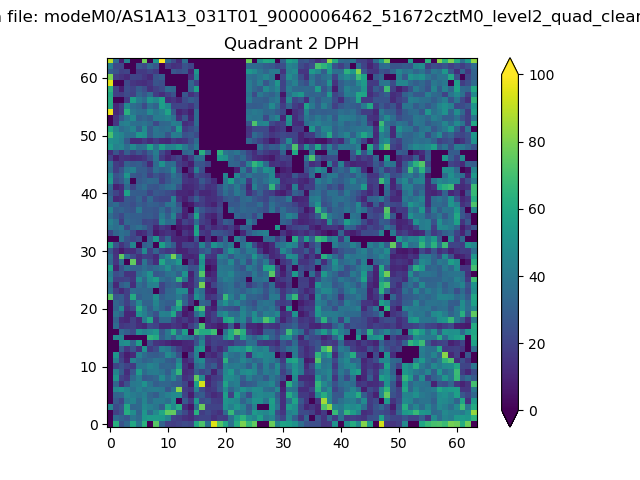 |
Quadrant C |
| Plot type | Count rate plots | Images |
|---|---|---|
| Comparison with Poisson distribution Blue bars denote a histogram of data divided into 1 sec bins. Red curve is a Poisson curve with rate = median count rate of data. |
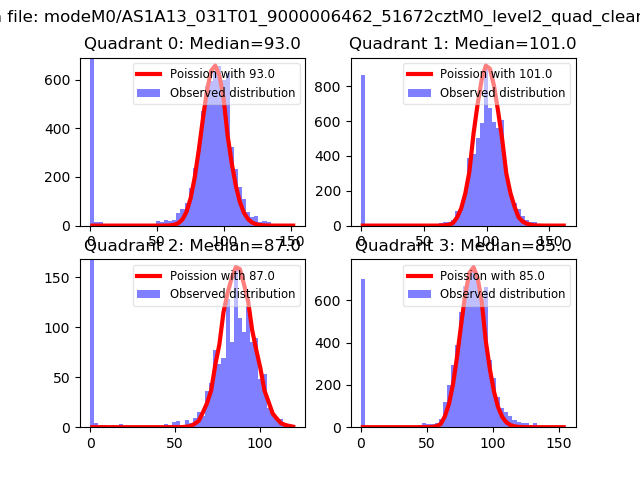 |
 |
| Quadrant-wise count rates Data is divided into 100 sec bins |
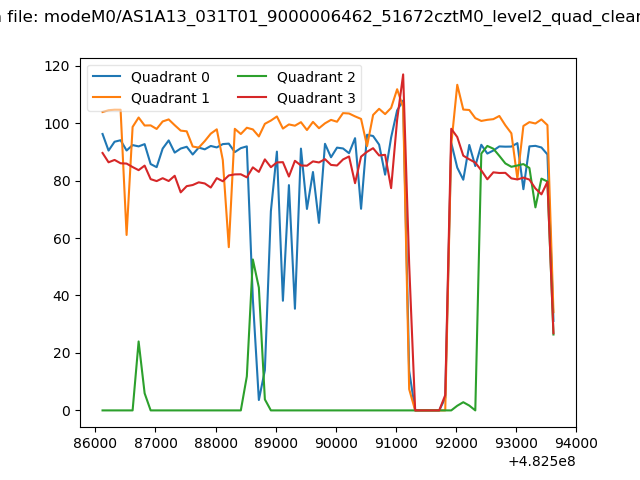 |
|
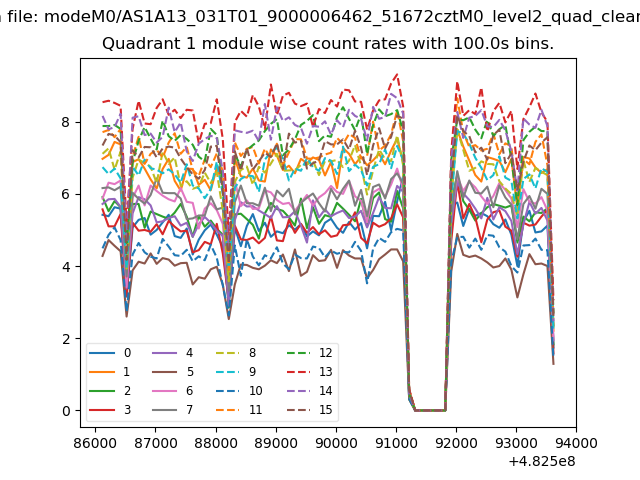
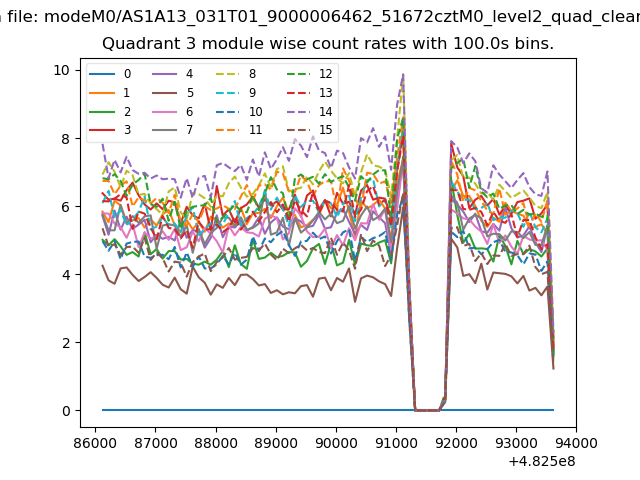
| Module-wise count rates for Quadrant A Data is divided into 100 sec bins |
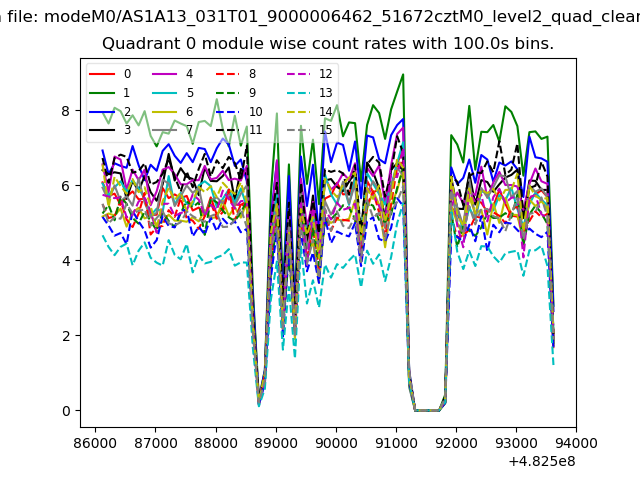 |
 |
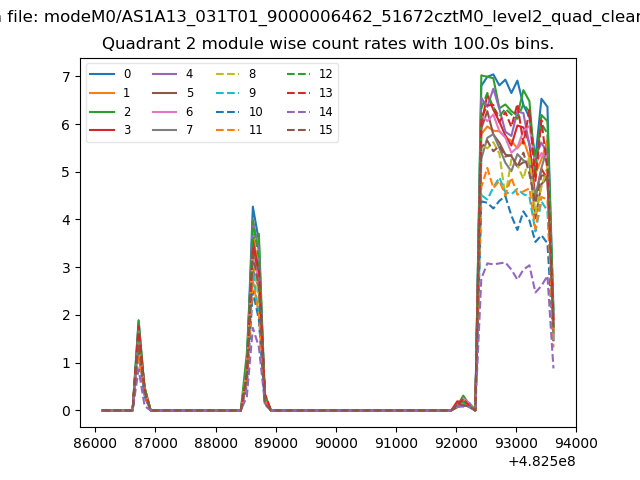
| Module-wise count rates for Quadrant B Data is divided into 100 sec bins |
 |
 |
| Module-wise count rates for Quadrant C Data is divided into 100 sec bins |
 |
 |
| Module-wise count rates for Quadrant D Data is divided into 100 sec bins |
 |
 |
| Parameter | Plot |
|---|---|
| CZT HV Monitor | 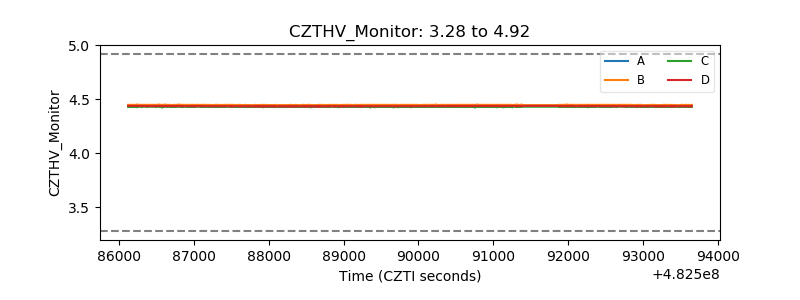 |
| D_VDD | 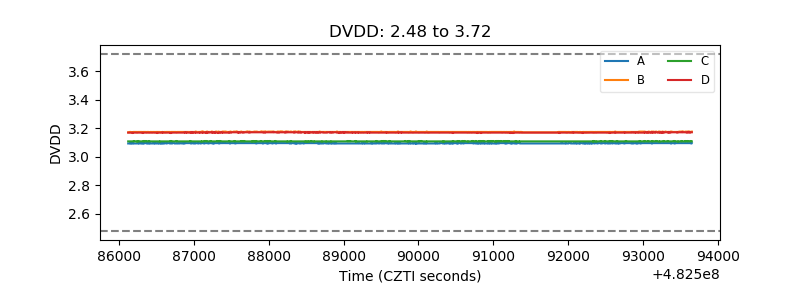 |
| Temperature 1 | 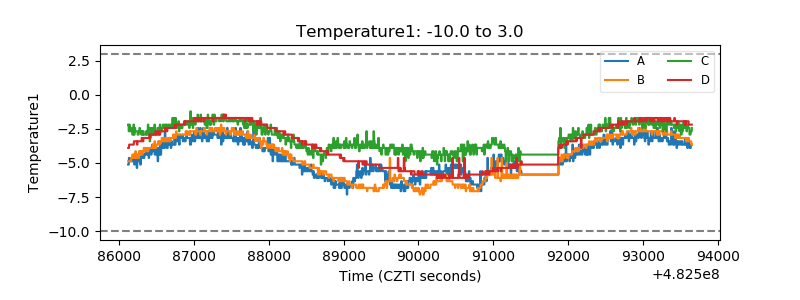 |
| Veto HV Monitor | 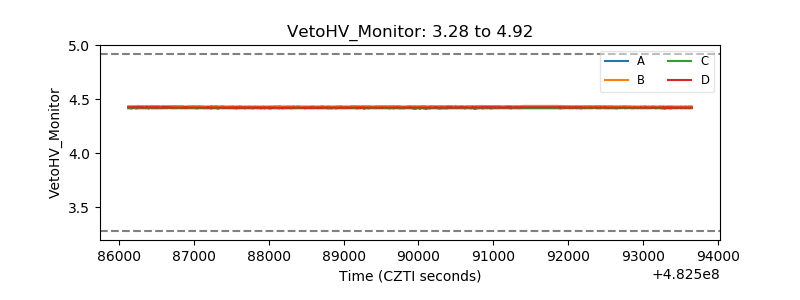 |
| Veto LLD | 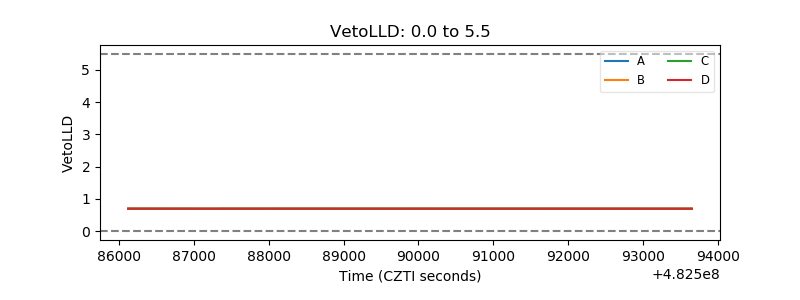 |
| Alpha Counter | 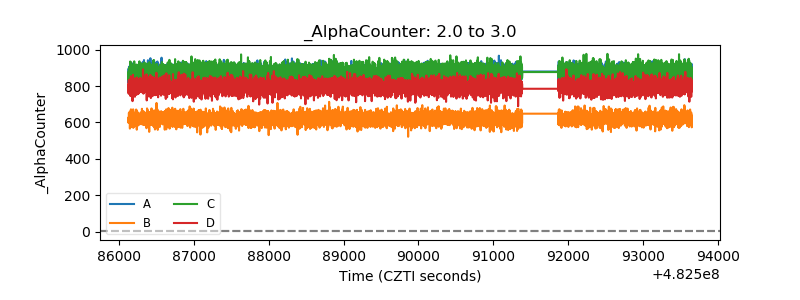 |
| _CPM_Rate | 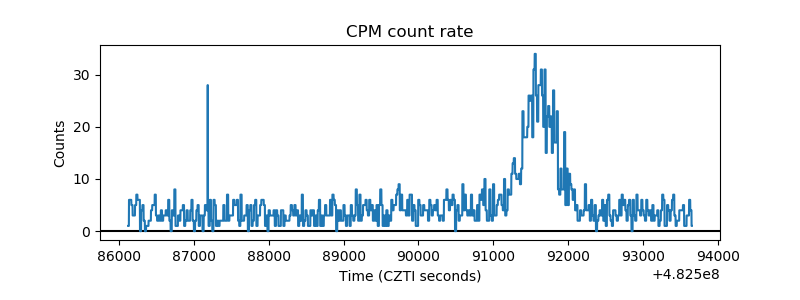 |
| CZT Counter | 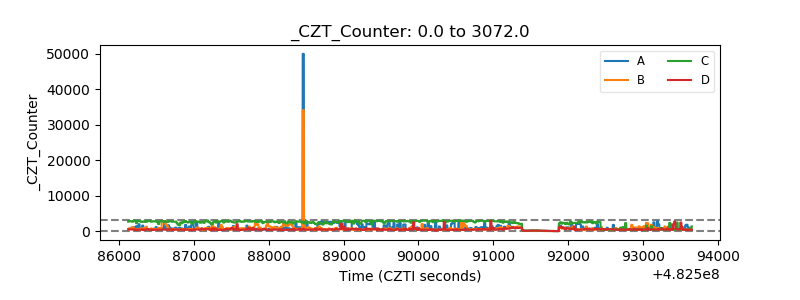 |
| +2.5 Volts monitor | 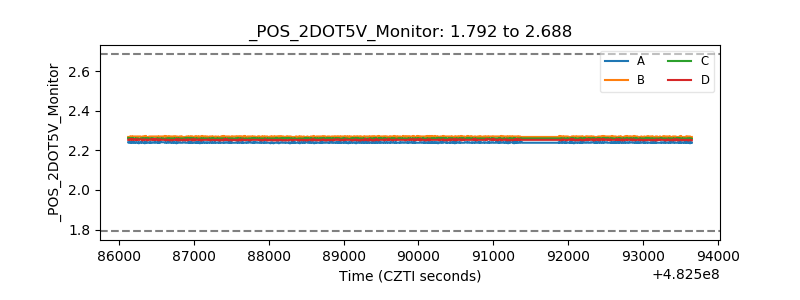 |
| +5 Volts monitor | 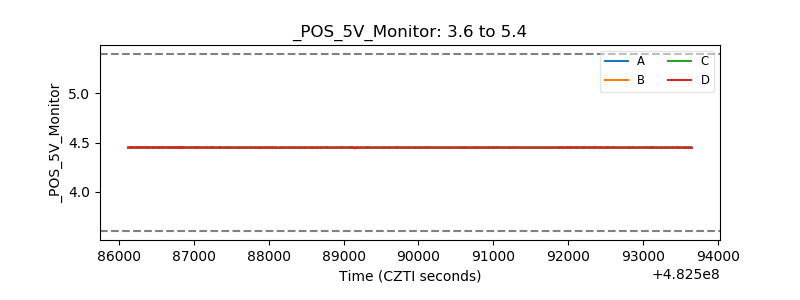 |
| _ROLL_ROT | 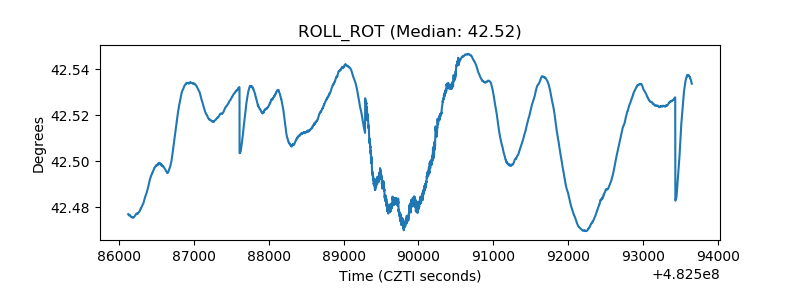 |
| _Roll_DEC | 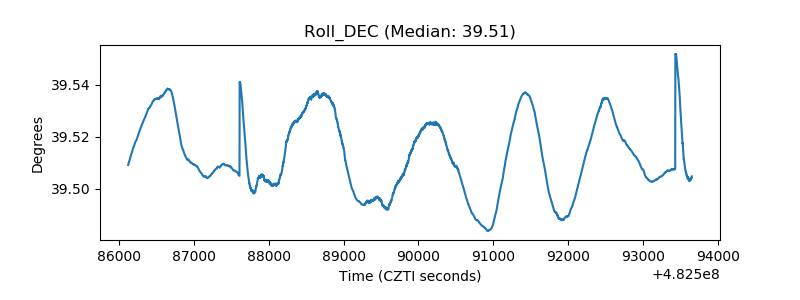 |
| _Roll_RA | 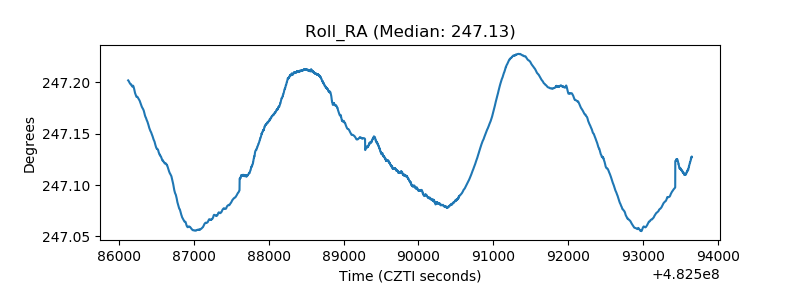 |
| Veto Counter | 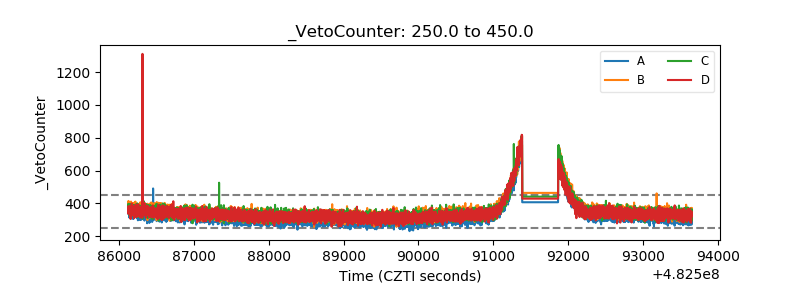 |