| Param | Original file | Final file |
|---|---|---|
| Filename | modeM0/AS1A13_031T01_9000006462_51673cztM0_level2.fits | modeM0/AS1A13_031T01_9000006462_51673cztM0_level2_quad_clean.evt |
| Size (bytes) | 645,240,960 | 108,587,520 |
| Size | 615.3 MB | 103.6 MB |
| Events in quadrant A | 7,224,742 | 658,958 |
| Events in quadrant B | 5,267,647 | 784,355 |
| Events in quadrant C | 6,596,858 | 628,857 |
| Events in quadrant D | 4,180,626 | 664,920 |
| Mode M9 | |||
|---|---|---|---|
| Quadrant | BADHDUFLAG | Total packets | Discarded packets |
| A | 0 | 4 | 0 |
| B | 0 | 5 | 0 |
| C | 0 | 5 | 0 |
| D | 0 | 5 | 0 |
| Mode M0 | |||
|---|---|---|---|
| Quadrant | BADHDUFLAG | Total packets | Discarded packets |
| A | 0 | 26974 | 1 |
| B | 0 | 21028 | 1 |
| C | 0 | 25317 | 1 |
| D | 0 | 18379 | 1 |
| Mode SS | |||
|---|---|---|---|
| Quadrant | BADHDUFLAG | Total packets | Discarded packets |
| A | 0 | 160 | 0 |
| B | 0 | 160 | 0 |
| C | 0 | 160 | 0 |
| D | 0 | 160 | 0 |
| Quadrant | Total seconds | Saturated seconds | Saturation percentage |
|---|---|---|---|
| A | 7924 | 1172 | 14.790510% |
| B | 7924 | 425 | 5.363453% |
| C | 7924 | 1102 | 13.907118% |
| D | 7924 | 175 | 2.208481% |
Noise dominated data is calculated using 1-second bins in cleaned event files. If a bin has >2000 counts, and if more than 50% of those come from <1% of pixels, then it is considered to be noise-dominated and hence unusable.
| Quadrant | # 1 sec bins | Bins with >0 counts | Bins with >2000 counts | High rate bins dominated by noise | Noise dominated (total time) | Noise dominated (detector-on time) | Marked lightcurve |
|---|---|---|---|---|---|---|---|
| A | 7923 | 7923 | 878 | 878 | 11.08% | 11.08% | 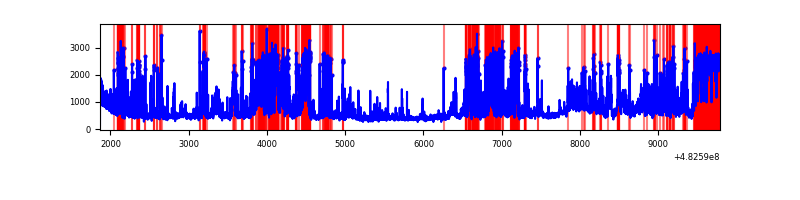 |
| B | 7924 | 7924 | 153 | 153 | 1.93% | 1.93% | 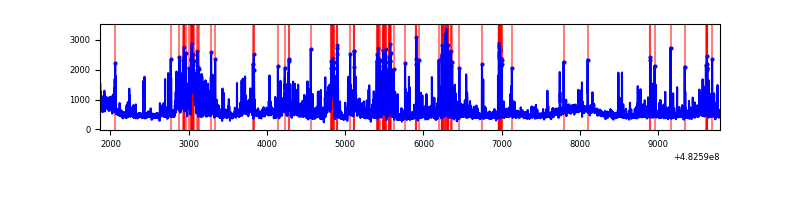 |
| C | 7924 | 7924 | 962 | 962 | 12.14% | 12.14% | 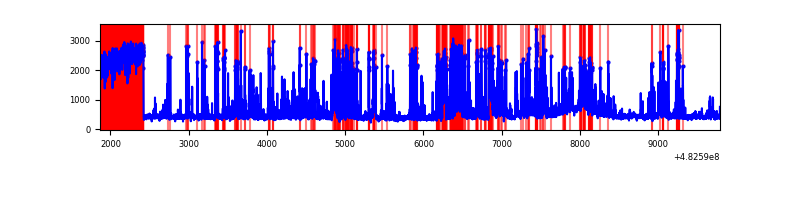 |
| D | 7924 | 7924 | 112 | 112 | 1.41% | 1.41% | 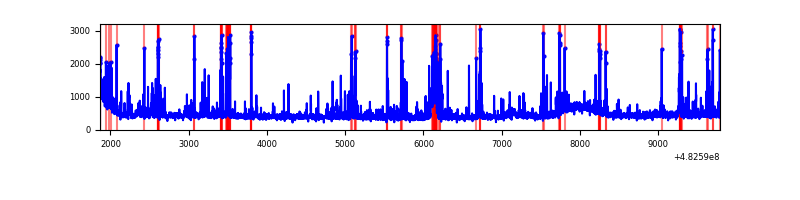 |
Top three noisy pixels from each quadrant. If the there are fewer than three noisy pixels in the level2.evt file, extra rows are filled as -1
| Pixel properties | Quadrant properties | ||||||
|---|---|---|---|---|---|---|---|
| Quadrant | DetID | PixID | Counts | Sigma | Mean | Median | Sigma |
| A | 7 | 64 | 2676764 | 13531.48 | 819 | 798 | 197.8 |
| A | 12 | 250 | 276352 | 1393.38 | 819 | 798 | 197.8 |
| A | 12 | 3 | 268024 | 1351.27 | 819 | 798 | 197.8 |
| B | 10 | 44 | 484511 | 2638.13 | 856 | 823 | 183.3 |
| B | 12 | 32 | 290510 | 1580.01 | 856 | 823 | 183.3 |
| B | 10 | 128 | 238303 | 1295.26 | 856 | 823 | 183.3 |
| C | 15 | 189 | 1398977 | 6618.44 | 785 | 780 | 211.3 |
| C | 5 | 250 | 1205815 | 5704.1 | 785 | 780 | 211.3 |
| C | 12 | 249 | 166727 | 785.52 | 785 | 780 | 211.3 |
| D | 2 | 249 | 197048 | 854.2 | 840 | 809 | 229.7 |
| D | 3 | 12 | 135941 | 588.21 | 840 | 809 | 229.7 |
| D | 6 | 42 | 130591 | 564.92 | 840 | 809 | 229.7 |
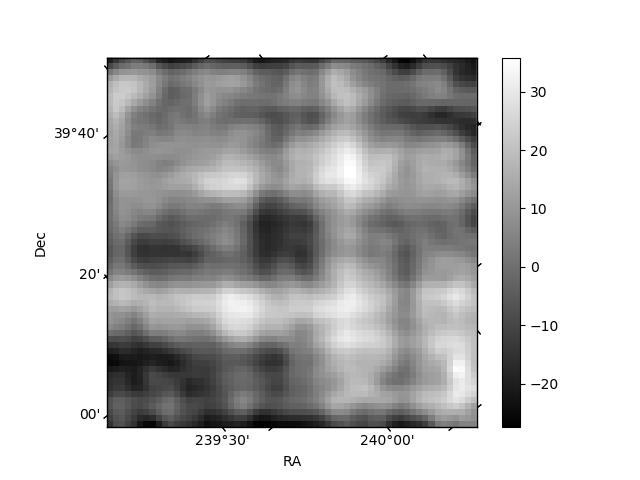
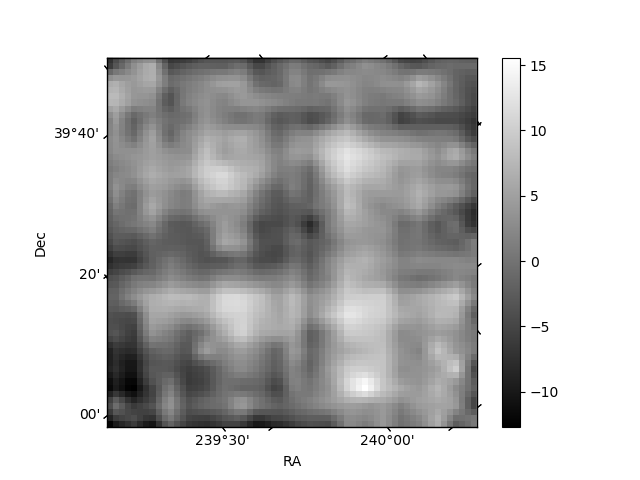
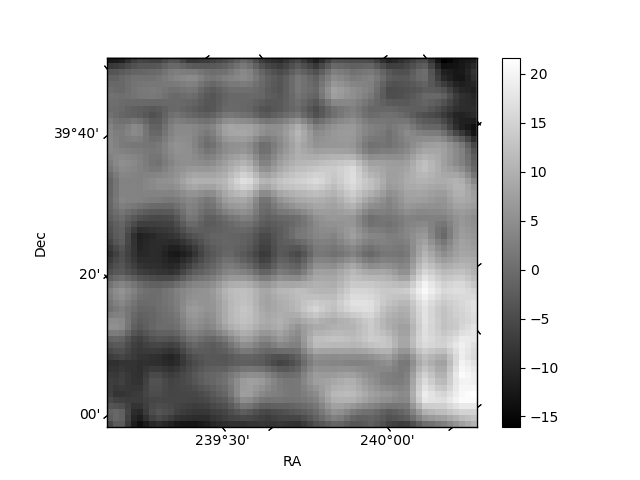
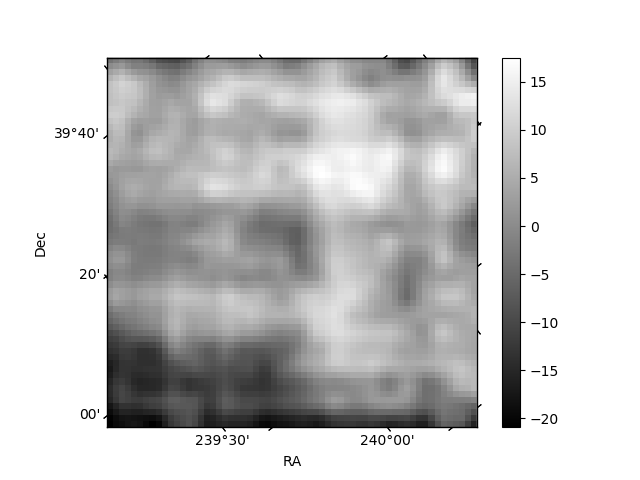
Histogram calculated using DETX and DETY for each event in the final _common_clean file
| Quadrant A | 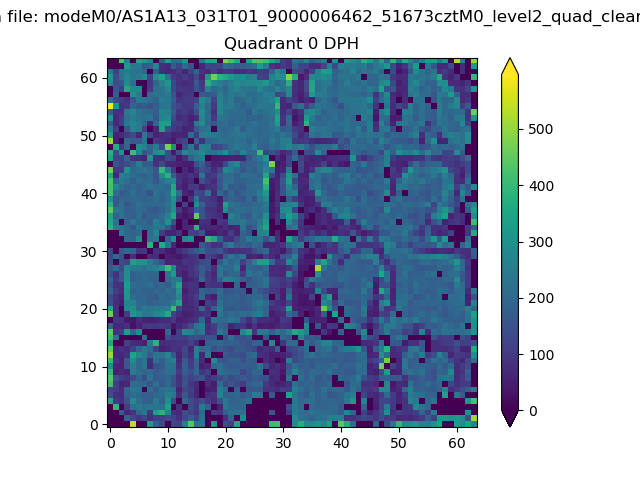 |
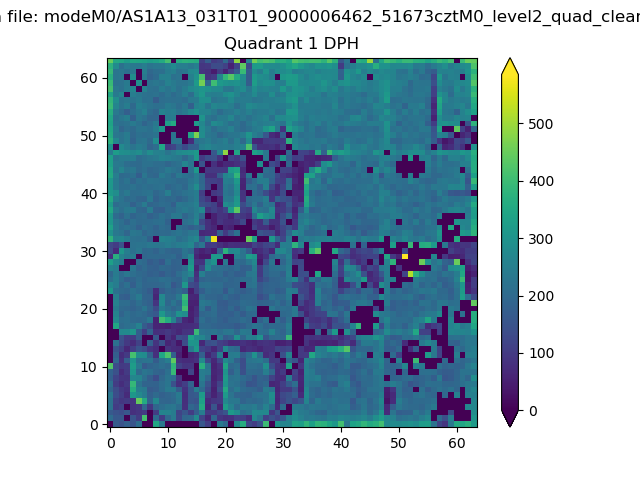 |
Quadrant B |
|---|---|---|---|
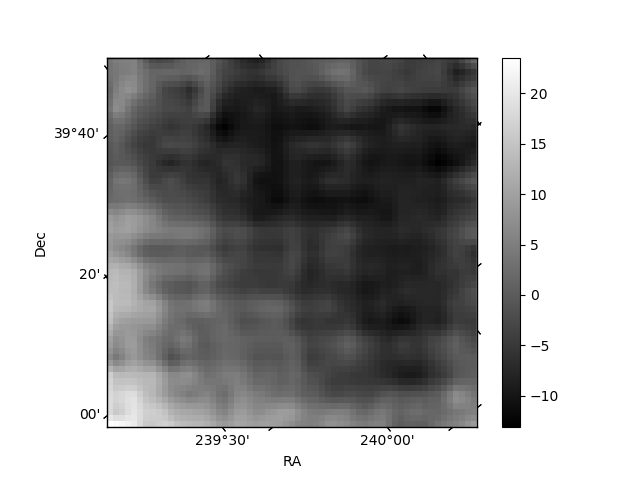
| Quadrant D | 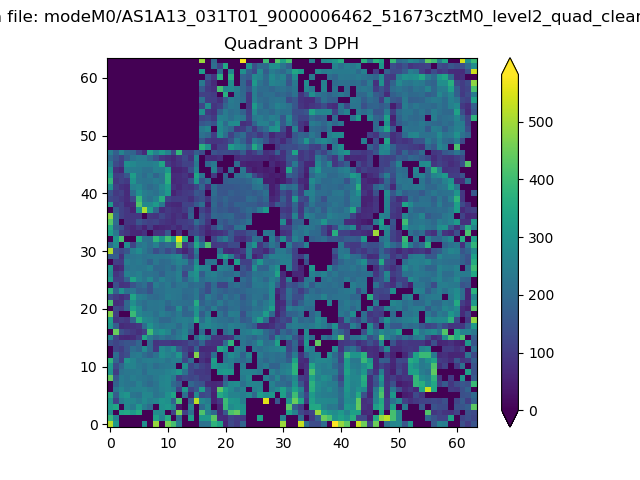 |
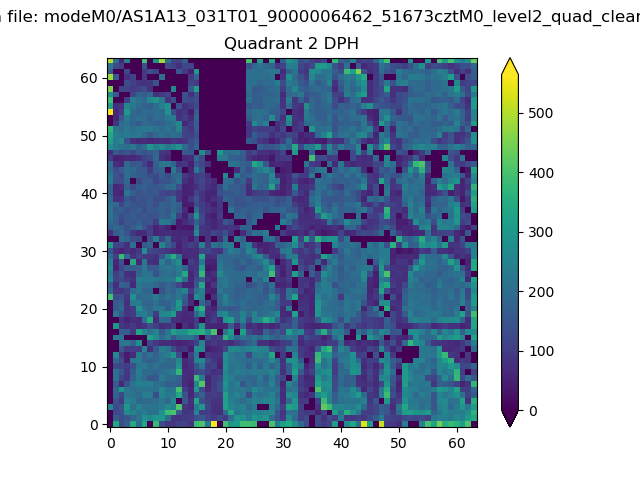 |
Quadrant C |
| Plot type | Count rate plots | Images |
|---|---|---|
| Comparison with Poisson distribution Blue bars denote a histogram of data divided into 1 sec bins. Red curve is a Poisson curve with rate = median count rate of data. |
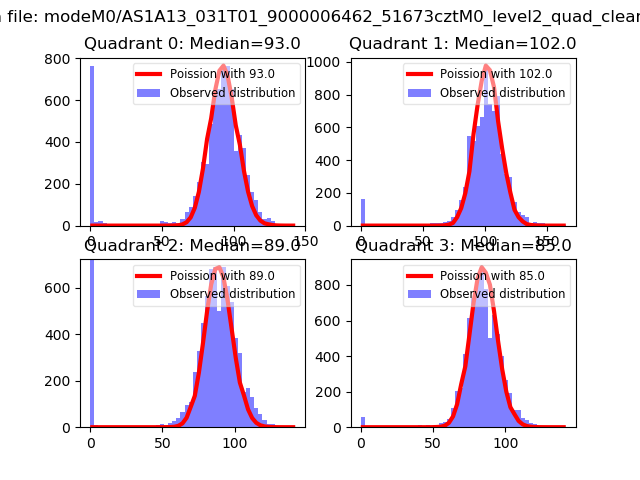 |
 |
| Quadrant-wise count rates Data is divided into 100 sec bins |
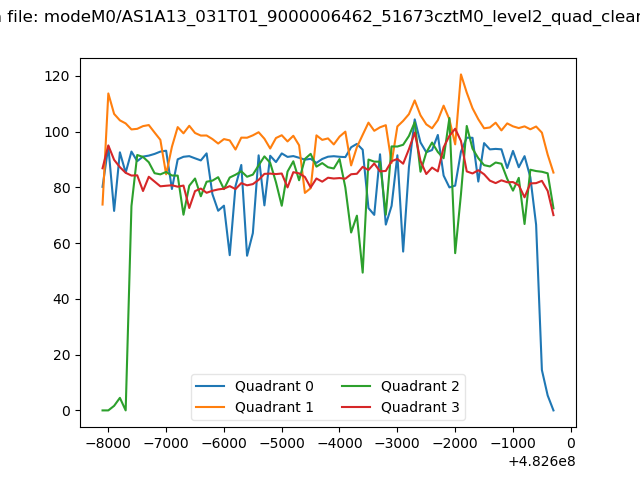 |
|
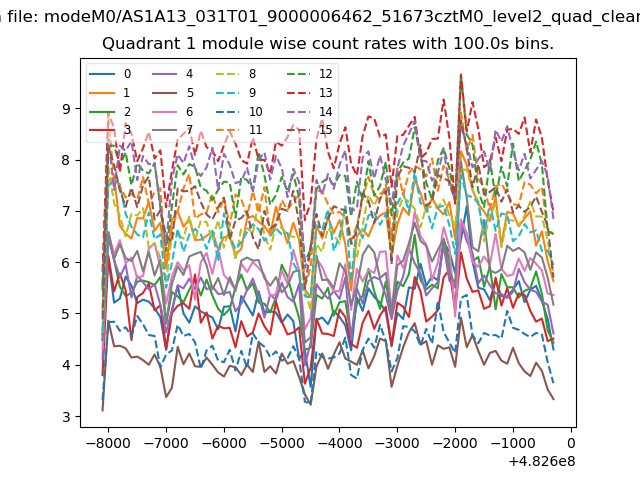
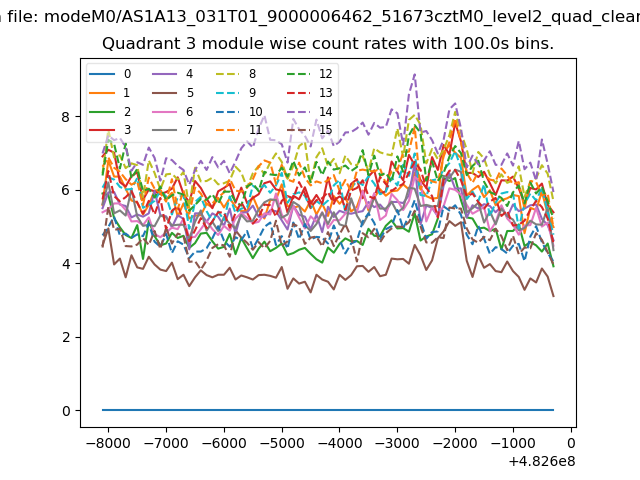
| Module-wise count rates for Quadrant A Data is divided into 100 sec bins |
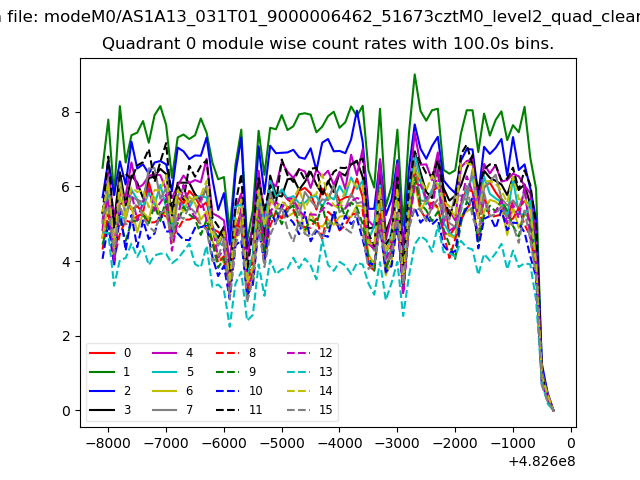 |
 |
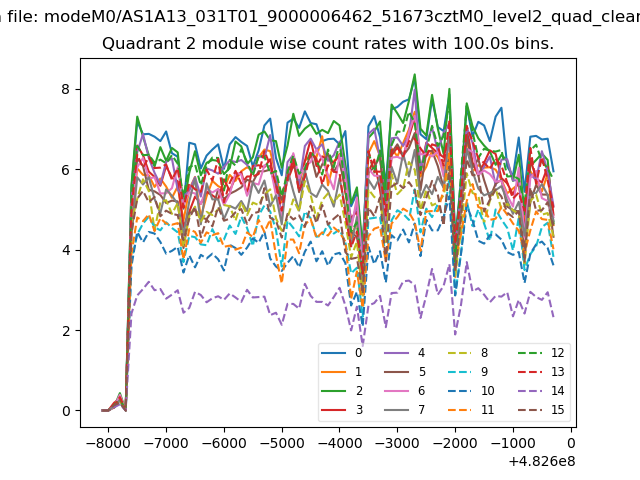
| Module-wise count rates for Quadrant B Data is divided into 100 sec bins |
 |
 |
| Module-wise count rates for Quadrant C Data is divided into 100 sec bins |
 |
 |
| Module-wise count rates for Quadrant D Data is divided into 100 sec bins |
 |
 |
| Parameter | Plot |
|---|---|
| CZT HV Monitor | 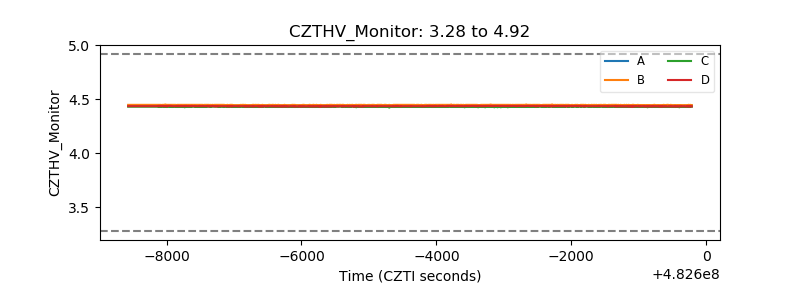 |
| D_VDD | 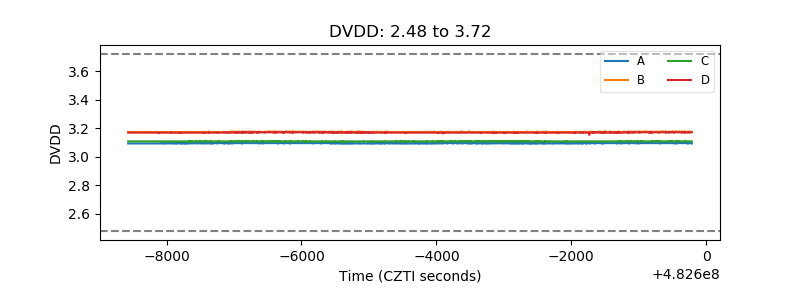 |
| Temperature 1 | 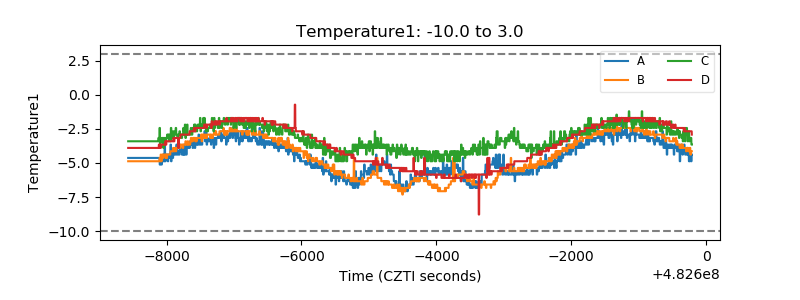 |
| Veto HV Monitor | 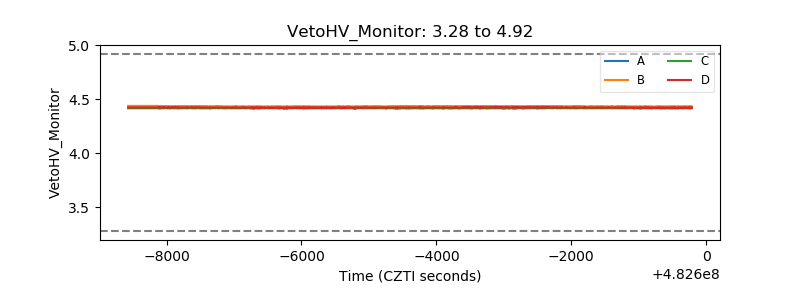 |
| Veto LLD | 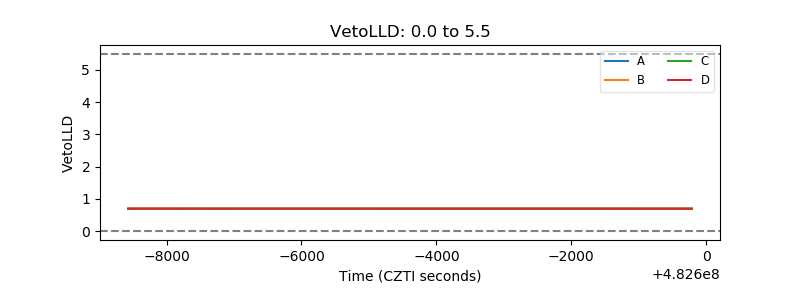 |
| Alpha Counter | 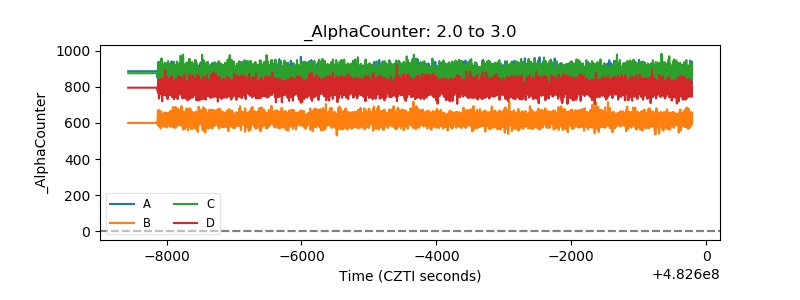 |
| _CPM_Rate | 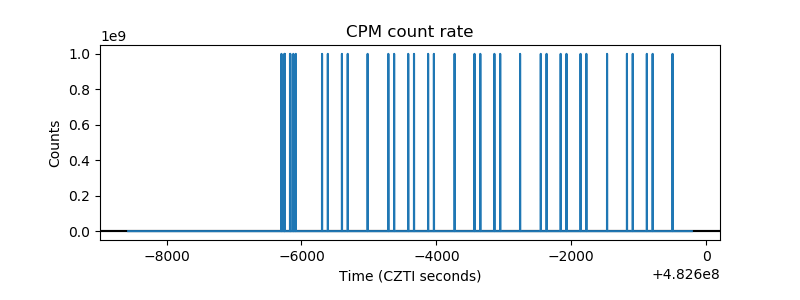 |
| CZT Counter | 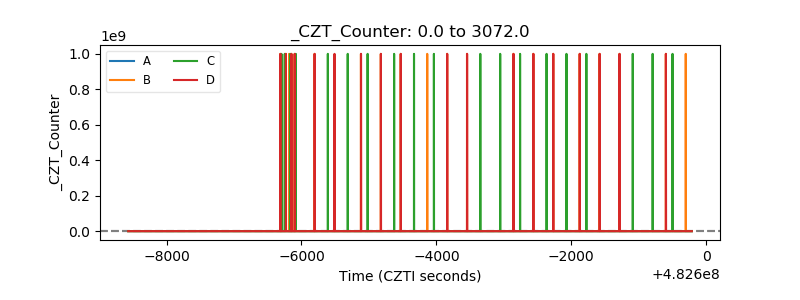 |
| +2.5 Volts monitor | 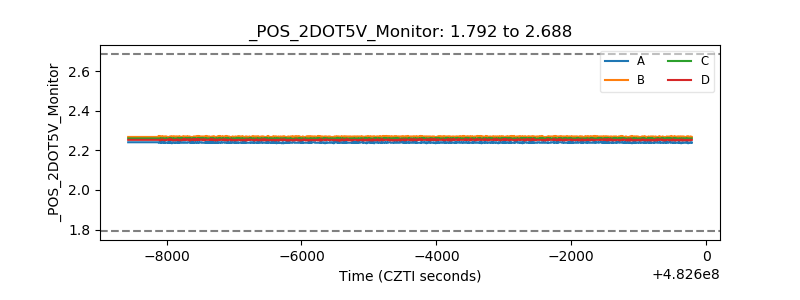 |
| +5 Volts monitor | 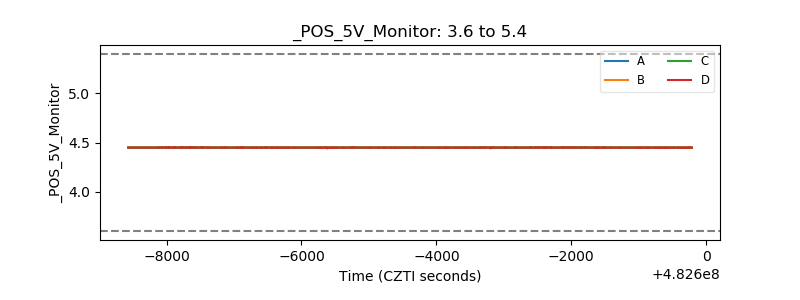 |
| _ROLL_ROT | 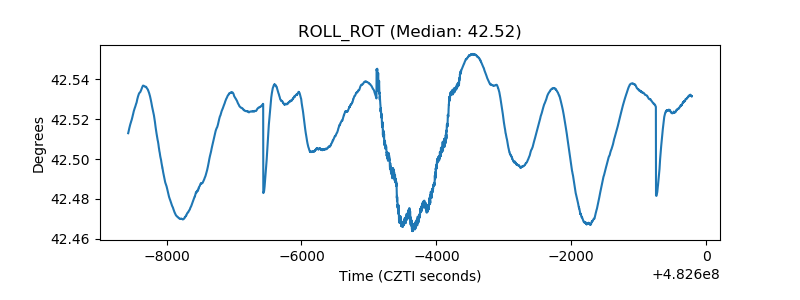 |
| _Roll_DEC | 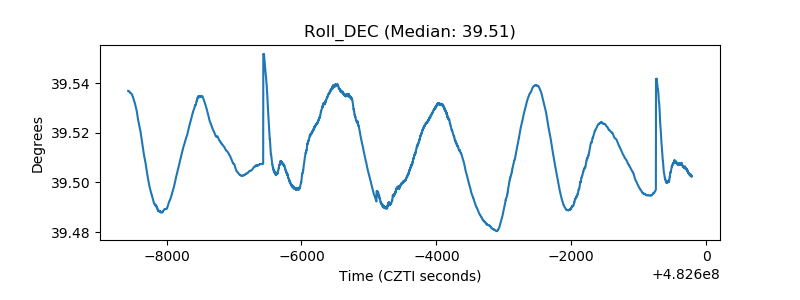 |
| _Roll_RA | 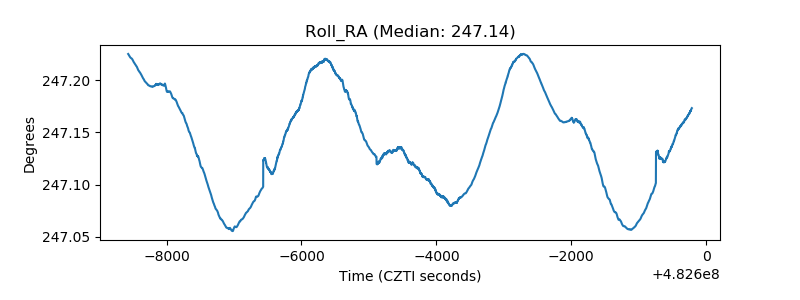 |
| Veto Counter | 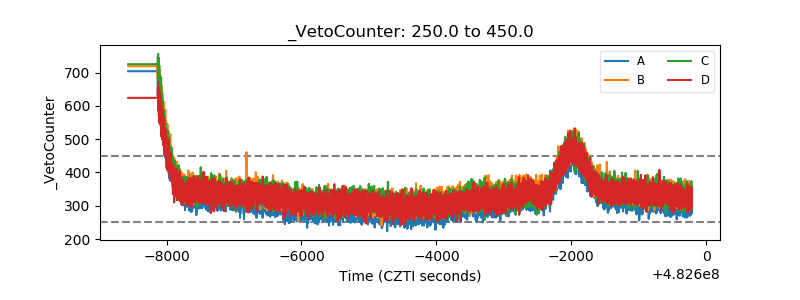 |