| Param | Original file | Final file |
|---|---|---|
| Filename | modeM0/AS1A13_031T01_9000006462_51674cztM0_level2.fits | modeM0/AS1A13_031T01_9000006462_51674cztM0_level2_quad_clean.evt |
| Size (bytes) | 733,936,320 | 113,330,880 |
| Size | 699.9 MB | 108.1 MB |
| Events in quadrant A | 10,039,973 | 596,759 |
| Events in quadrant B | 4,935,616 | 850,269 |
| Events in quadrant C | 7,216,857 | 681,599 |
| Events in quadrant D | 4,317,990 | 714,171 |
| Mode M0 | |||
|---|---|---|---|
| Quadrant | BADHDUFLAG | Total packets | Discarded packets |
| A | 0 | 35638 | 6 |
| B | 0 | 20492 | 0 |
| C | 0 | 27370 | 0 |
| D | 0 | 19074 | 0 |
| Mode SS | |||
|---|---|---|---|
| Quadrant | BADHDUFLAG | Total packets | Discarded packets |
| A | 0 | 170 | 0 |
| B | 0 | 170 | 0 |
| C | 0 | 170 | 0 |
| D | 0 | 170 | 0 |
| Quadrant | Total seconds | Saturated seconds | Saturation percentage |
|---|---|---|---|
| A | 8472 | 2329 | 27.490557% |
| B | 8473 | 239 | 2.820725% |
| C | 8473 | 1135 | 13.395492% |
| D | 8473 | 97 | 1.144813% |
Noise dominated data is calculated using 1-second bins in cleaned event files. If a bin has >2000 counts, and if more than 50% of those come from <1% of pixels, then it is considered to be noise-dominated and hence unusable.
| Quadrant | # 1 sec bins | Bins with >0 counts | Bins with >2000 counts | High rate bins dominated by noise | Noise dominated (total time) | Noise dominated (detector-on time) | Marked lightcurve |
|---|---|---|---|---|---|---|---|
| A | 8472 | 8472 | 1977 | 1977 | 23.34% | 23.34% | 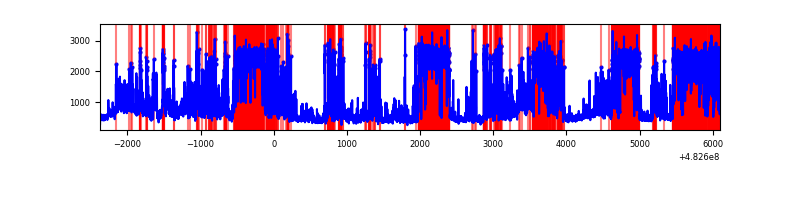 |
| B | 8473 | 8473 | 112 | 112 | 1.32% | 1.32% | 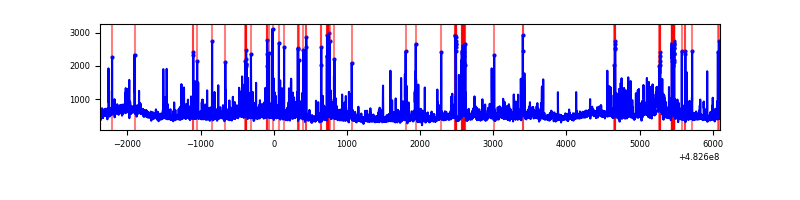 |
| C | 8473 | 8473 | 914 | 914 | 10.79% | 10.79% | 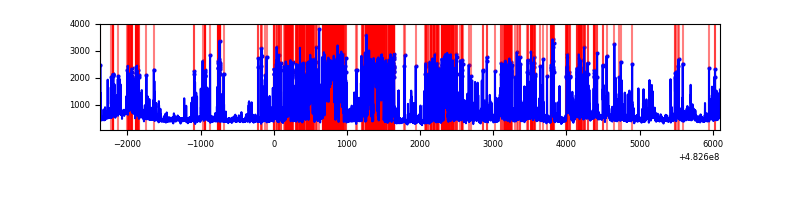 |
| D | 8473 | 8473 | 79 | 79 | 0.93% | 0.93% | 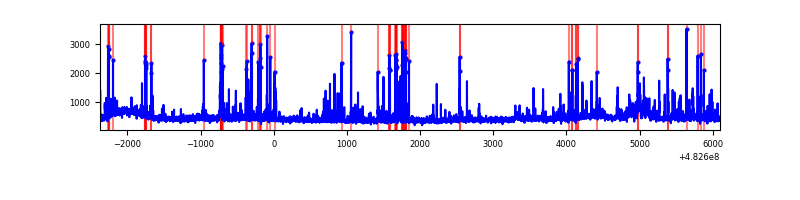 |
Top three noisy pixels from each quadrant. If the there are fewer than three noisy pixels in the level2.evt file, extra rows are filled as -1
| Pixel properties | Quadrant properties | ||||||
|---|---|---|---|---|---|---|---|
| Quadrant | DetID | PixID | Counts | Sigma | Mean | Median | Sigma |
| A | 7 | 64 | 5698757 | 29325.24 | 792 | 772 | 194.3 |
| A | 12 | 250 | 343566 | 1764.22 | 792 | 772 | 194.3 |
| A | 12 | 3 | 210514 | 1079.46 | 792 | 772 | 194.3 |
| B | 10 | 128 | 388587 | 1985.34 | 913 | 876 | 195.3 |
| B | 5 | 172 | 156493 | 796.87 | 913 | 876 | 195.3 |
| B | 1 | 207 | 121364 | 616.98 | 913 | 876 | 195.3 |
| C | 15 | 189 | 2669113 | 11631.56 | 851 | 843 | 229.4 |
| C | 15 | 231 | 391198 | 1701.64 | 851 | 843 | 229.4 |
| C | 13 | 3 | 186340 | 808.62 | 851 | 843 | 229.4 |
| D | 2 | 249 | 171358 | 696.02 | 895 | 863 | 245.0 |
| D | 7 | 126 | 123281 | 499.75 | 895 | 863 | 245.0 |
| D | 1 | 3 | 96756 | 391.47 | 895 | 863 | 245.0 |
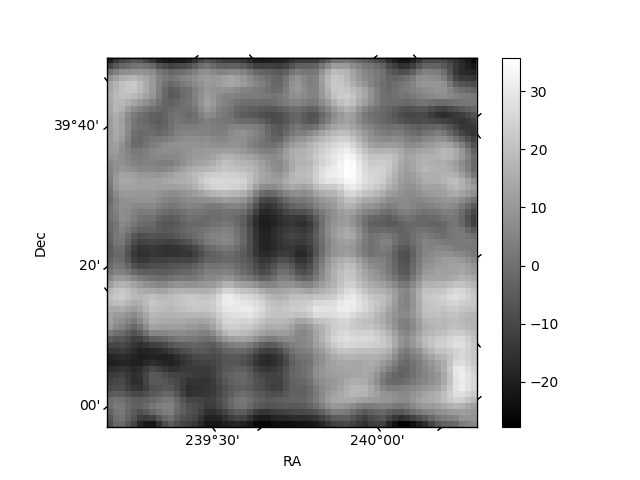
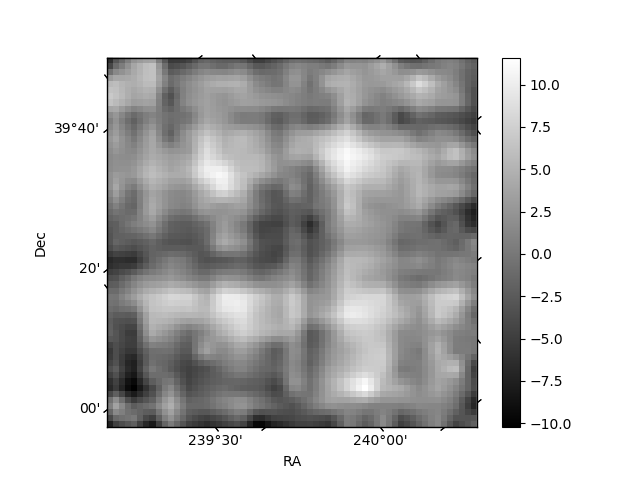
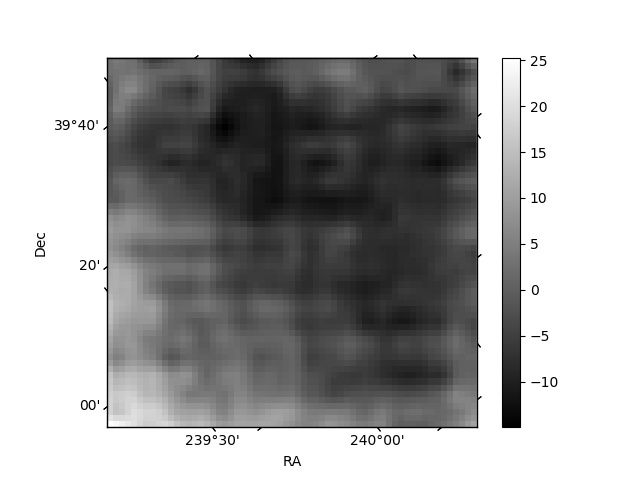
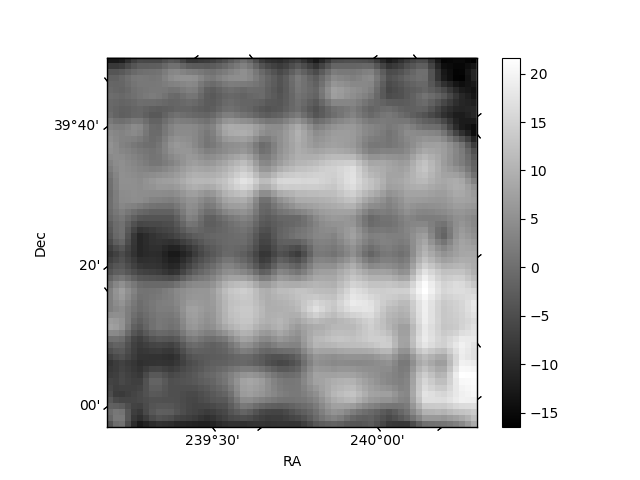
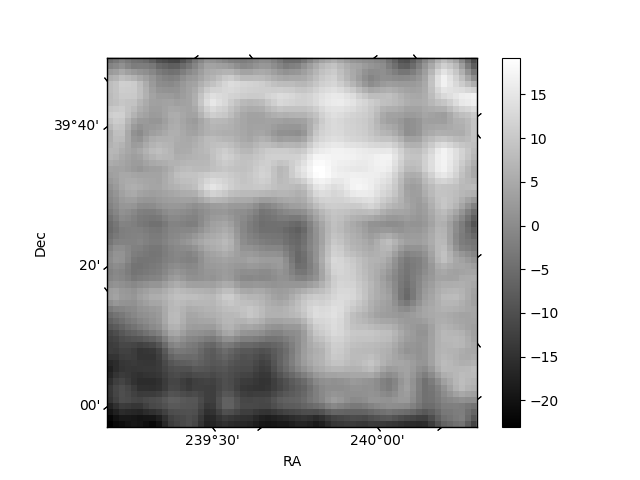
Histogram calculated using DETX and DETY for each event in the final _common_clean file
| Quadrant A | 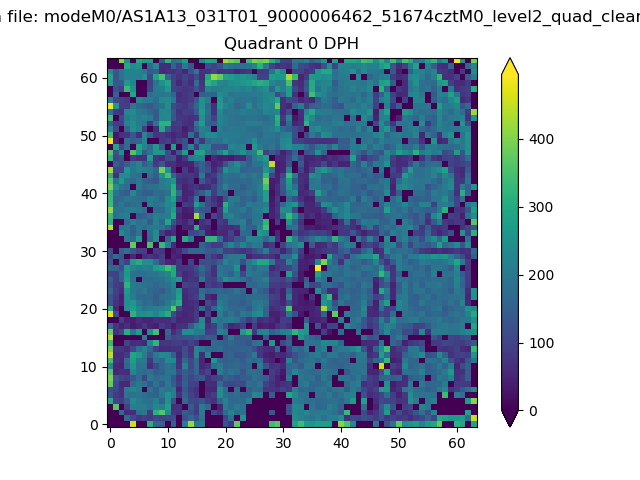 |
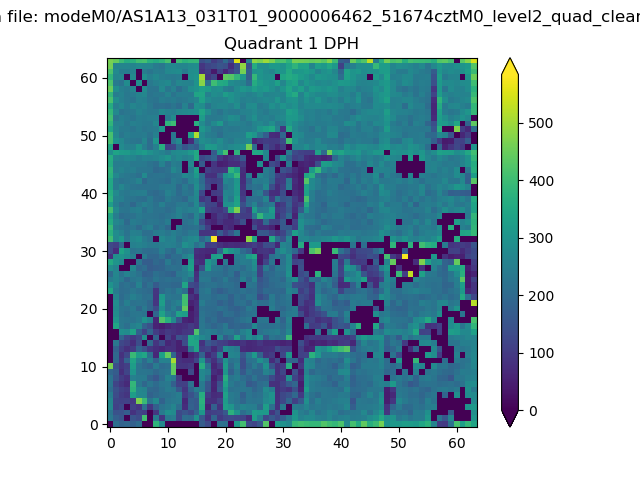 |
Quadrant B |
|---|---|---|---|
| Quadrant D | 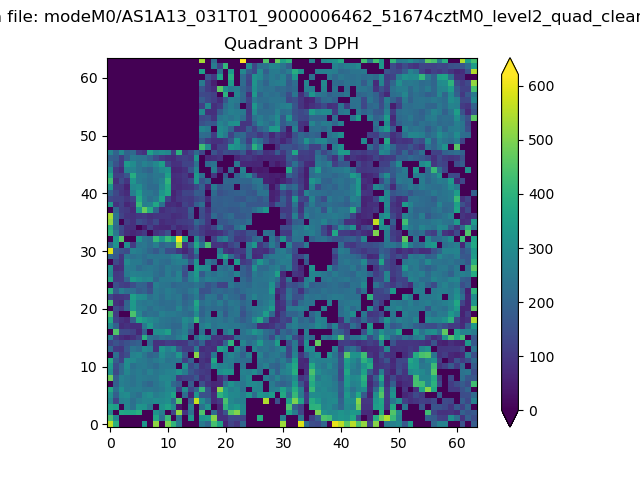 |
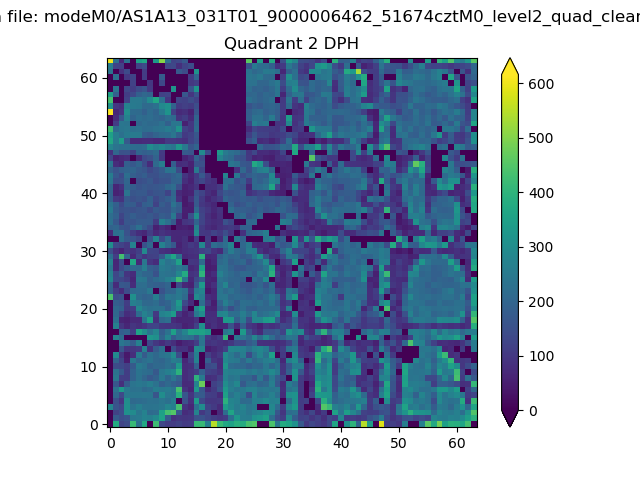 |
Quadrant C |
| Plot type | Count rate plots | Images |
|---|---|---|
| Comparison with Poisson distribution Blue bars denote a histogram of data divided into 1 sec bins. Red curve is a Poisson curve with rate = median count rate of data. |
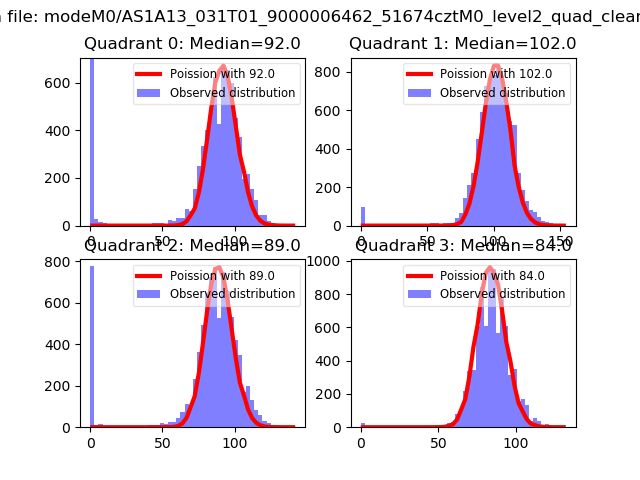 |
 |
| Quadrant-wise count rates Data is divided into 100 sec bins |
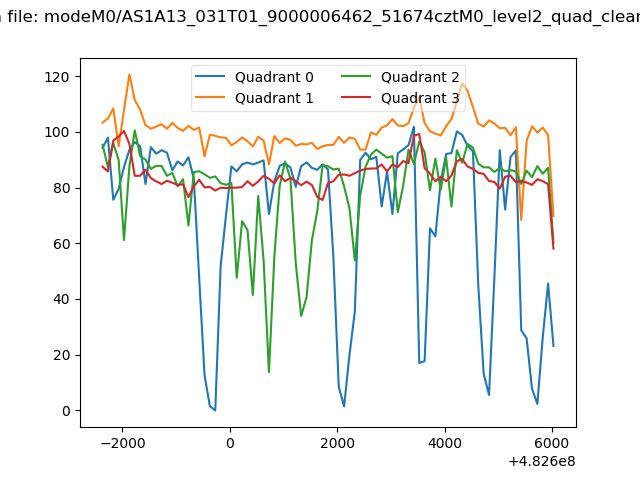 |
|
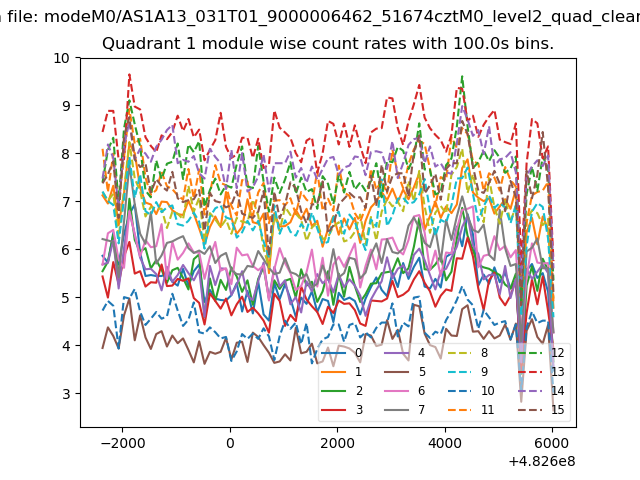
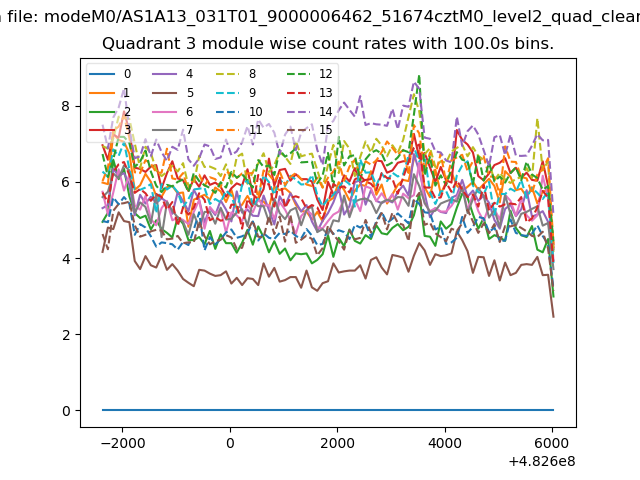
| Module-wise count rates for Quadrant A Data is divided into 100 sec bins |
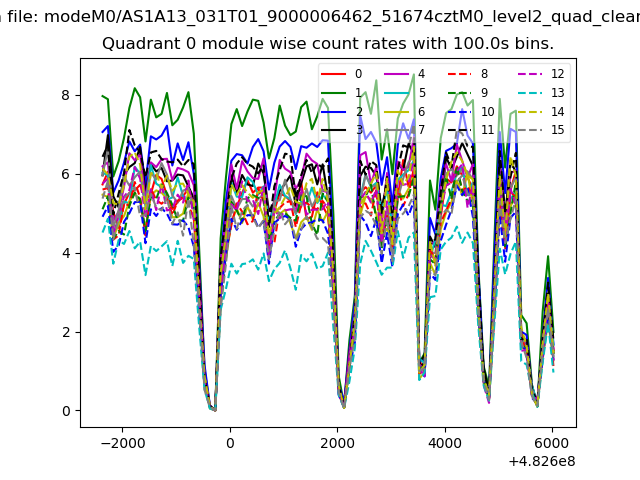 |
 |
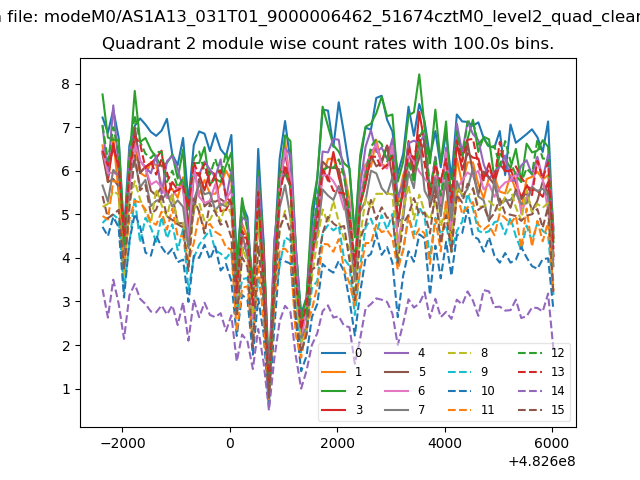
| Module-wise count rates for Quadrant B Data is divided into 100 sec bins |
 |
 |
| Module-wise count rates for Quadrant C Data is divided into 100 sec bins |
 |
 |
| Module-wise count rates for Quadrant D Data is divided into 100 sec bins |
 |
 |
| Parameter | Plot |
|---|---|
| CZT HV Monitor | 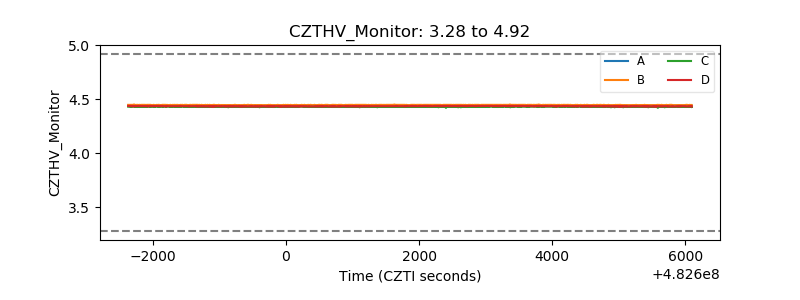 |
| D_VDD | 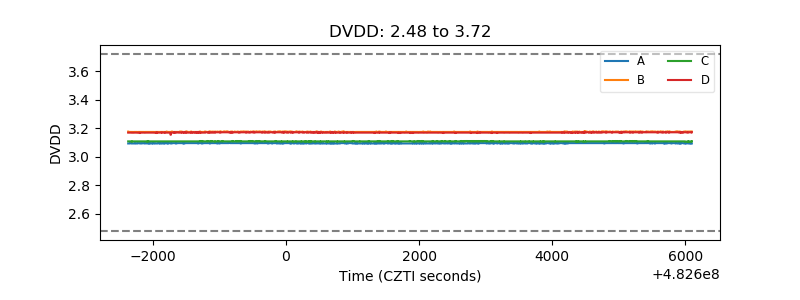 |
| Temperature 1 | 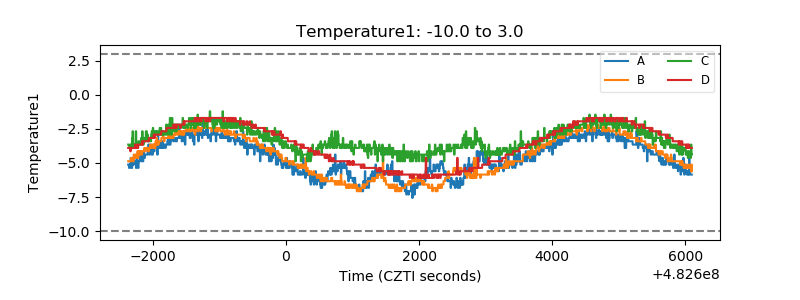 |
| Veto HV Monitor | 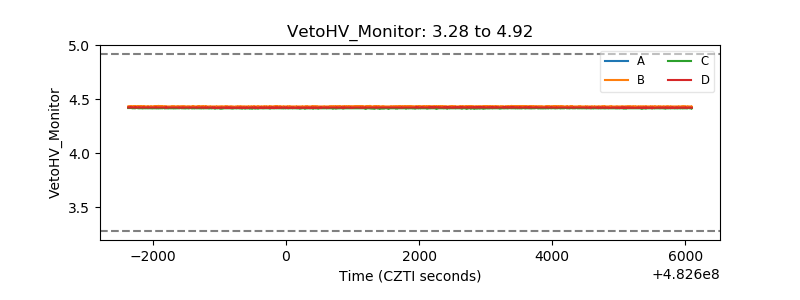 |
| Veto LLD | 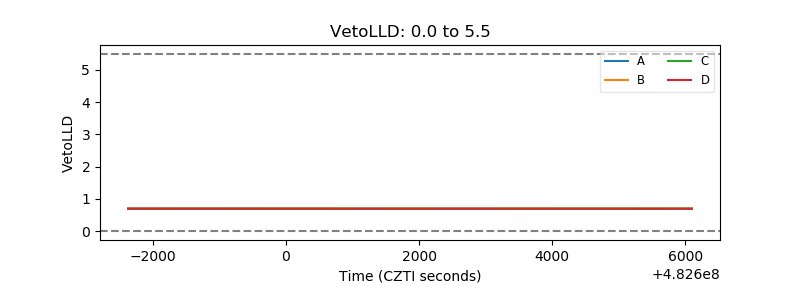 |
| Alpha Counter | 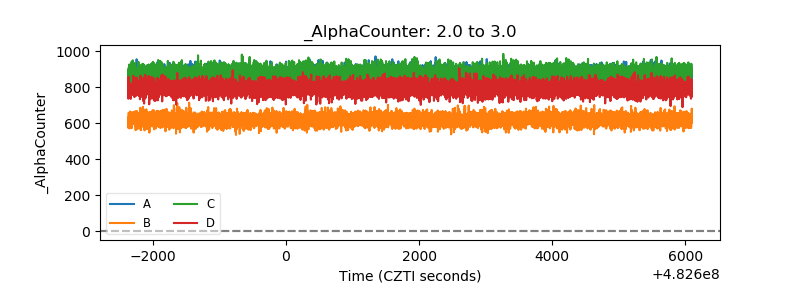 |
| _CPM_Rate | 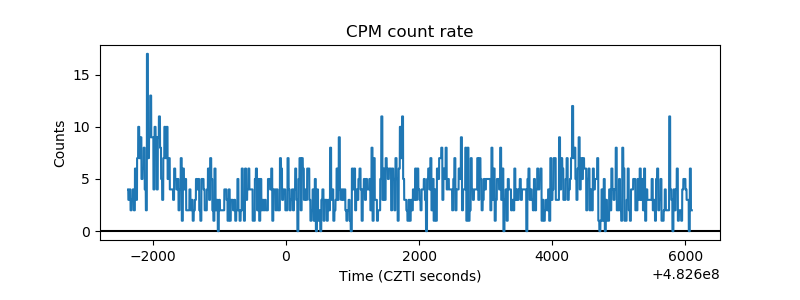 |
| CZT Counter | 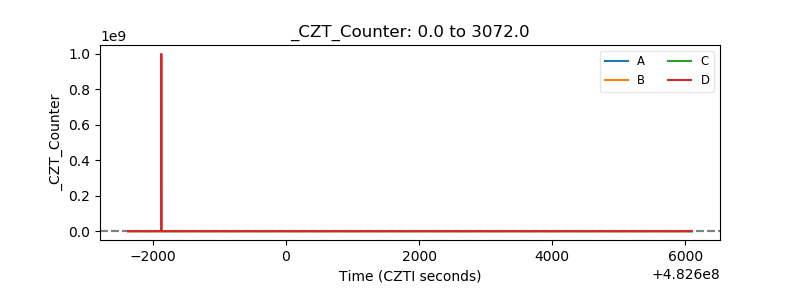 |
| +2.5 Volts monitor | 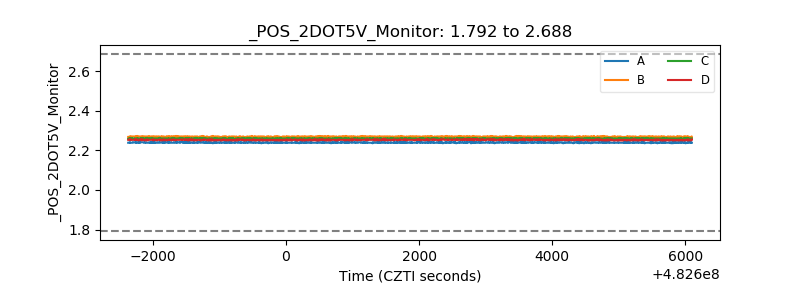 |
| +5 Volts monitor | 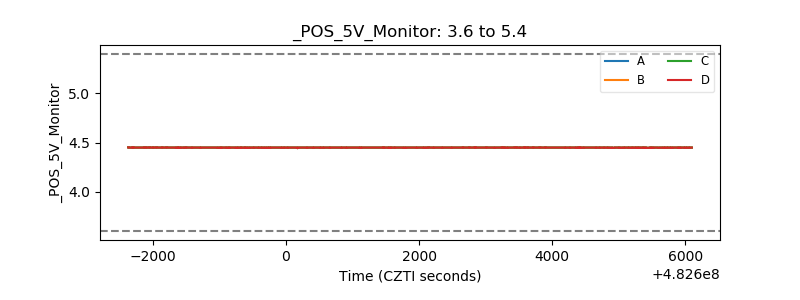 |
| _ROLL_ROT | 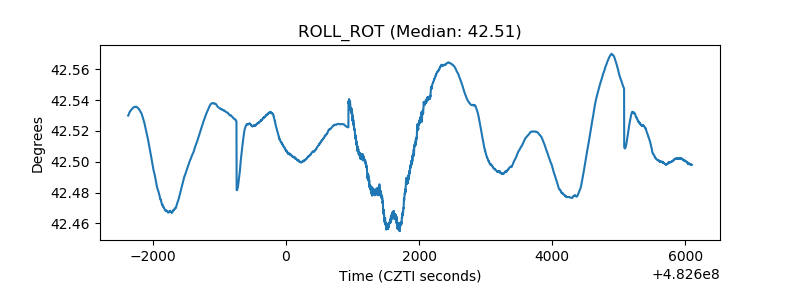 |
| _Roll_DEC | 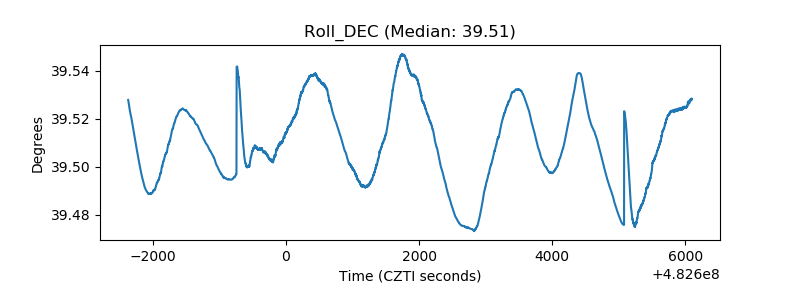 |
| _Roll_RA | 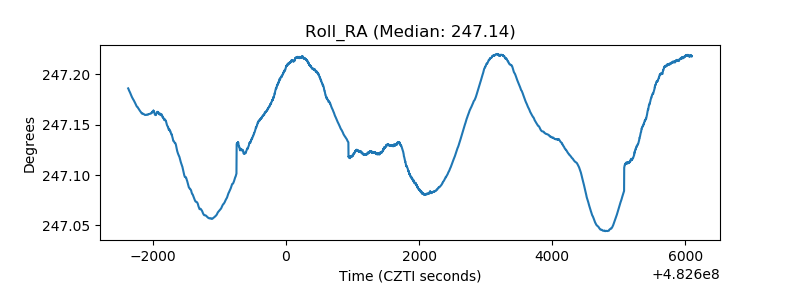 |
| Veto Counter | 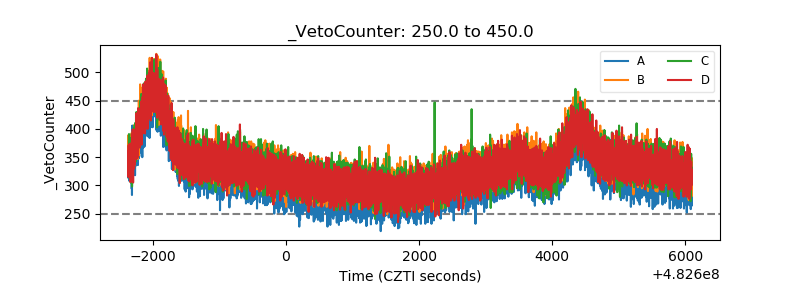 |