| Param | Original file | Final file |
|---|---|---|
| Filename | modeM0/AS1A13_031T01_9000006462_51675cztM0_level2.fits | modeM0/AS1A13_031T01_9000006462_51675cztM0_level2_quad_clean.evt |
| Size (bytes) | 739,270,080 | 116,616,960 |
| Size | 705.0 MB | 111.2 MB |
| Events in quadrant A | 10,411,870 | 626,835 |
| Events in quadrant B | 5,068,937 | 858,218 |
| Events in quadrant C | 6,270,661 | 739,658 |
| Events in quadrant D | 4,949,390 | 710,977 |
| Mode M0 | |||
|---|---|---|---|
| Quadrant | BADHDUFLAG | Total packets | Discarded packets |
| A | 0 | 37004 | 7 |
| B | 0 | 21016 | 0 |
| C | 0 | 24648 | 0 |
| D | 0 | 20819 | 1 |
| Mode SS | |||
|---|---|---|---|
| Quadrant | BADHDUFLAG | Total packets | Discarded packets |
| A | 0 | 170 | 0 |
| B | 0 | 170 | 0 |
| C | 0 | 170 | 0 |
| D | 0 | 170 | 0 |
| Quadrant | Total seconds | Saturated seconds | Saturation percentage |
|---|---|---|---|
| A | 8575 | 2118 | 24.699708% |
| B | 8576 | 189 | 2.203825% |
| C | 8577 | 514 | 5.992771% |
| D | 8576 | 221 | 2.576959% |
Noise dominated data is calculated using 1-second bins in cleaned event files. If a bin has >2000 counts, and if more than 50% of those come from <1% of pixels, then it is considered to be noise-dominated and hence unusable.
| Quadrant | # 1 sec bins | Bins with >0 counts | Bins with >2000 counts | High rate bins dominated by noise | Noise dominated (total time) | Noise dominated (detector-on time) | Marked lightcurve |
|---|---|---|---|---|---|---|---|
| A | 8576 | 8575 | 1866 | 1866 | 21.76% | 21.76% | 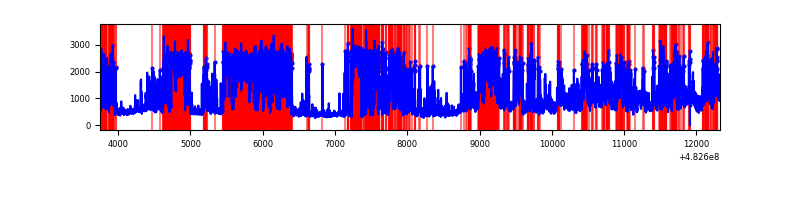 |
| B | 8576 | 8576 | 136 | 136 | 1.59% | 1.59% | 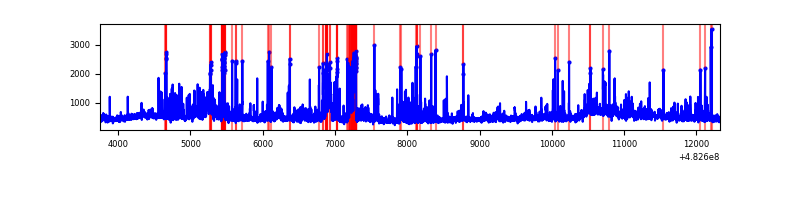 |
| C | 8577 | 8577 | 469 | 469 | 5.47% | 5.47% | 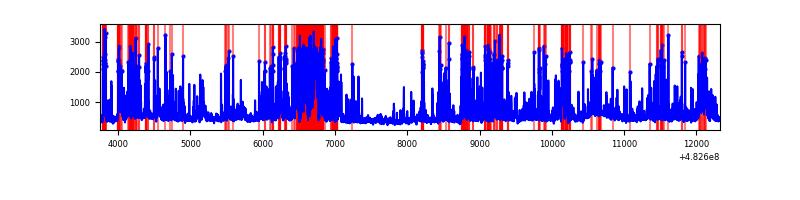 |
| D | 8576 | 8576 | 203 | 203 | 2.37% | 2.37% | 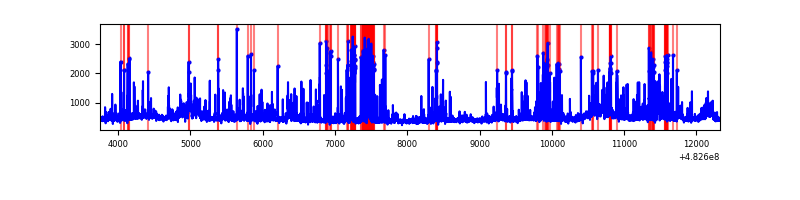 |
Top three noisy pixels from each quadrant. If the there are fewer than three noisy pixels in the level2.evt file, extra rows are filled as -1
| Pixel properties | Quadrant properties | ||||||
|---|---|---|---|---|---|---|---|
| Quadrant | DetID | PixID | Counts | Sigma | Mean | Median | Sigma |
| A | 7 | 64 | 5362772 | 26755.83 | 818 | 799 | 200.4 |
| A | 12 | 250 | 641619 | 3197.64 | 818 | 799 | 200.4 |
| A | 12 | 3 | 513266 | 2557.17 | 818 | 799 | 200.4 |
| B | 5 | 172 | 593897 | 3034.9 | 911 | 878 | 195.4 |
| B | 1 | 207 | 131343 | 667.68 | 911 | 878 | 195.4 |
| B | 6 | 51 | 80653 | 408.27 | 911 | 878 | 195.4 |
| C | 15 | 231 | 701981 | 2887.9 | 886 | 877 | 242.8 |
| C | 13 | 3 | 593082 | 2439.33 | 886 | 877 | 242.8 |
| C | 15 | 189 | 548081 | 2253.97 | 886 | 877 | 242.8 |
| D | 7 | 126 | 491505 | 2008.74 | 884 | 853 | 244.3 |
| D | 7 | 159 | 174842 | 712.32 | 884 | 853 | 244.3 |
| D | 2 | 249 | 121272 | 493.0 | 884 | 853 | 244.3 |
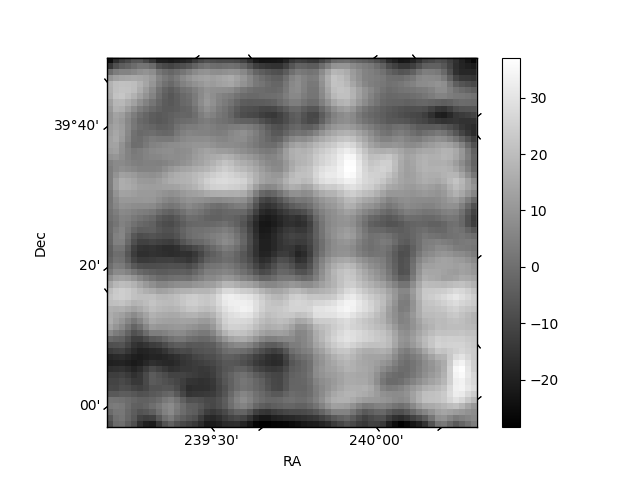
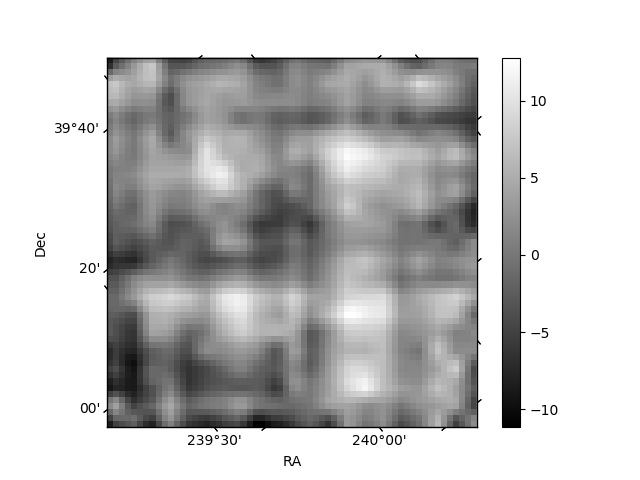
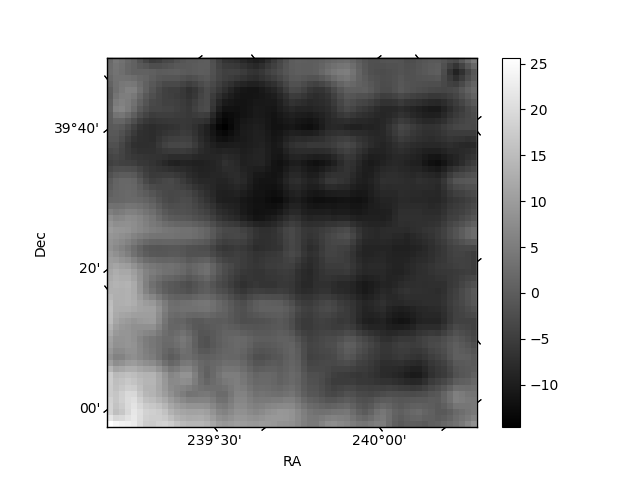
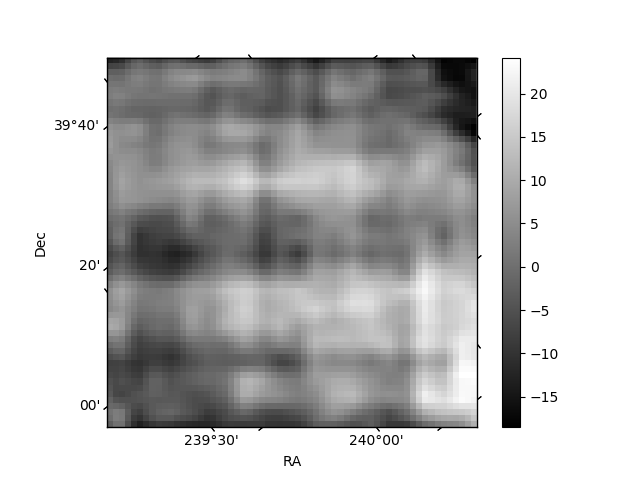
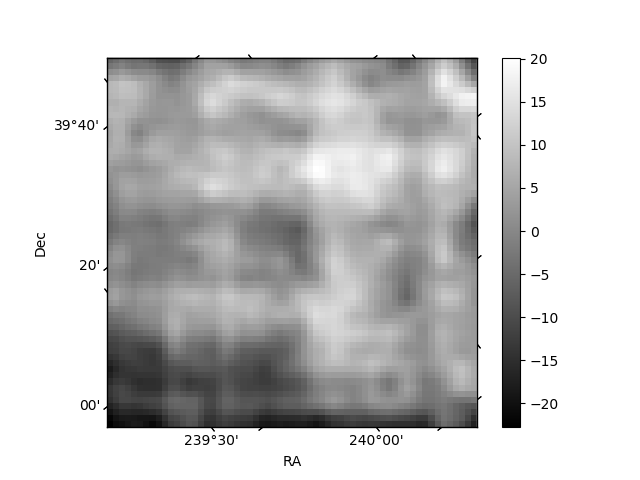
Histogram calculated using DETX and DETY for each event in the final _common_clean file
| Quadrant A | 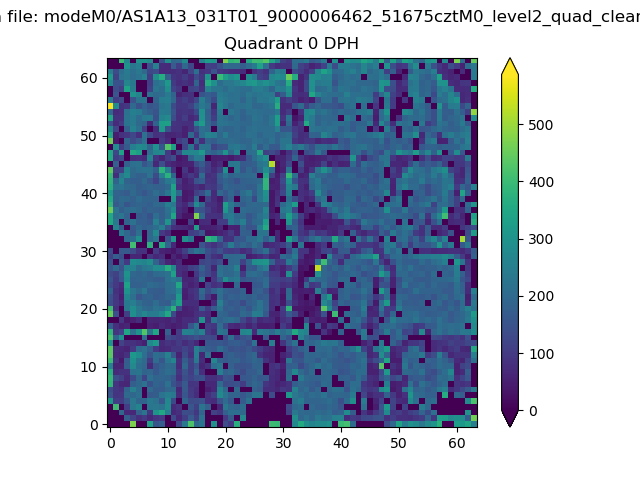 |
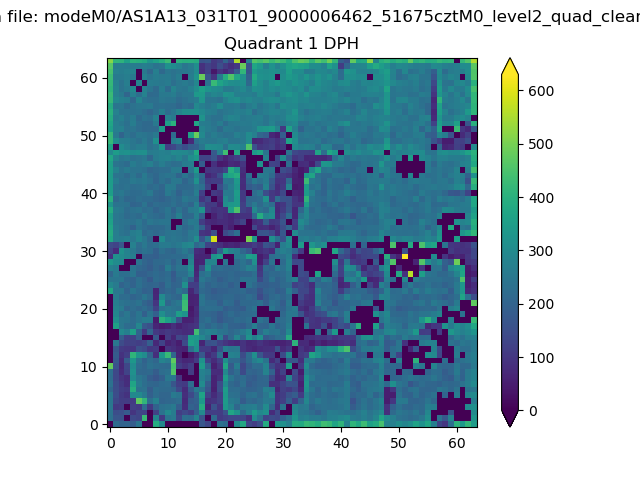 |
Quadrant B |
|---|---|---|---|
| Quadrant D | 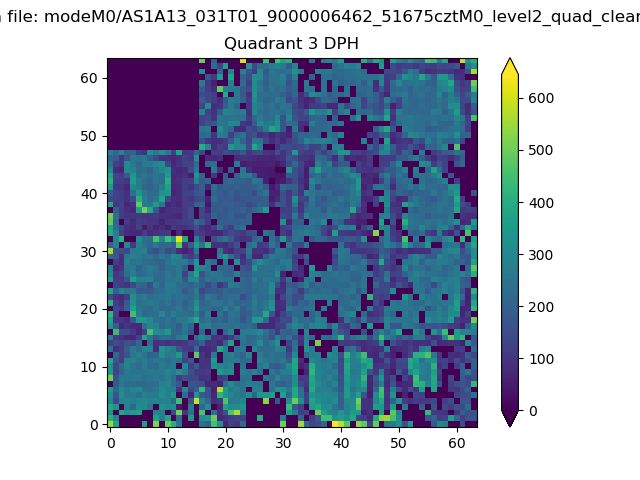 |
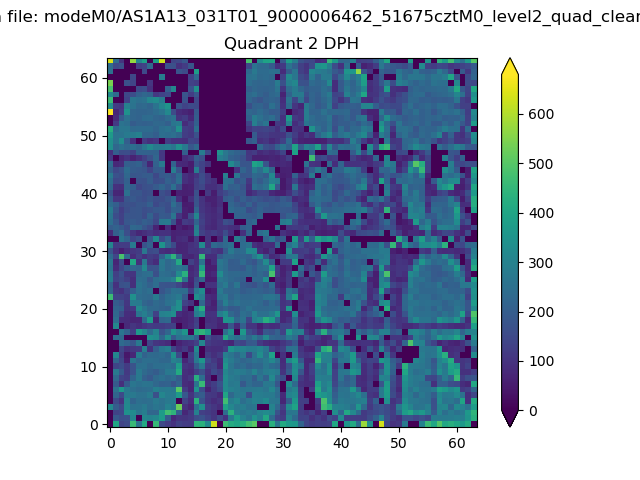 |
Quadrant C |
| Plot type | Count rate plots | Images |
|---|---|---|
| Comparison with Poisson distribution Blue bars denote a histogram of data divided into 1 sec bins. Red curve is a Poisson curve with rate = median count rate of data. |
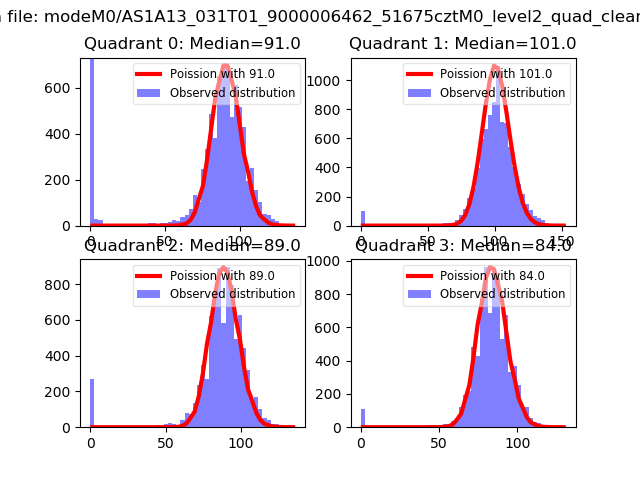 |
 |
| Quadrant-wise count rates Data is divided into 100 sec bins |
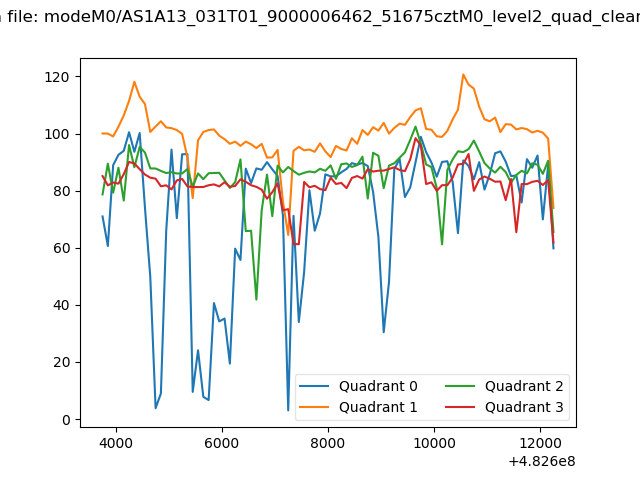 |
|
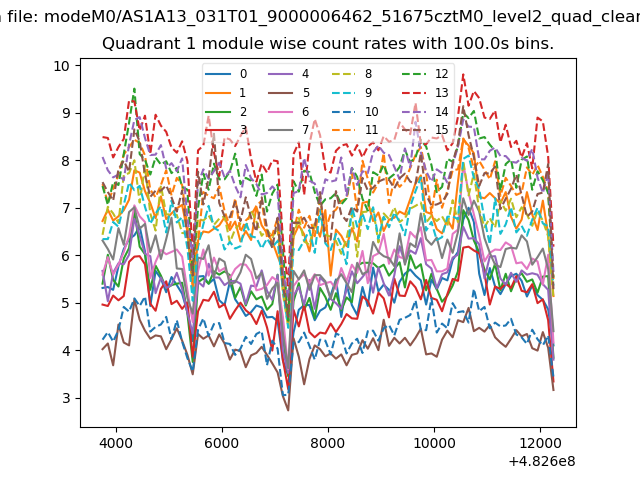
| Module-wise count rates for Quadrant A Data is divided into 100 sec bins |
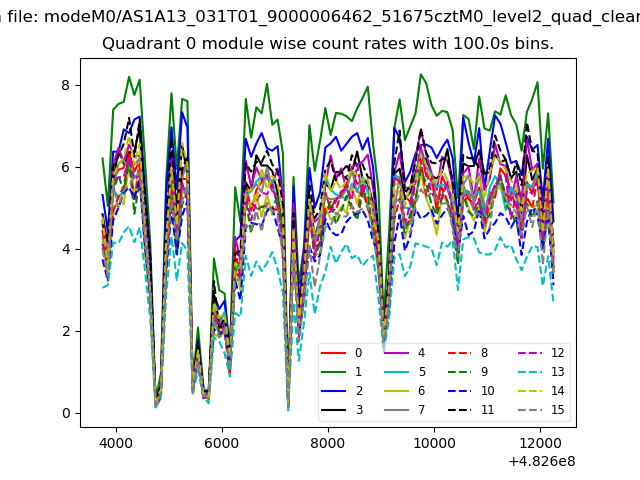 |
 |
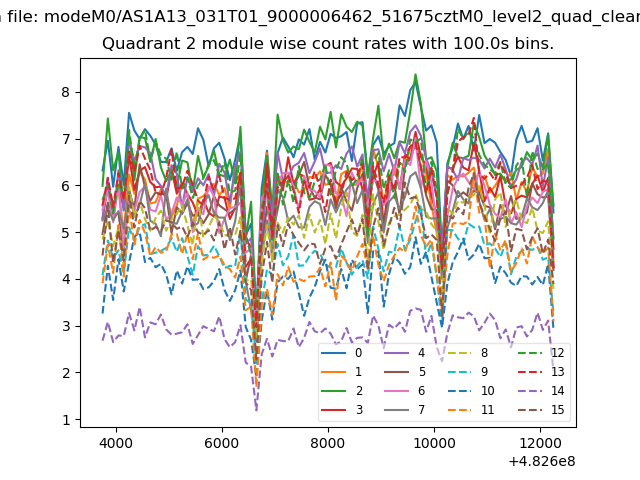
| Module-wise count rates for Quadrant B Data is divided into 100 sec bins |
 |
 |
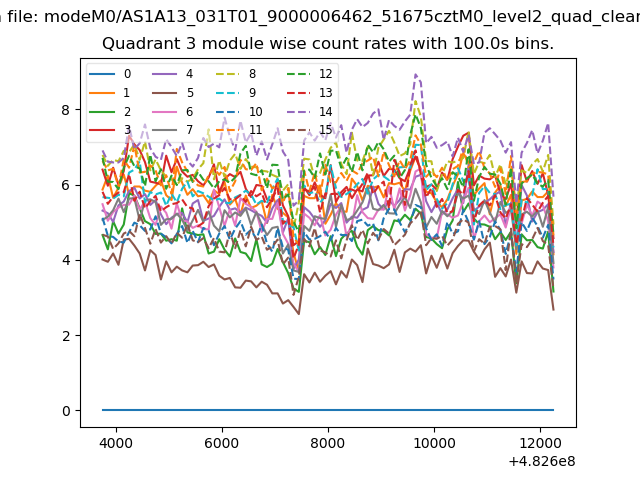
| Module-wise count rates for Quadrant C Data is divided into 100 sec bins |
 |
 |
| Module-wise count rates for Quadrant D Data is divided into 100 sec bins |
 |
 |
| Parameter | Plot |
|---|---|
| CZT HV Monitor |  |
| D_VDD | 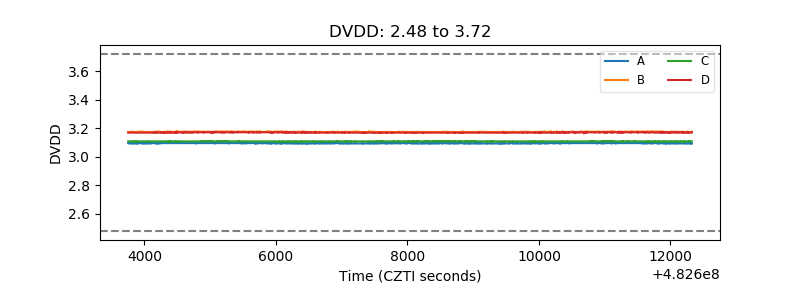 |
| Temperature 1 | 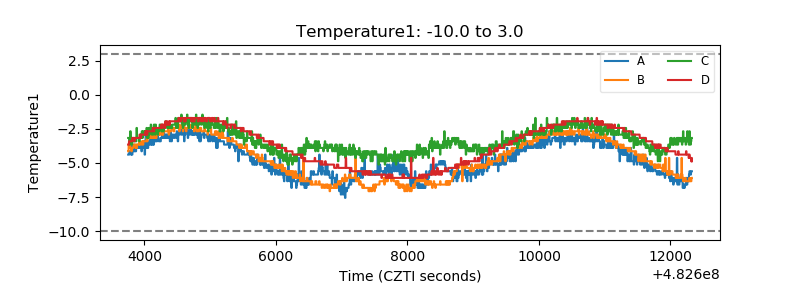 |
| Veto HV Monitor | 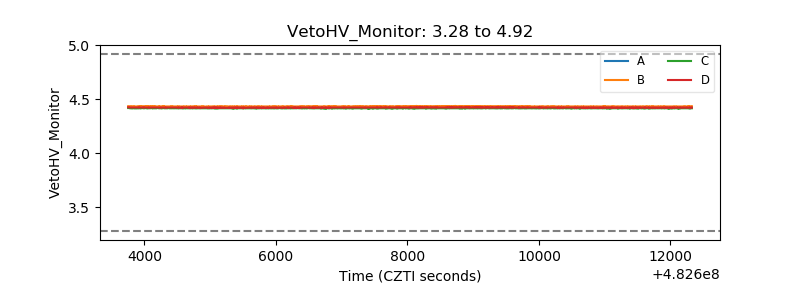 |
| Veto LLD | 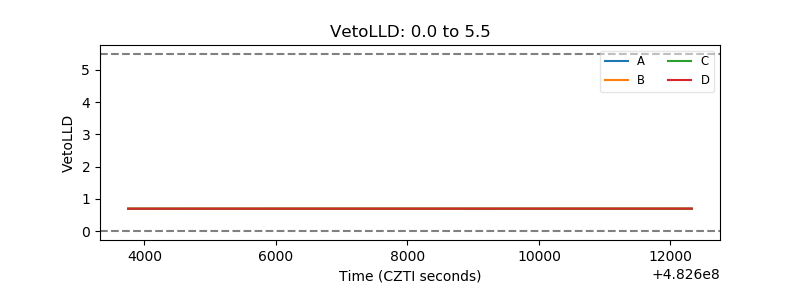 |
| Alpha Counter | 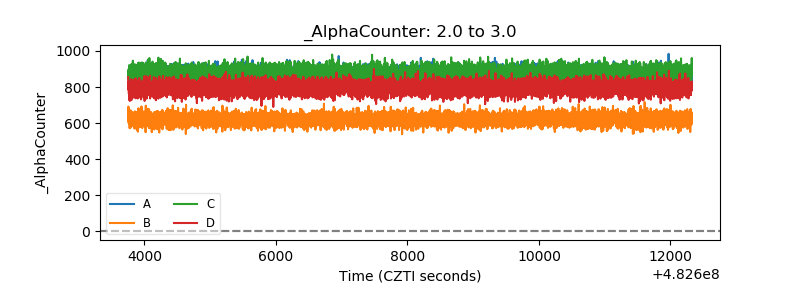 |
| _CPM_Rate | 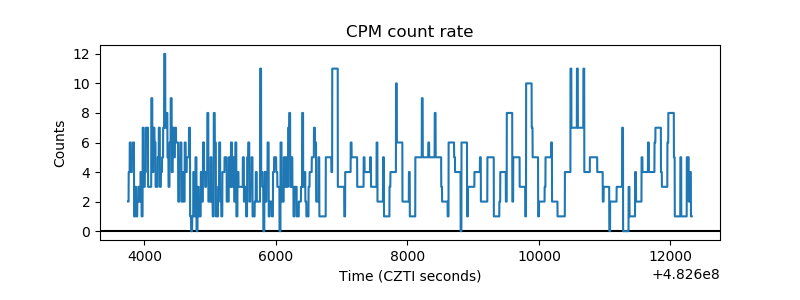 |
| CZT Counter | 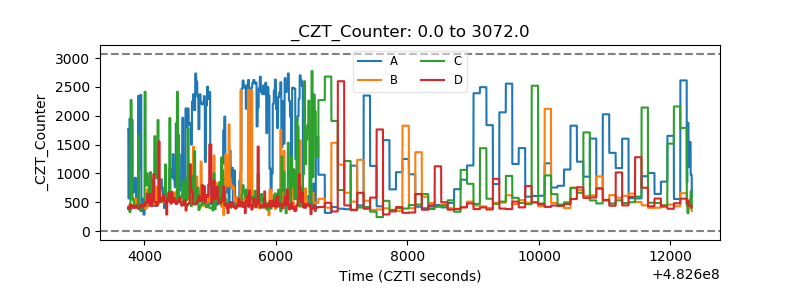 |
| +2.5 Volts monitor | 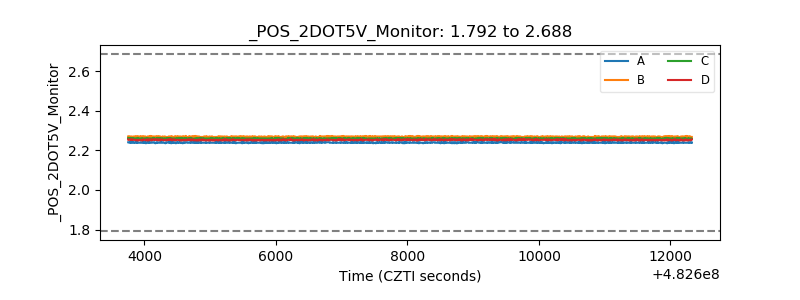 |
| +5 Volts monitor | 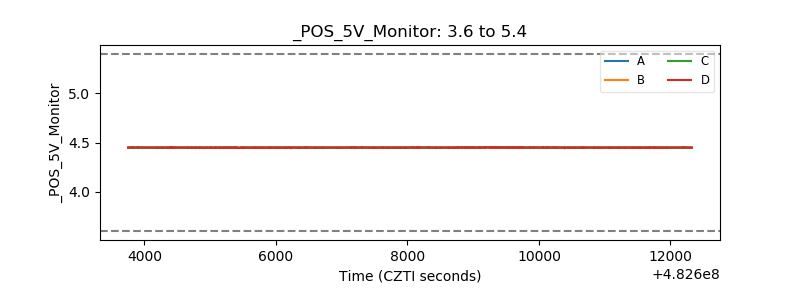 |
| _ROLL_ROT | 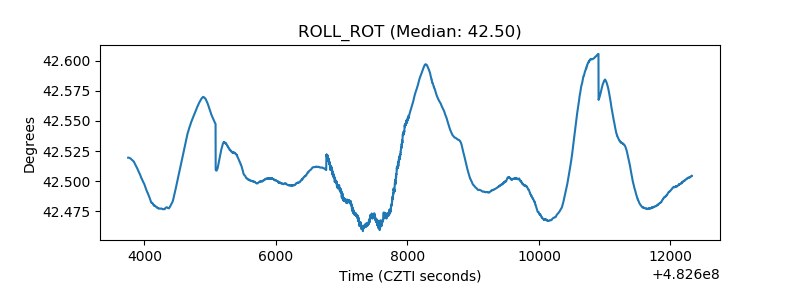 |
| _Roll_DEC | 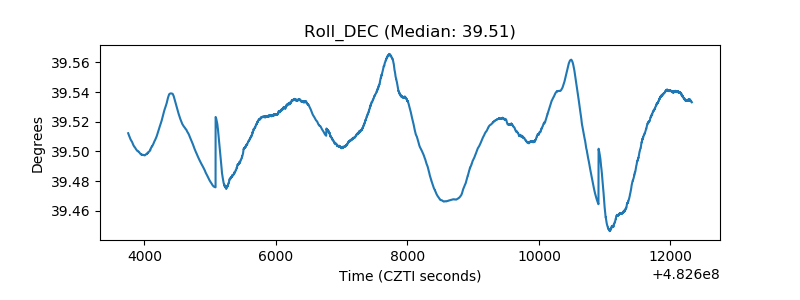 |
| _Roll_RA | 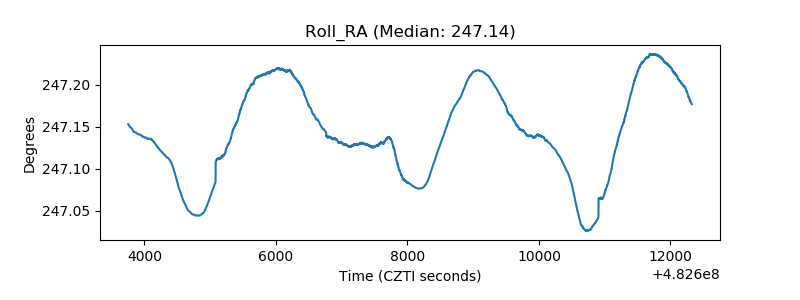 |
| Veto Counter | 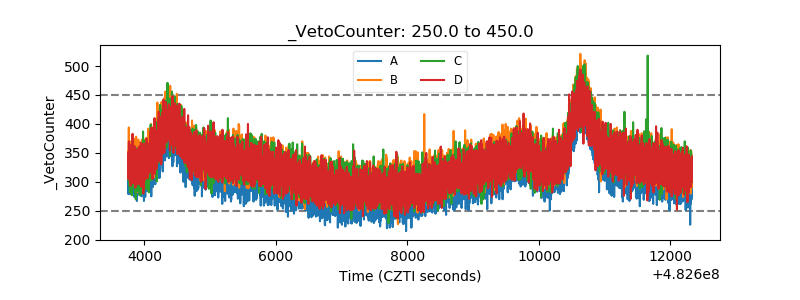 |