| Param | Original file | Final file |
|---|---|---|
| Filename | modeM0/AS1A13_031T01_9000006462_51678cztM0_level2.fits | modeM0/AS1A13_031T01_9000006462_51678cztM0_level2_quad_clean.evt |
| Size (bytes) | 1,522,128,960 | 274,003,200 |
| Size | 1.4 GB | 261.3 MB |
| Events in quadrant A | 16,302,800 | 1,755,359 |
| Events in quadrant B | 11,473,206 | 1,930,622 |
| Events in quadrant C | 14,978,987 | 1,633,943 |
| Events in quadrant D | 12,048,189 | 1,602,427 |
| Mode M9 | |||
|---|---|---|---|
| Quadrant | BADHDUFLAG | Total packets | Discarded packets |
| A | 0 | 12 | 0 |
| B | 0 | 12 | 0 |
| C | 0 | 12 | 0 |
| D | 0 | 12 | 0 |
| Mode M0 | |||
|---|---|---|---|
| Quadrant | BADHDUFLAG | Total packets | Discarded packets |
| A | 0 | 62448 | 3 |
| B | 0 | 48284 | 3 |
| C | 0 | 58903 | 3 |
| D | 0 | 50690 | 4 |
| Mode SS | |||
|---|---|---|---|
| Quadrant | BADHDUFLAG | Total packets | Discarded packets |
| A | 0 | 404 | 0 |
| B | 0 | 404 | 0 |
| C | 0 | 404 | 0 |
| D | 0 | 404 | 0 |
| Quadrant | Total seconds | Saturated seconds | Saturation percentage |
|---|---|---|---|
| A | 19939 | 1210 | 6.068509% |
| B | 19939 | 724 | 3.631075% |
| C | 19939 | 1781 | 8.932243% |
| D | 19938 | 934 | 4.684522% |
Noise dominated data is calculated using 1-second bins in cleaned event files. If a bin has >2000 counts, and if more than 50% of those come from <1% of pixels, then it is considered to be noise-dominated and hence unusable.
| Quadrant | # 1 sec bins | Bins with >0 counts | Bins with >2000 counts | High rate bins dominated by noise | Noise dominated (total time) | Noise dominated (detector-on time) | Marked lightcurve |
|---|---|---|---|---|---|---|---|
| A | 21084 | 19941 | 894 | 894 | 4.24% | 4.48% | 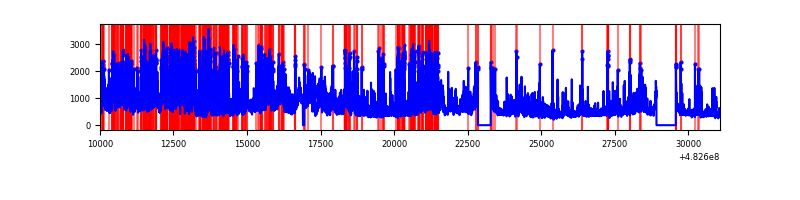 |
| B | 21084 | 19939 | 332 | 332 | 1.57% | 1.67% | 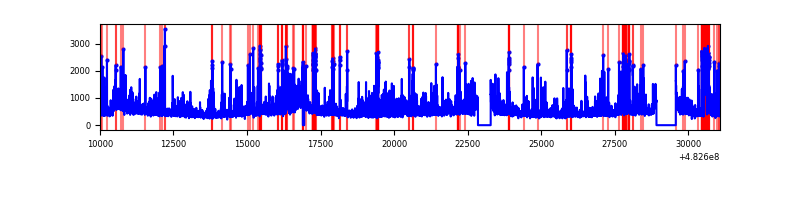 |
| C | 21084 | 19940 | 1498 | 1498 | 7.10% | 7.51% | 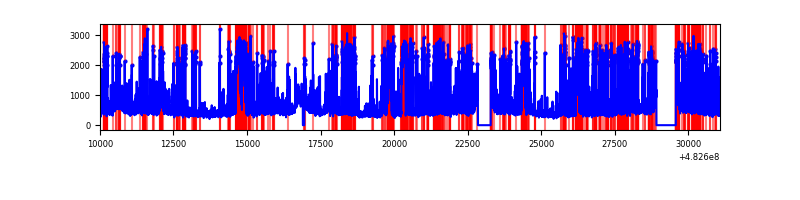 |
| D | 21083 | 19941 | 672 | 672 | 3.19% | 3.37% | 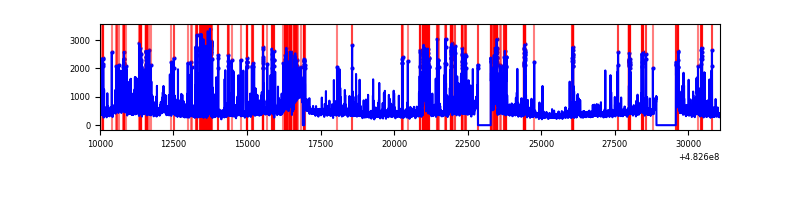 |
Top three noisy pixels from each quadrant. If the there are fewer than three noisy pixels in the level2.evt file, extra rows are filled as -1
| Pixel properties | Quadrant properties | ||||||
|---|---|---|---|---|---|---|---|
| Quadrant | DetID | PixID | Counts | Sigma | Mean | Median | Sigma |
| A | 7 | 64 | 3598330 | 7008.05 | 2087 | 2035 | 513.2 |
| A | 12 | 3 | 1828746 | 3559.69 | 2087 | 2035 | 513.2 |
| A | 12 | 250 | 558591 | 1084.55 | 2087 | 2035 | 513.2 |
| B | 6 | 51 | 659960 | 1475.3 | 2095 | 2017 | 446.0 |
| B | 1 | 207 | 359088 | 800.66 | 2095 | 2017 | 446.0 |
| B | 0 | 213 | 281632 | 626.98 | 2095 | 2017 | 446.0 |
| C | 15 | 189 | 1967760 | 3557.31 | 2017 | 2002 | 552.6 |
| C | 13 | 3 | 1365818 | 2468.01 | 2017 | 2002 | 552.6 |
| C | 15 | 147 | 1070946 | 1934.4 | 2017 | 2002 | 552.6 |
| D | 8 | 176 | 889481 | 1573.99 | 2027 | 1955 | 563.9 |
| D | 7 | 126 | 527537 | 932.1 | 2027 | 1955 | 563.9 |
| D | 7 | 60 | 489804 | 865.18 | 2027 | 1955 | 563.9 |
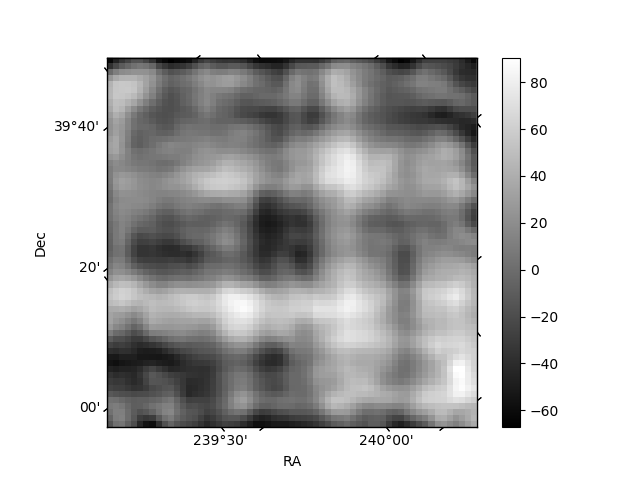
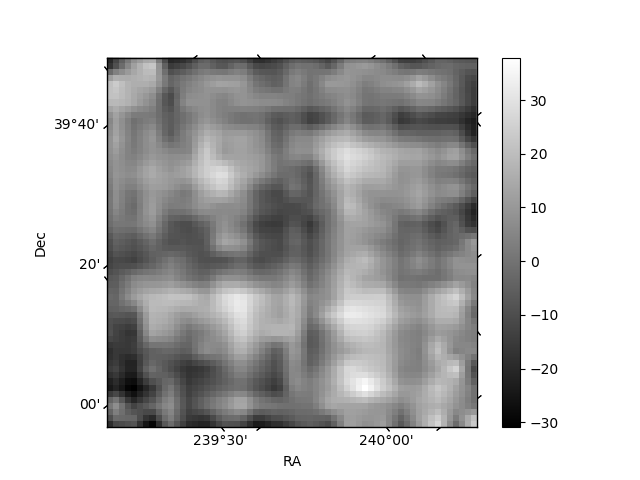
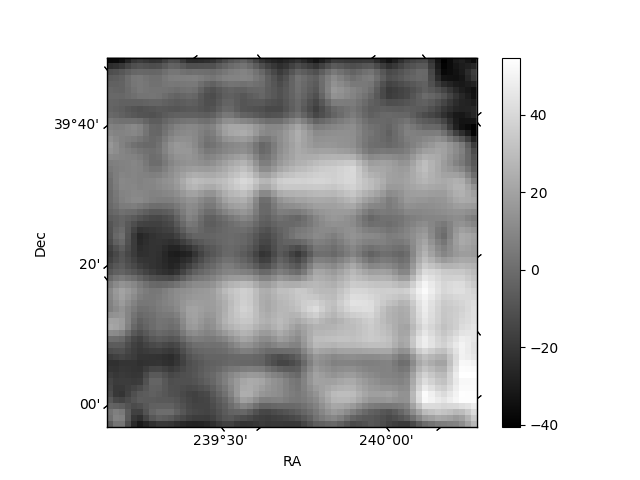
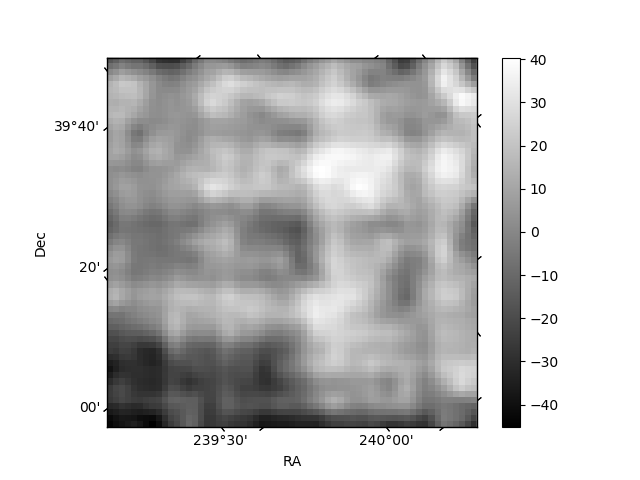
Histogram calculated using DETX and DETY for each event in the final _common_clean file
| Quadrant A | 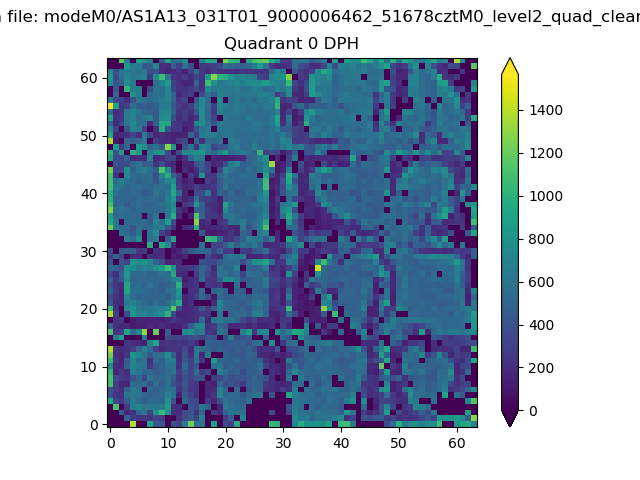 |
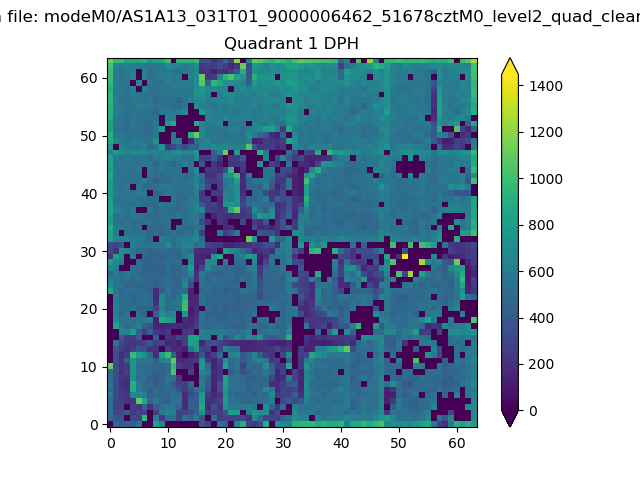 |
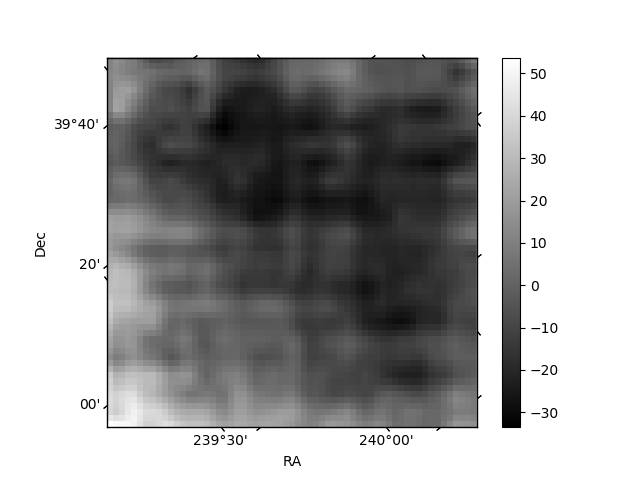
Quadrant B |
|---|---|---|---|
| Quadrant D | 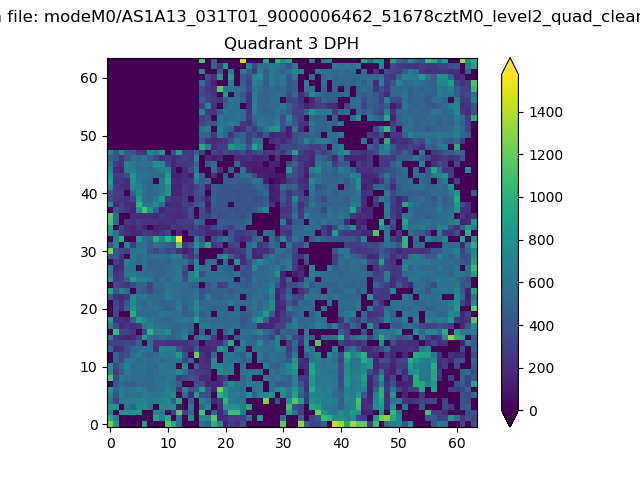 |
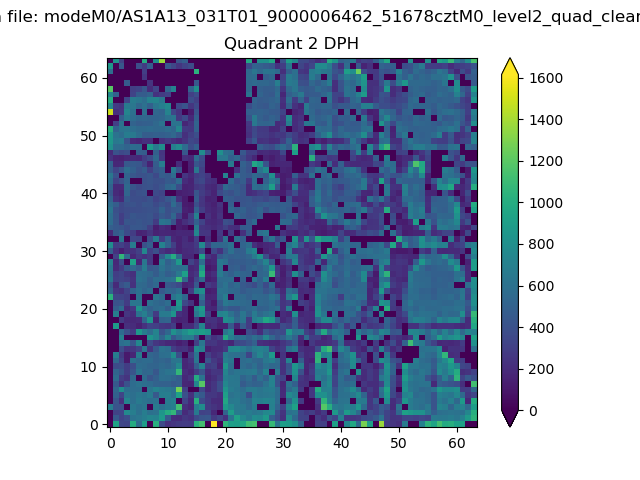 |
Quadrant C |
| Plot type | Count rate plots | Images |
|---|---|---|
| Comparison with Poisson distribution Blue bars denote a histogram of data divided into 1 sec bins. Red curve is a Poisson curve with rate = median count rate of data. |
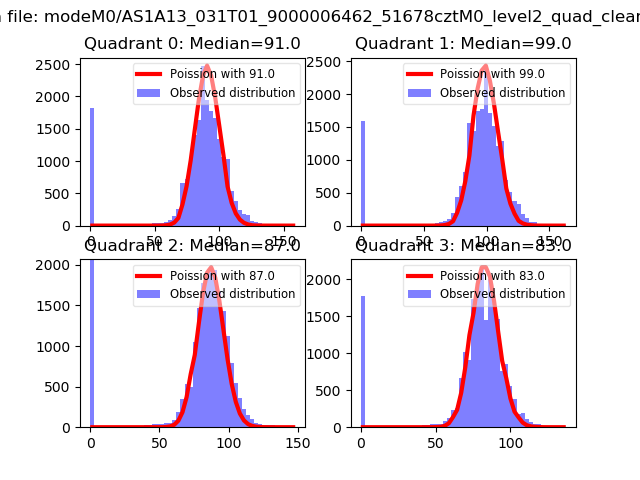 |
 |
| Quadrant-wise count rates Data is divided into 100 sec bins |
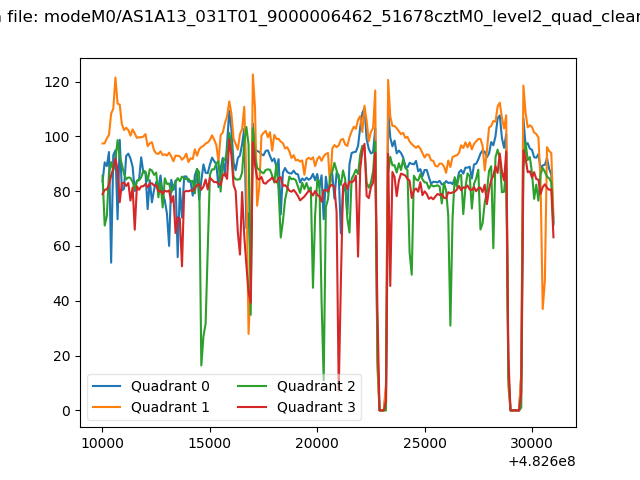 |
|
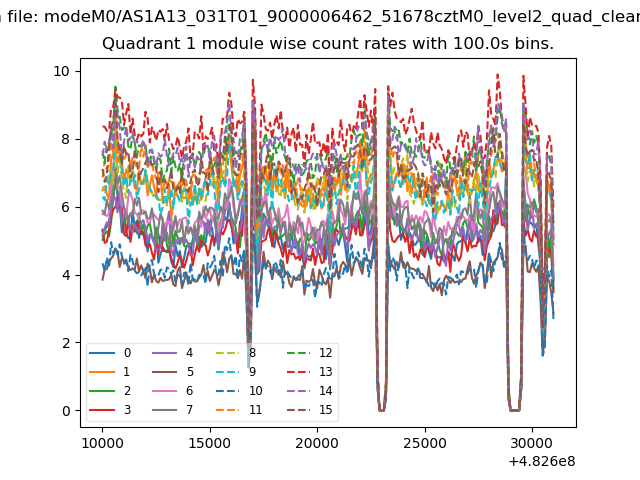
| Module-wise count rates for Quadrant A Data is divided into 100 sec bins |
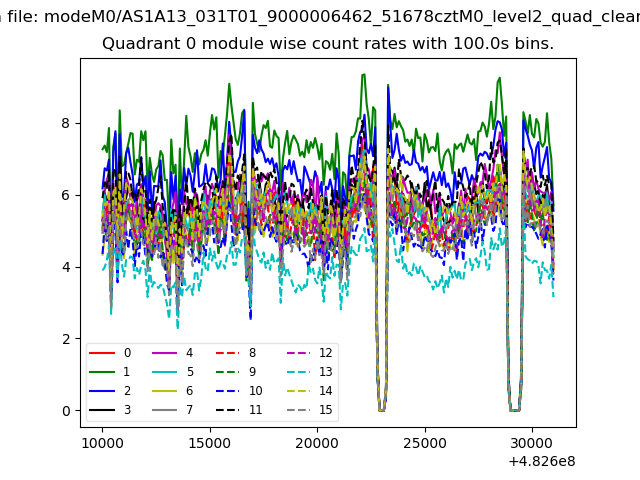 |
 |
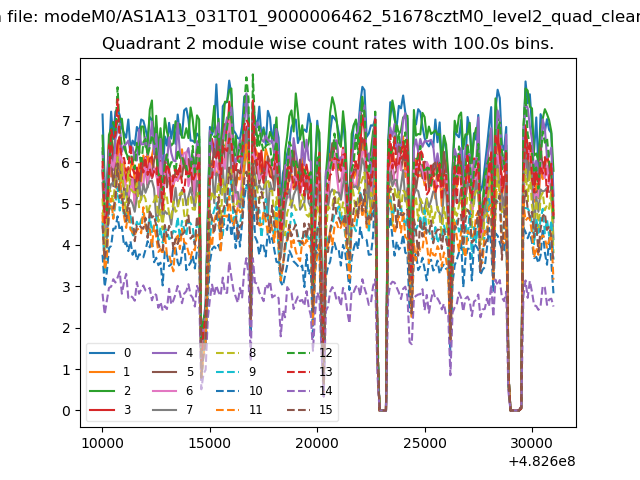
| Module-wise count rates for Quadrant B Data is divided into 100 sec bins |
 |
 |
| Module-wise count rates for Quadrant C Data is divided into 100 sec bins |
 |
 |
| Module-wise count rates for Quadrant D Data is divided into 100 sec bins |
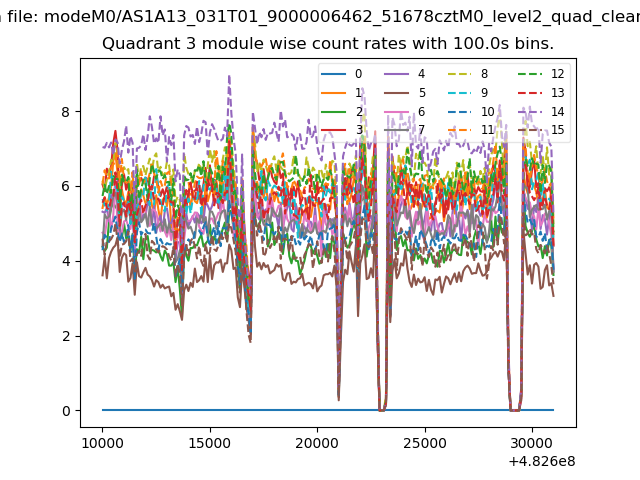 |
 |
| Parameter | Plot |
|---|---|
| CZT HV Monitor | 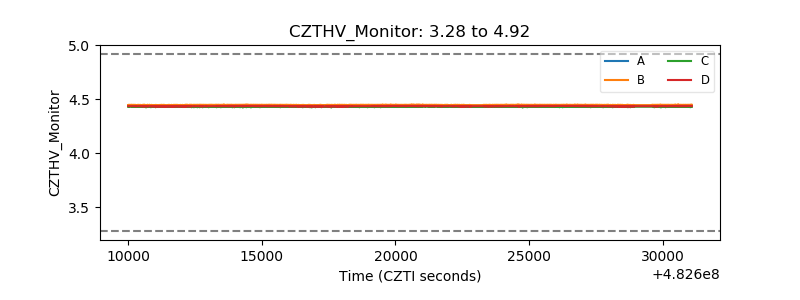 |
| D_VDD | 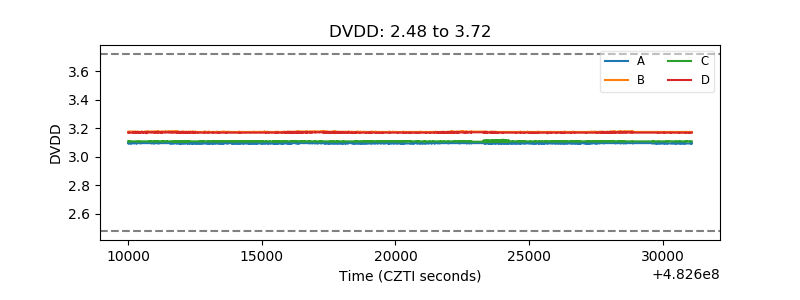 |
| Temperature 1 | 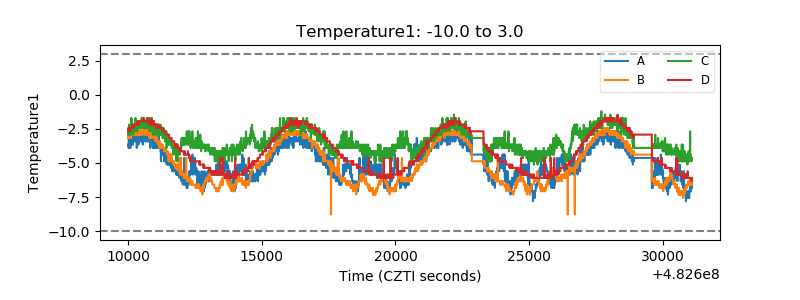 |
| Veto HV Monitor | 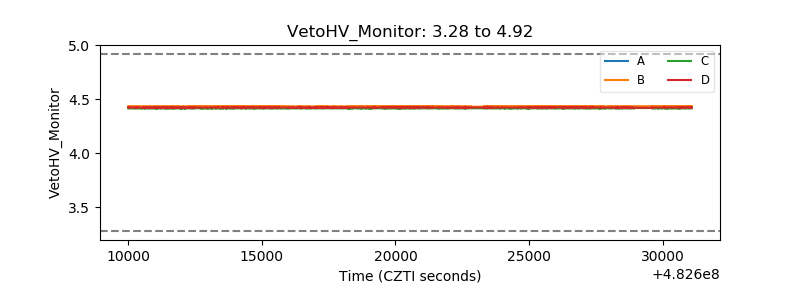 |
| Veto LLD | 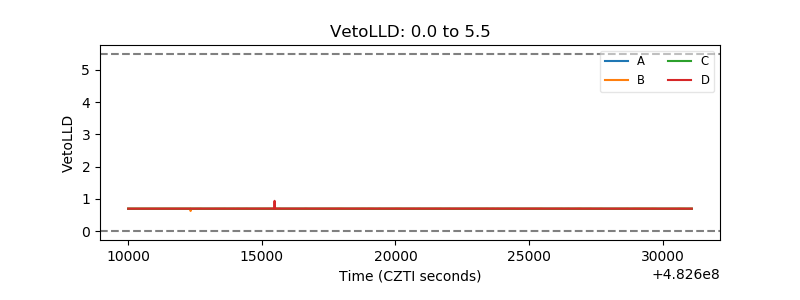 |
| Alpha Counter | 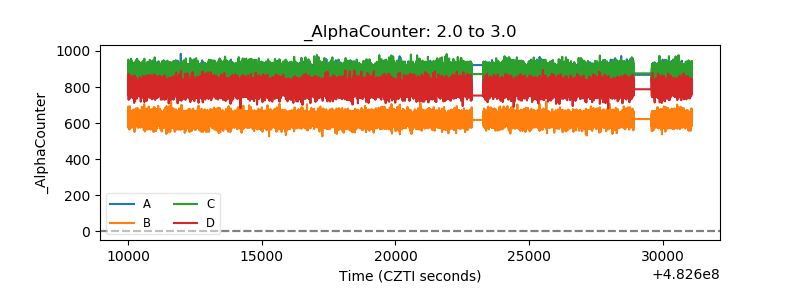 |
| _CPM_Rate | 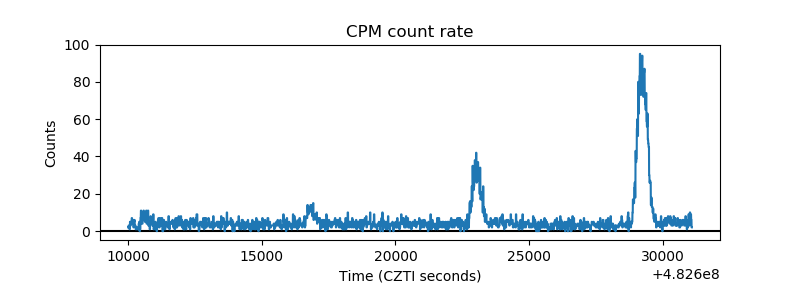 |
| CZT Counter | 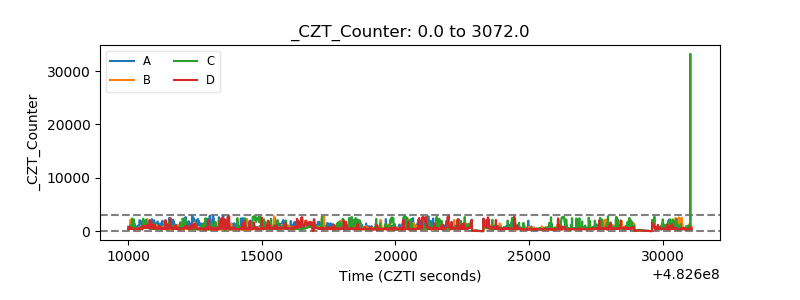 |
| +2.5 Volts monitor | 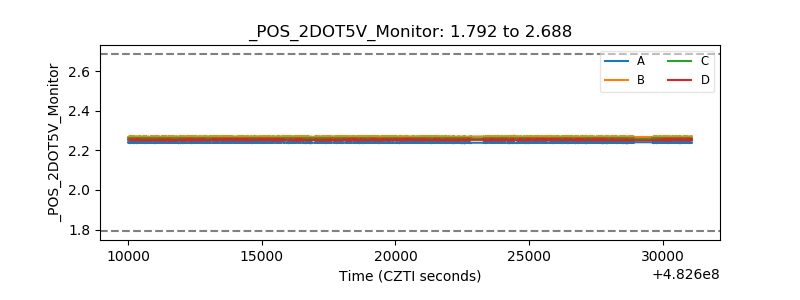 |
| +5 Volts monitor | 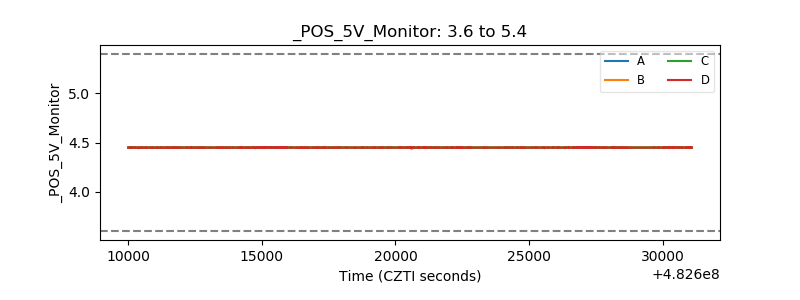 |
| _ROLL_ROT | 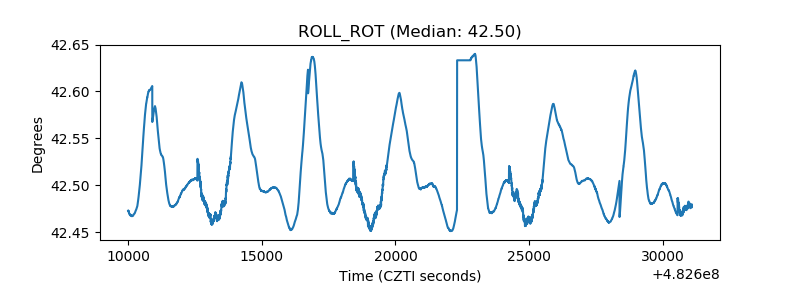 |
| _Roll_DEC | 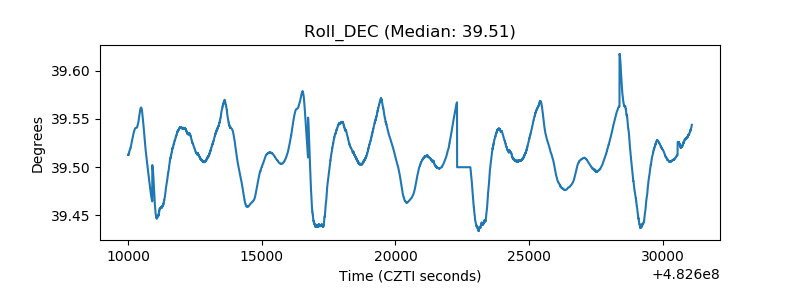 |
| _Roll_RA | 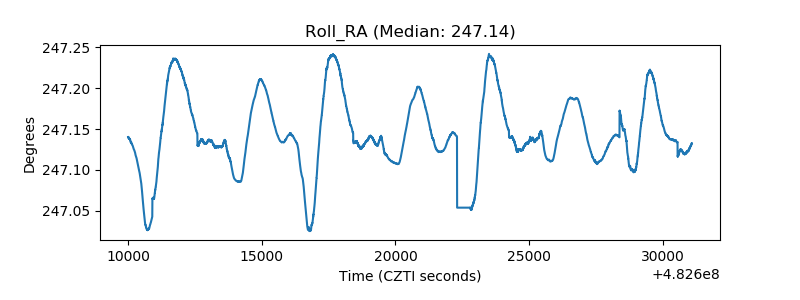 |
| Veto Counter | 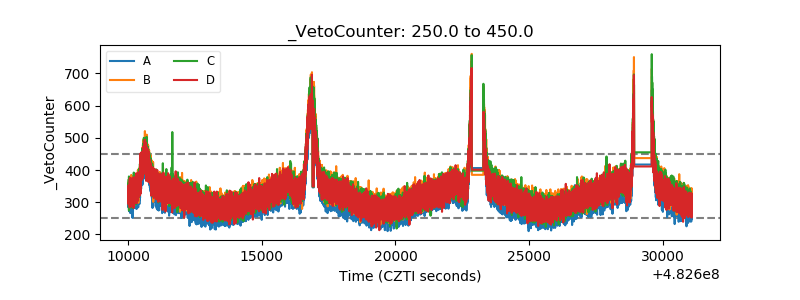 |