| Param | Original file | Final file |
|---|---|---|
| Filename | modeM0/AS1A13_031T01_9000006462_51679cztM0_level2.fits | modeM0/AS1A13_031T01_9000006462_51679cztM0_level2_quad_clean.evt |
| Size (bytes) | 511,243,200 | 102,075,840 |
| Size | 487.6 MB | 97.3 MB |
| Events in quadrant A | 4,053,552 | 658,636 |
| Events in quadrant B | 4,824,571 | 698,252 |
| Events in quadrant C | 5,672,068 | 626,268 |
| Events in quadrant D | 3,812,087 | 603,426 |
| Mode M9 | |||
|---|---|---|---|
| Quadrant | BADHDUFLAG | Total packets | Discarded packets |
| A | 0 | 15 | 0 |
| B | 0 | 15 | 0 |
| C | 0 | 15 | 0 |
| D | 0 | 15 | 0 |
| Mode M0 | |||
|---|---|---|---|
| Quadrant | BADHDUFLAG | Total packets | Discarded packets |
| A | 0 | 17199 | 2 |
| B | 0 | 19327 | 2 |
| C | 0 | 21871 | 6 |
| D | 0 | 16960 | 2 |
| Mode SS | |||
|---|---|---|---|
| Quadrant | BADHDUFLAG | Total packets | Discarded packets |
| A | 0 | 150 | 0 |
| B | 0 | 150 | 0 |
| C | 0 | 150 | 0 |
| D | 0 | 150 | 0 |
| Quadrant | Total seconds | Saturated seconds | Saturation percentage |
|---|---|---|---|
| A | 7237 | 157 | 2.169407% |
| B | 7238 | 418 | 5.775076% |
| C | 7237 | 477 | 6.591129% |
| D | 7237 | 139 | 1.920685% |
Noise dominated data is calculated using 1-second bins in cleaned event files. If a bin has >2000 counts, and if more than 50% of those come from <1% of pixels, then it is considered to be noise-dominated and hence unusable.
| Quadrant | # 1 sec bins | Bins with >0 counts | Bins with >2000 counts | High rate bins dominated by noise | Noise dominated (total time) | Noise dominated (detector-on time) | Marked lightcurve |
|---|---|---|---|---|---|---|---|
| A | 8748 | 7239 | 101 | 101 | 1.15% | 1.40% | 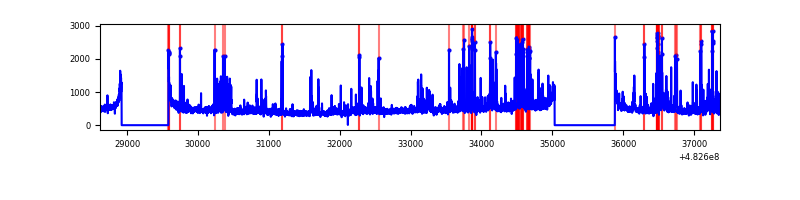 |
| B | 8749 | 7239 | 335 | 335 | 3.83% | 4.63% | 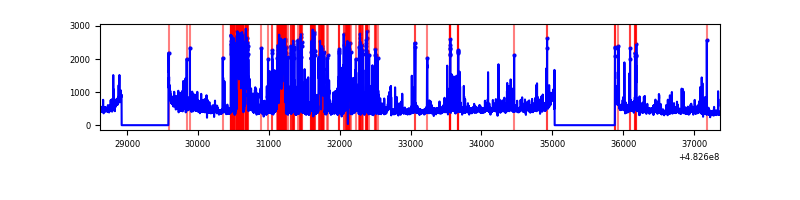 |
| C | 8747 | 7237 | 379 | 379 | 4.33% | 5.24% | 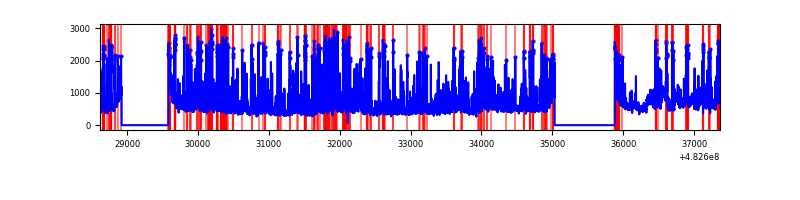 |
| D | 8748 | 7240 | 111 | 111 | 1.27% | 1.53% | 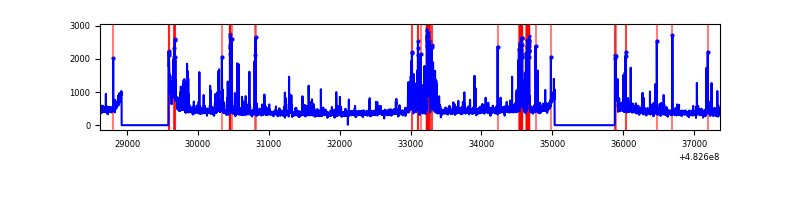 |
Top three noisy pixels from each quadrant. If the there are fewer than three noisy pixels in the level2.evt file, extra rows are filled as -1
| Pixel properties | Quadrant properties | ||||||
|---|---|---|---|---|---|---|---|
| Quadrant | DetID | PixID | Counts | Sigma | Mean | Median | Sigma |
| A | 7 | 64 | 321073 | 1723.52 | 755 | 737 | 185.9 |
| A | 13 | 248 | 188222 | 1008.74 | 755 | 737 | 185.9 |
| A | 5 | 240 | 141774 | 758.83 | 755 | 737 | 185.9 |
| B | 6 | 51 | 634368 | 3957.89 | 746 | 718 | 160.1 |
| B | 5 | 172 | 570115 | 3556.56 | 746 | 718 | 160.1 |
| B | 1 | 223 | 108978 | 676.21 | 746 | 718 | 160.1 |
| C | 15 | 189 | 904559 | 4532.6 | 729 | 723 | 199.4 |
| C | 5 | 250 | 476496 | 2385.93 | 729 | 723 | 199.4 |
| C | 13 | 3 | 448513 | 2245.6 | 729 | 723 | 199.4 |
| D | 6 | 42 | 240539 | 1178.26 | 730 | 705 | 203.5 |
| D | 2 | 120 | 205352 | 1005.39 | 730 | 705 | 203.5 |
| D | 8 | 176 | 203088 | 994.27 | 730 | 705 | 203.5 |
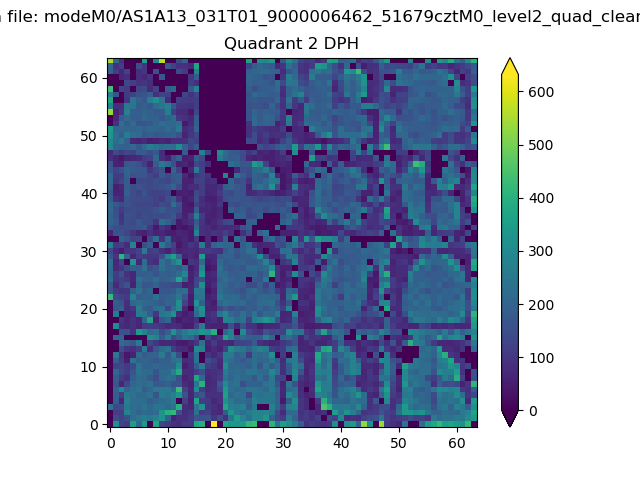
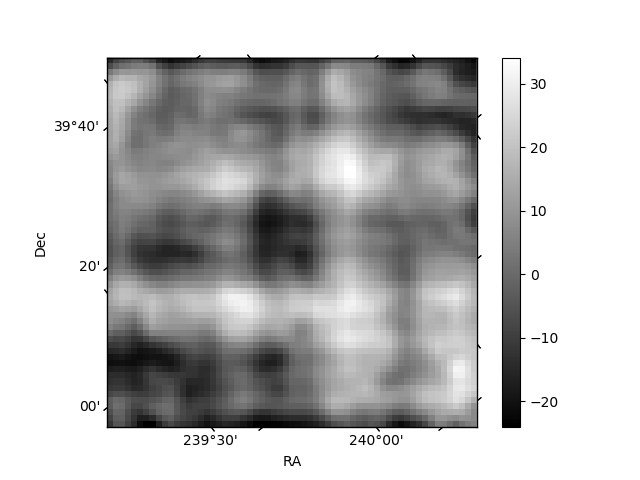
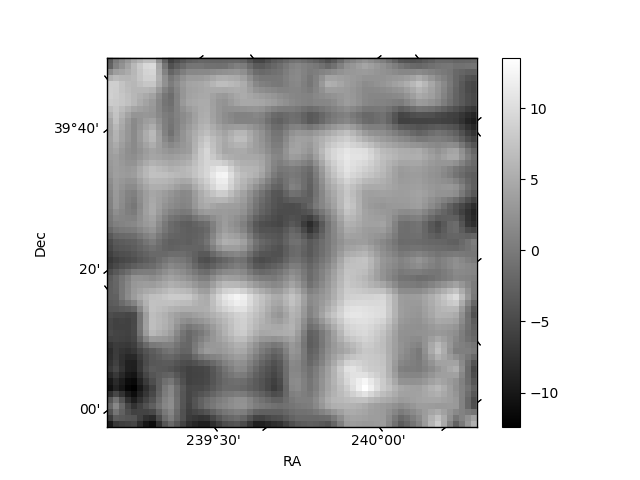
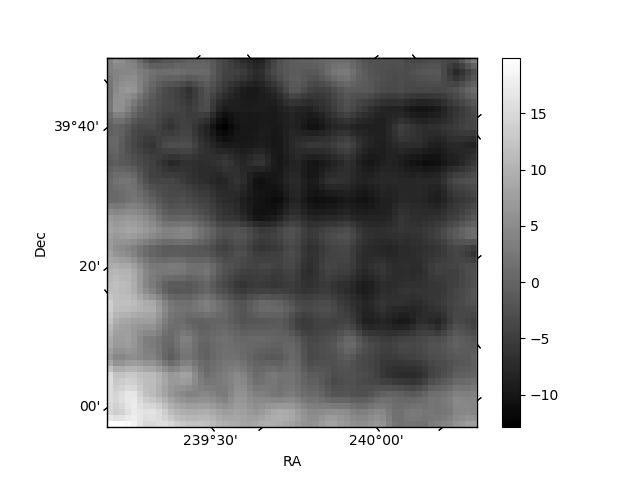
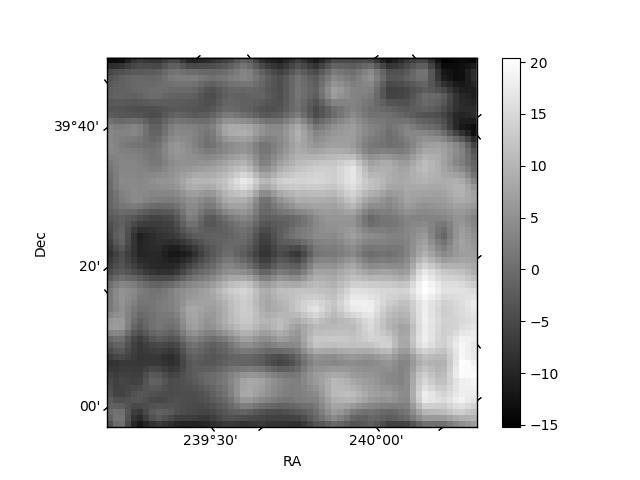
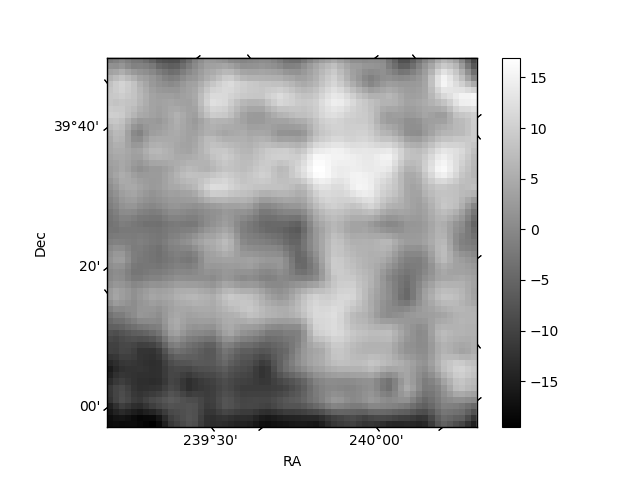
Histogram calculated using DETX and DETY for each event in the final _common_clean file
| Quadrant A | 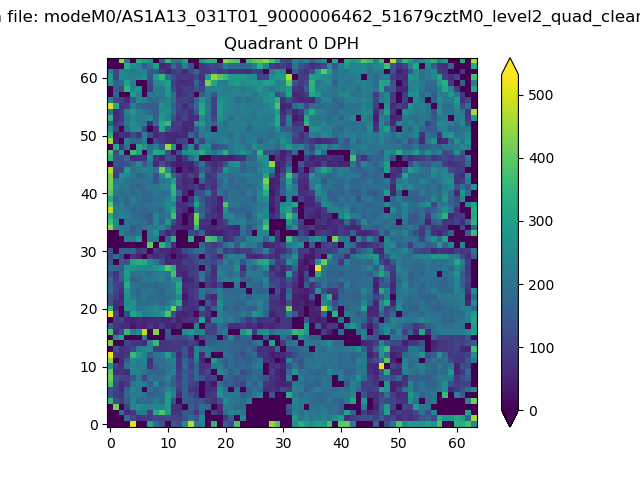 |
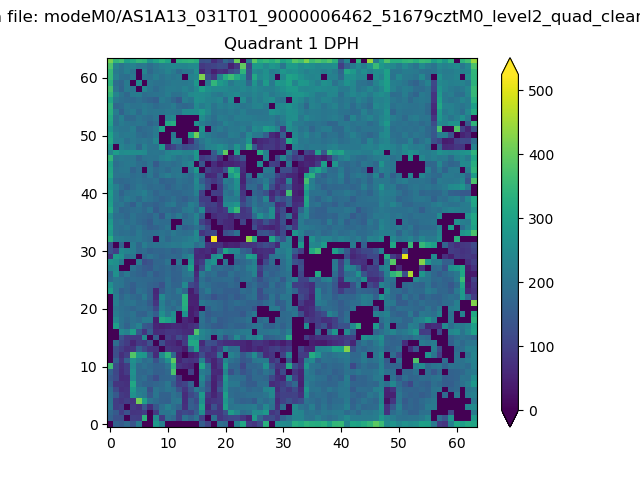 |
Quadrant B |
|---|---|---|---|
| Quadrant D | 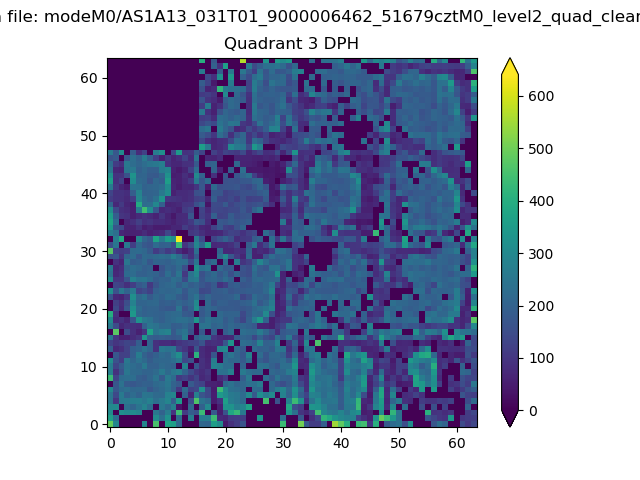 |
 |
Quadrant C |
| Plot type | Count rate plots | Images |
|---|---|---|
| Comparison with Poisson distribution Blue bars denote a histogram of data divided into 1 sec bins. Red curve is a Poisson curve with rate = median count rate of data. |
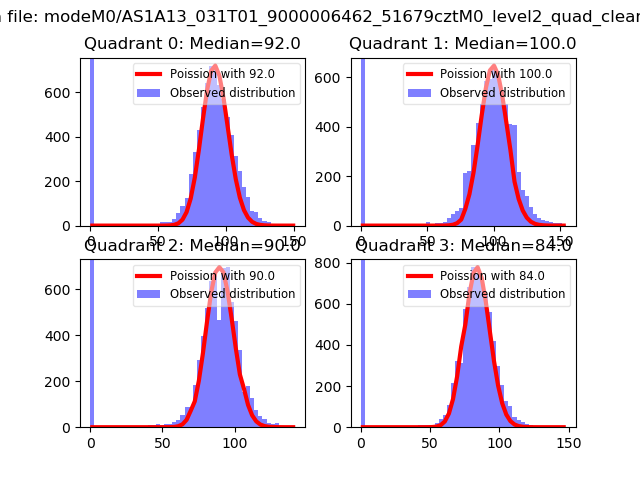 |
 |
| Quadrant-wise count rates Data is divided into 100 sec bins |
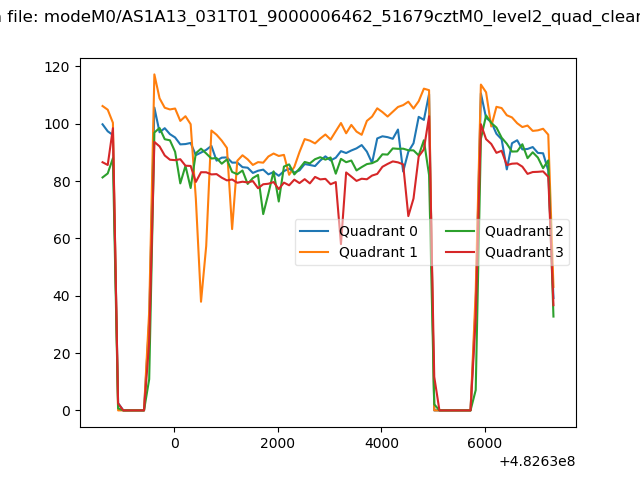 |
|
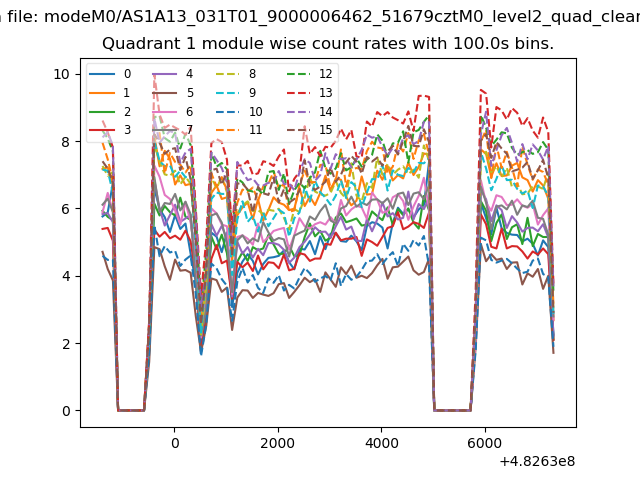
| Module-wise count rates for Quadrant A Data is divided into 100 sec bins |
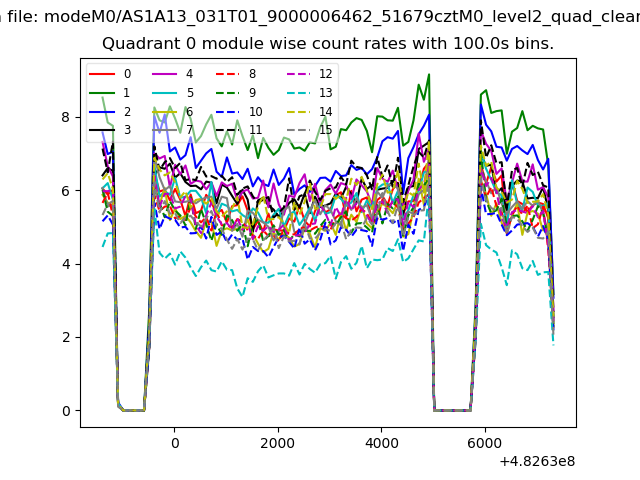 |
 |
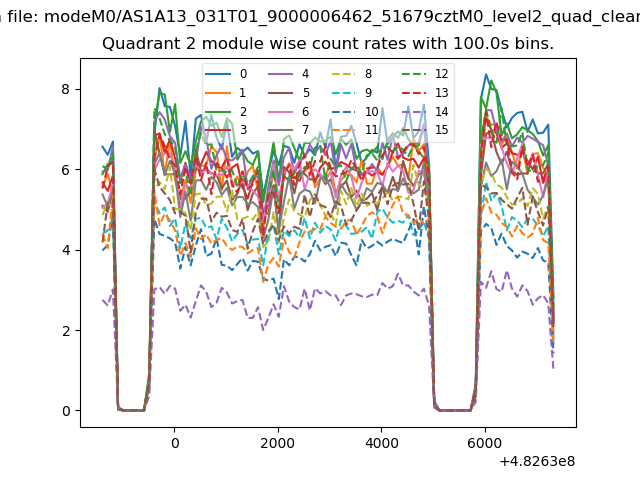
| Module-wise count rates for Quadrant B Data is divided into 100 sec bins |
 |
 |
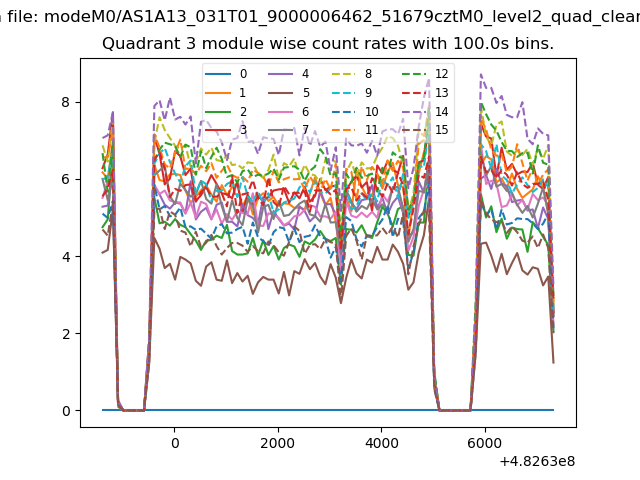
| Module-wise count rates for Quadrant C Data is divided into 100 sec bins |
 |
 |
| Module-wise count rates for Quadrant D Data is divided into 100 sec bins |
 |
 |
| Parameter | Plot |
|---|---|
| CZT HV Monitor | 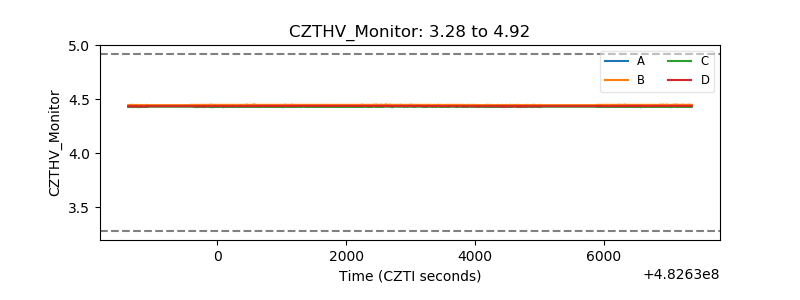 |
| D_VDD | 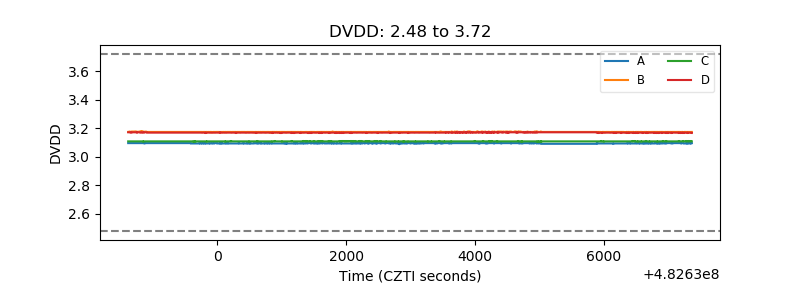 |
| Temperature 1 |  |
| Veto HV Monitor | 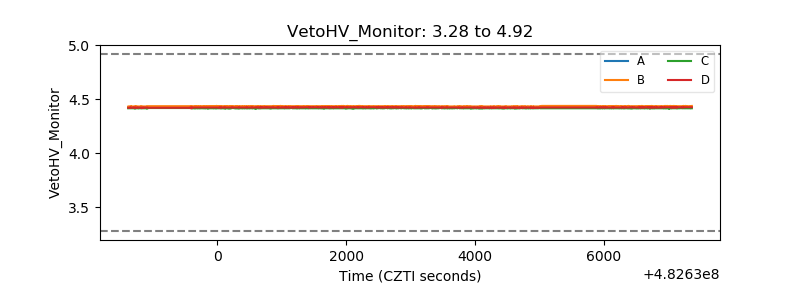 |
| Veto LLD | 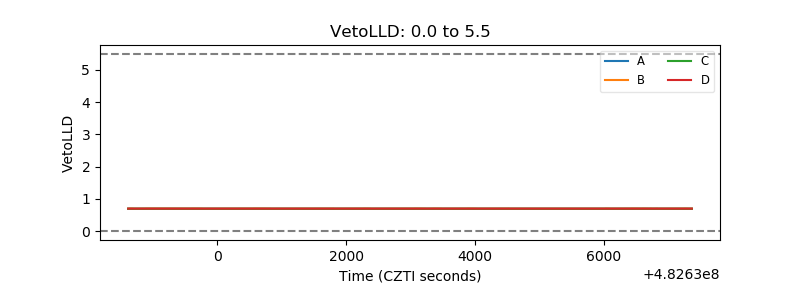 |
| Alpha Counter | 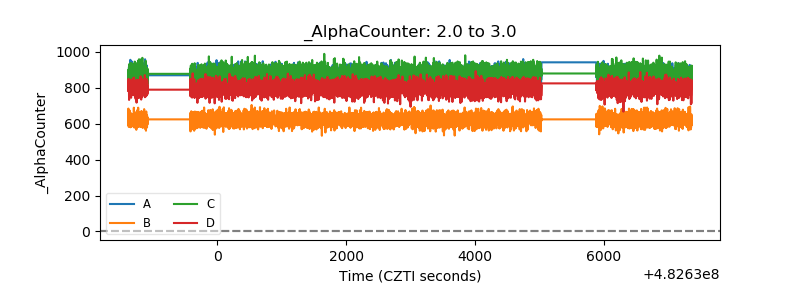 |
| _CPM_Rate | 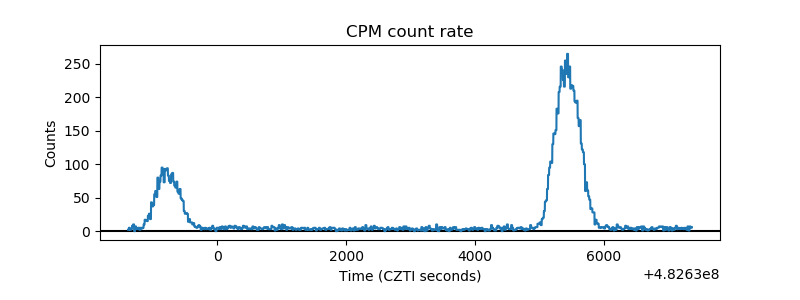 |
| CZT Counter | 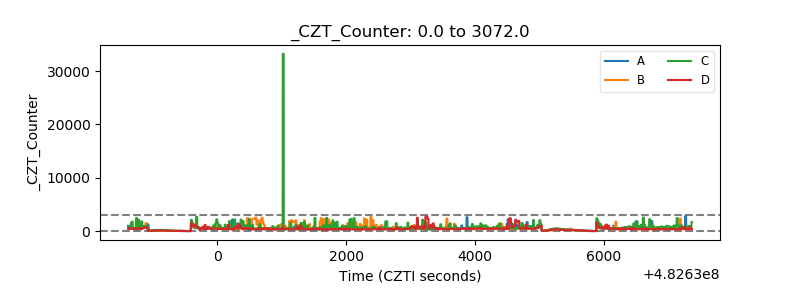 |
| +2.5 Volts monitor | 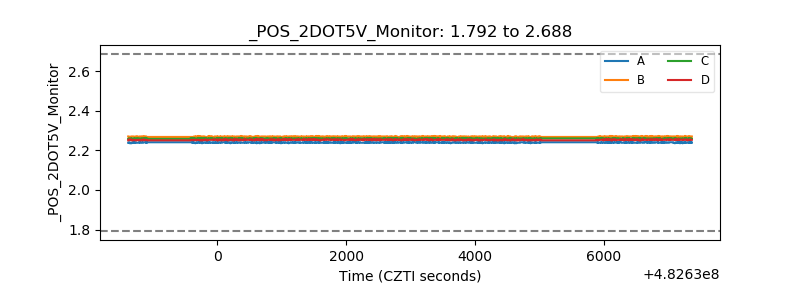 |
| +5 Volts monitor | 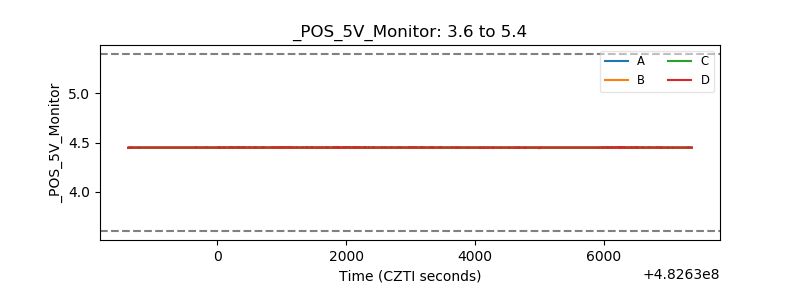 |
| _ROLL_ROT | 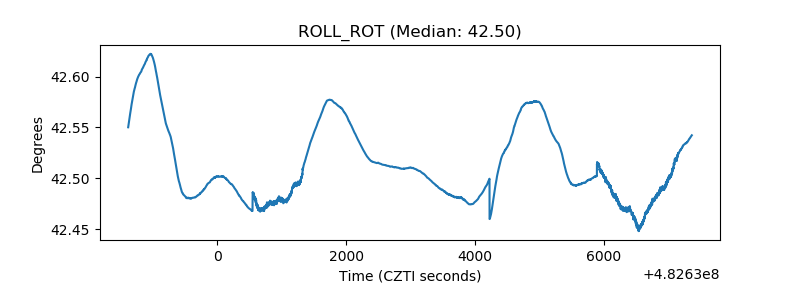 |
| _Roll_DEC | 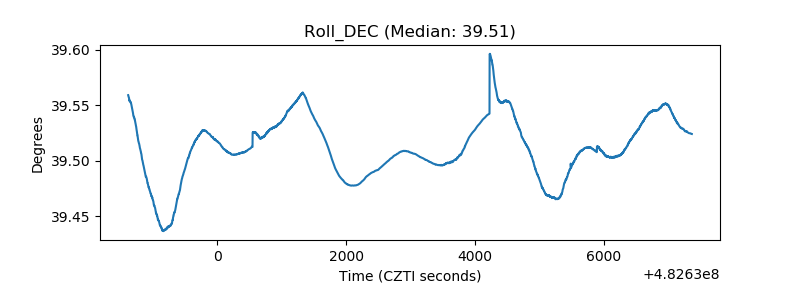 |
| _Roll_RA | 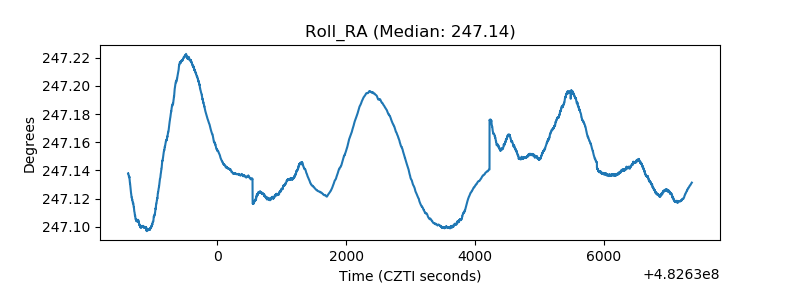 |
| Veto Counter | 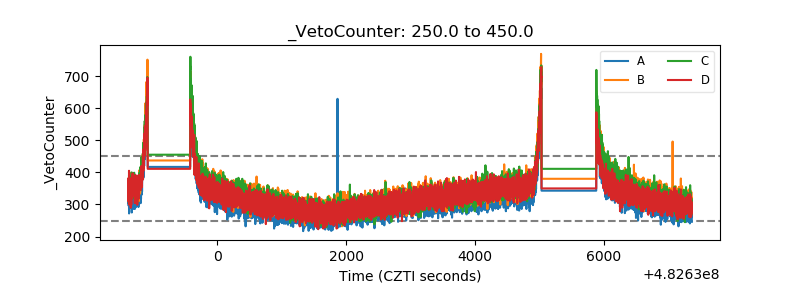 |