| Param | Original file | Final file |
|---|---|---|
| Filename | modeM0/AS1A13_031T01_9000006462_51681cztM0_level2.fits | modeM0/AS1A13_031T01_9000006462_51681cztM0_level2_quad_clean.evt |
| Size (bytes) | 522,417,600 | 94,469,760 |
| Size | 498.2 MB | 90.1 MB |
| Events in quadrant A | 4,033,563 | 617,366 |
| Events in quadrant B | 4,169,550 | 665,981 |
| Events in quadrant C | 7,356,479 | 537,756 |
| Events in quadrant D | 3,258,513 | 572,103 |
| Mode M9 | |||
|---|---|---|---|
| Quadrant | BADHDUFLAG | Total packets | Discarded packets |
| A | 0 | 10 | 0 |
| B | 0 | 10 | 0 |
| C | 0 | 10 | 0 |
| D | 0 | 10 | 0 |
| Mode M0 | |||
|---|---|---|---|
| Quadrant | BADHDUFLAG | Total packets | Discarded packets |
| A | 0 | 16592 | 2 |
| B | 0 | 17102 | 2 |
| C | 0 | 26479 | 2 |
| D | 0 | 14862 | 2 |
| Mode SS | |||
|---|---|---|---|
| Quadrant | BADHDUFLAG | Total packets | Discarded packets |
| A | 0 | 136 | 0 |
| B | 0 | 136 | 0 |
| C | 0 | 136 | 0 |
| D | 0 | 136 | 0 |
| Quadrant | Total seconds | Saturated seconds | Saturation percentage |
|---|---|---|---|
| A | 6700 | 144 | 2.149254% |
| B | 6701 | 216 | 3.223399% |
| C | 6701 | 1107 | 16.519922% |
| D | 6701 | 72 | 1.074466% |
Noise dominated data is calculated using 1-second bins in cleaned event files. If a bin has >2000 counts, and if more than 50% of those come from <1% of pixels, then it is considered to be noise-dominated and hence unusable.
| Quadrant | # 1 sec bins | Bins with >0 counts | Bins with >2000 counts | High rate bins dominated by noise | Noise dominated (total time) | Noise dominated (detector-on time) | Marked lightcurve |
|---|---|---|---|---|---|---|---|
| A | 7694 | 6699 | 106 | 106 | 1.38% | 1.58% | 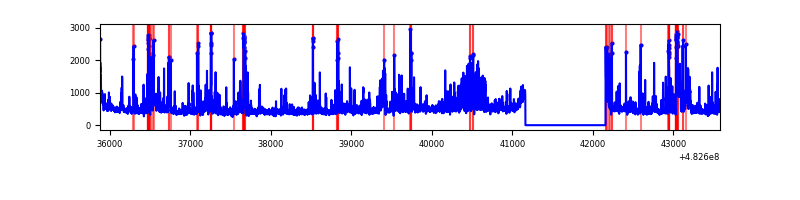 |
| B | 7695 | 6700 | 136 | 136 | 1.77% | 2.03% | 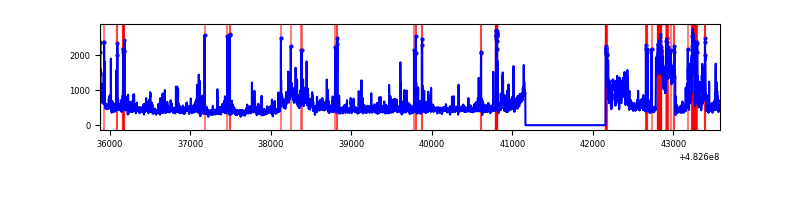 |
| C | 7695 | 6700 | 1093 | 1093 | 14.20% | 16.31% | 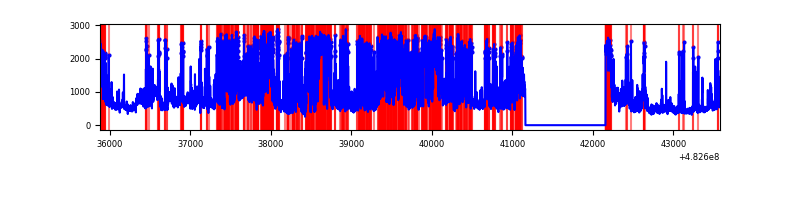 |
| D | 7695 | 6700 | 60 | 60 | 0.78% | 0.90% | 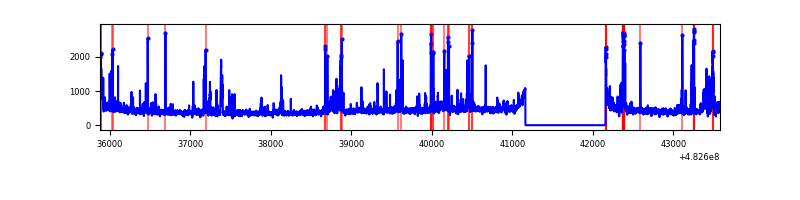 |
Top three noisy pixels from each quadrant. If the there are fewer than three noisy pixels in the level2.evt file, extra rows are filled as -1
| Pixel properties | Quadrant properties | ||||||
|---|---|---|---|---|---|---|---|
| Quadrant | DetID | PixID | Counts | Sigma | Mean | Median | Sigma |
| A | 7 | 64 | 432450 | 2535.19 | 691 | 676 | 170.3 |
| A | 3 | 14 | 239590 | 1402.8 | 691 | 676 | 170.3 |
| A | 15 | 174 | 171301 | 1001.84 | 691 | 676 | 170.3 |
| B | 5 | 172 | 722492 | 4902.86 | 687 | 663 | 147.2 |
| B | 10 | 254 | 202608 | 1371.67 | 687 | 663 | 147.2 |
| B | 5 | 173 | 108104 | 729.77 | 687 | 663 | 147.2 |
| C | 15 | 189 | 2077945 | 11846.78 | 637 | 634 | 175.3 |
| C | 5 | 250 | 1119563 | 6381.19 | 637 | 634 | 175.3 |
| C | 12 | 254 | 586817 | 3342.97 | 637 | 634 | 175.3 |
| D | 8 | 176 | 163812 | 866.56 | 670 | 645 | 188.3 |
| D | 2 | 249 | 81942 | 431.76 | 670 | 645 | 188.3 |
| D | 5 | 173 | 60996 | 320.52 | 670 | 645 | 188.3 |
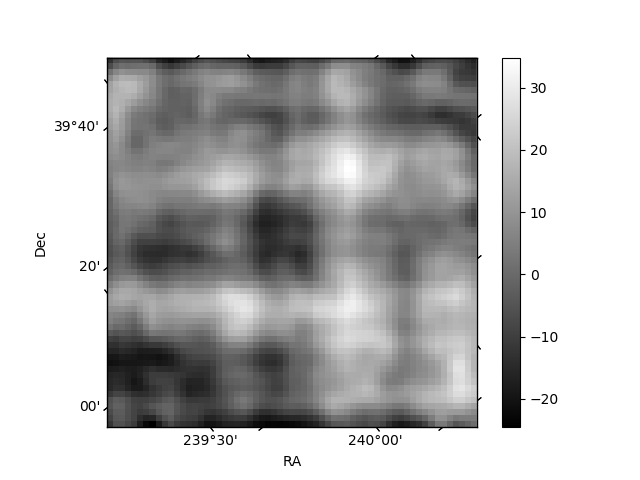
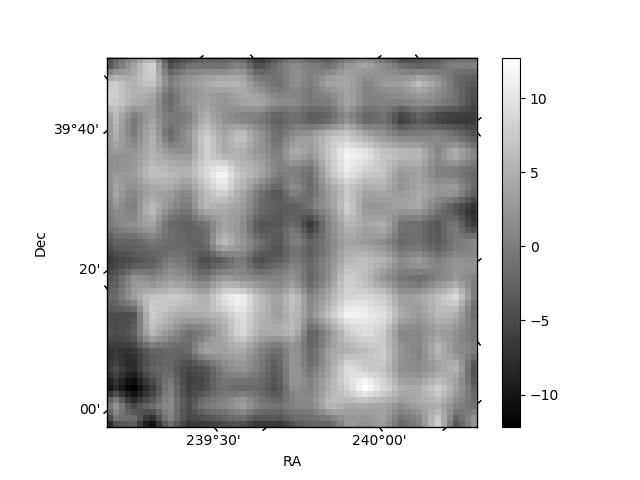
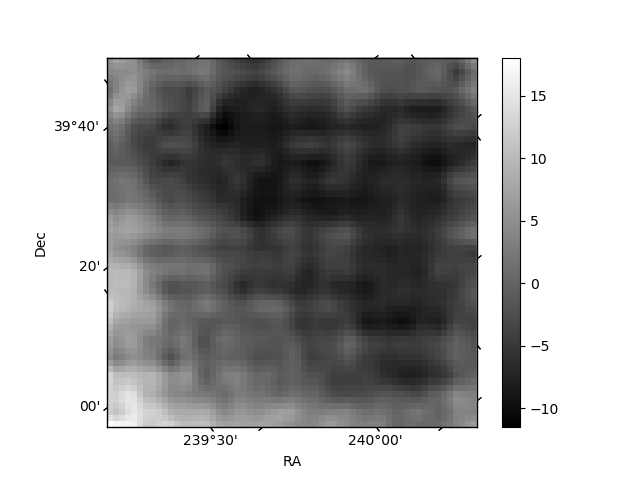
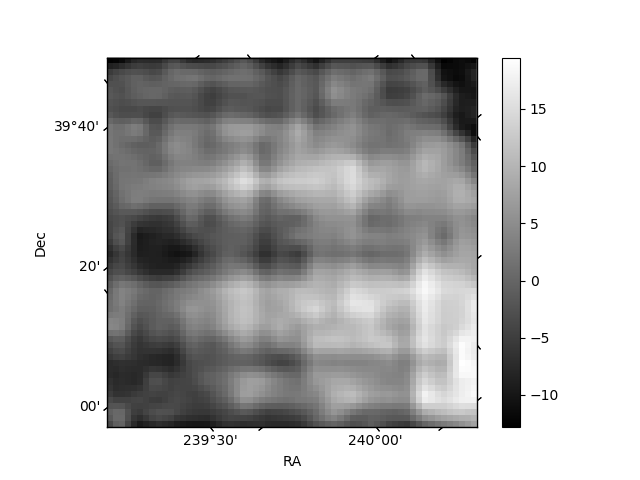
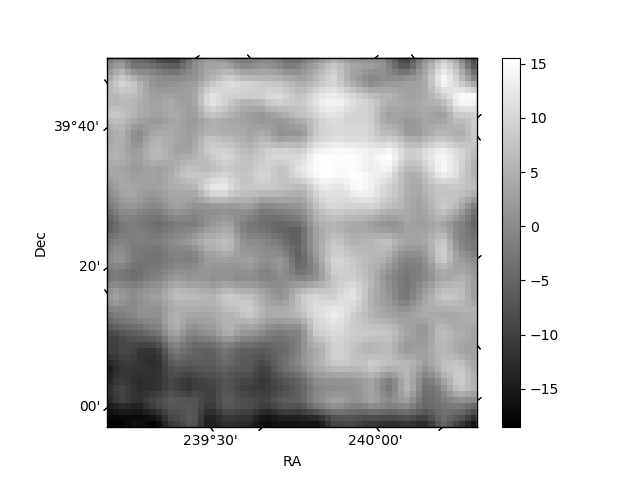
Histogram calculated using DETX and DETY for each event in the final _common_clean file
| Quadrant A | 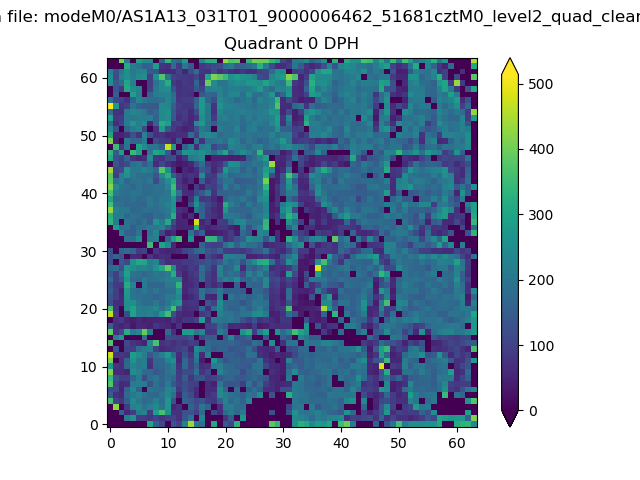 |
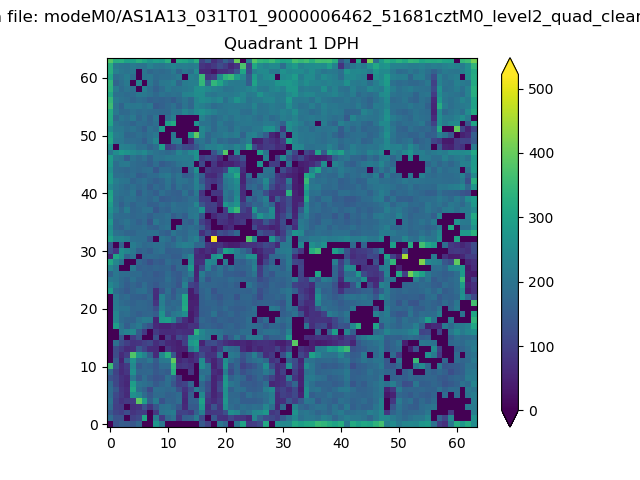 |
Quadrant B |
|---|---|---|---|
| Quadrant D | 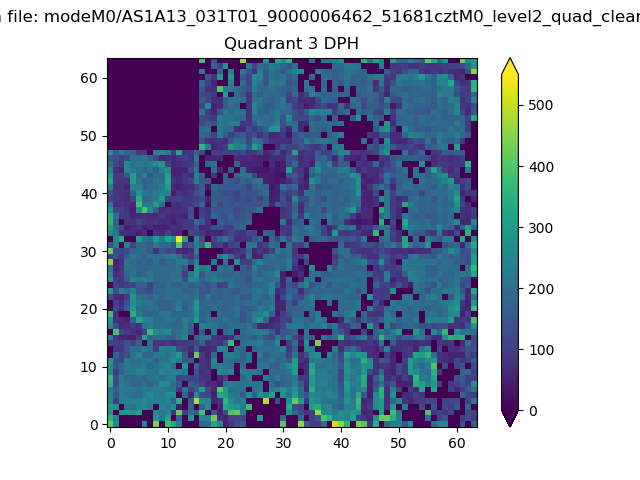 |
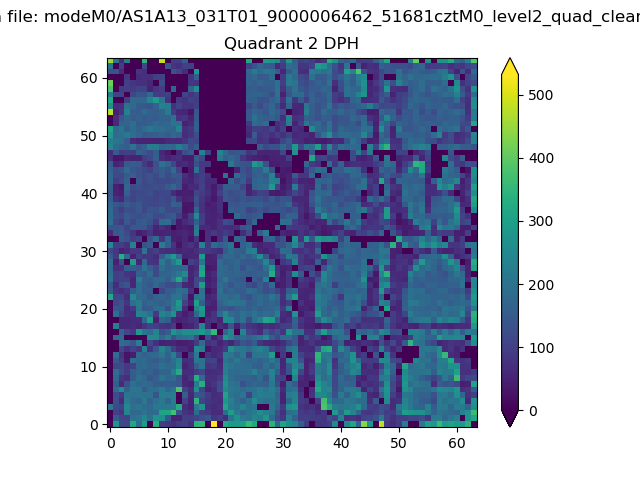 |
Quadrant C |
| Plot type | Count rate plots | Images |
|---|---|---|
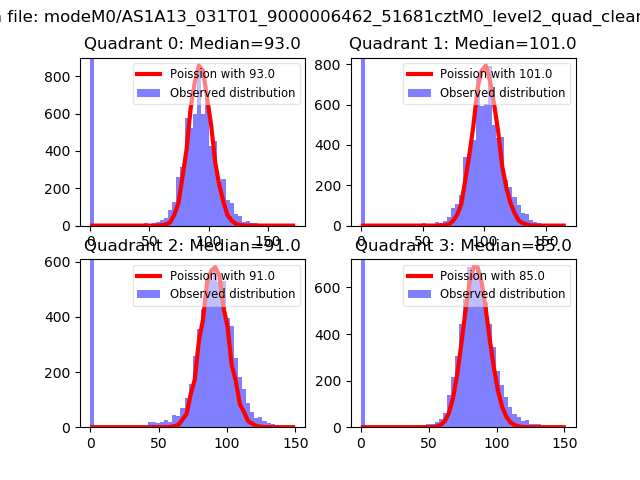
| Comparison with Poisson distribution Blue bars denote a histogram of data divided into 1 sec bins. Red curve is a Poisson curve with rate = median count rate of data. |
 |
 |
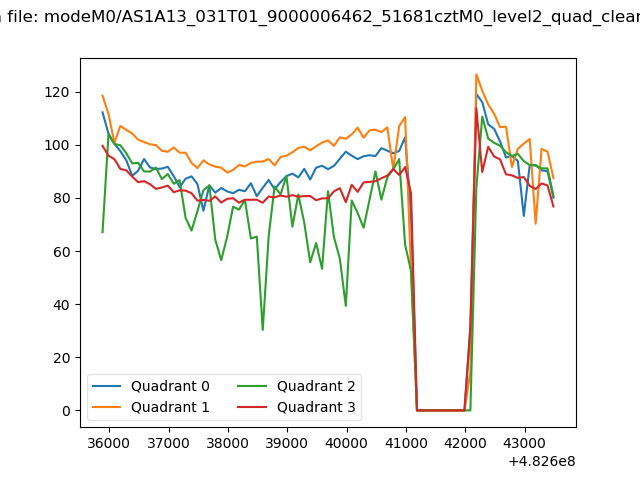
| Quadrant-wise count rates Data is divided into 100 sec bins |
 |
|
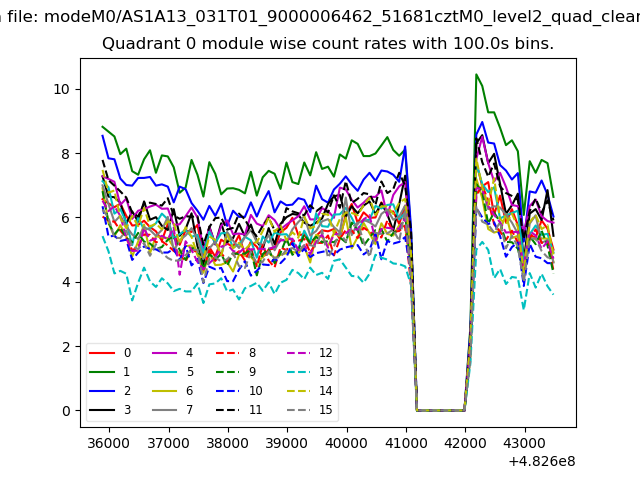
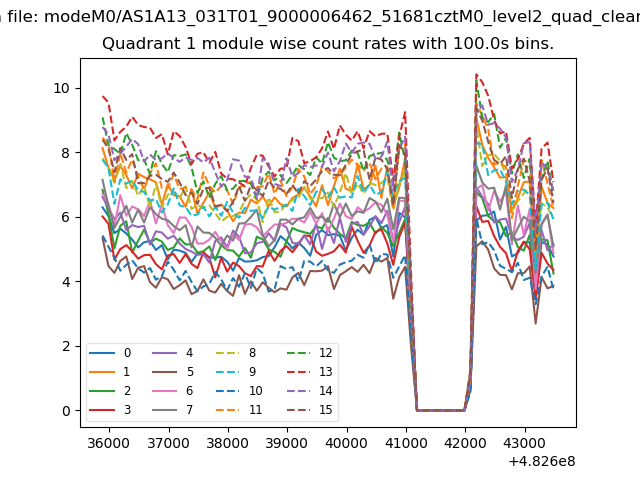
| Module-wise count rates for Quadrant A Data is divided into 100 sec bins |
 |
 |
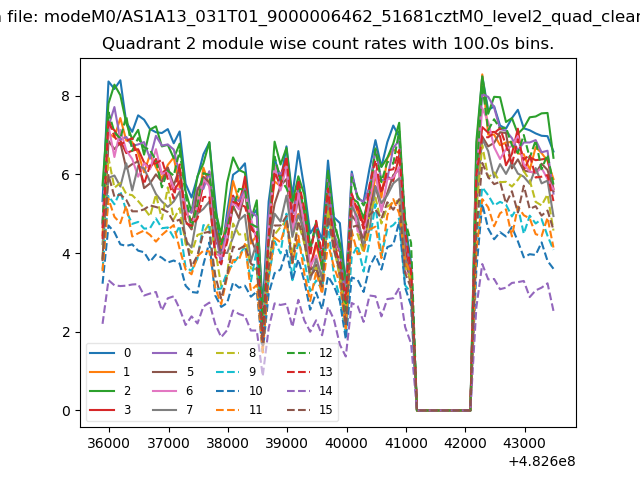
| Module-wise count rates for Quadrant B Data is divided into 100 sec bins |
 |
 |
| Module-wise count rates for Quadrant C Data is divided into 100 sec bins |
 |
 |
| Module-wise count rates for Quadrant D Data is divided into 100 sec bins |
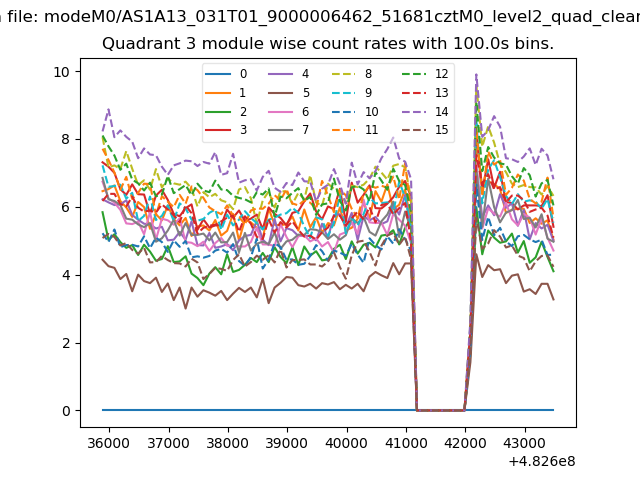 |
 |
| Parameter | Plot |
|---|---|
| CZT HV Monitor |  |
| D_VDD | 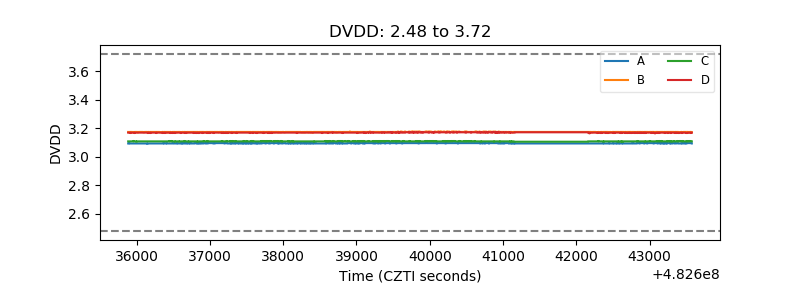 |
| Temperature 1 |  |
| Veto HV Monitor | 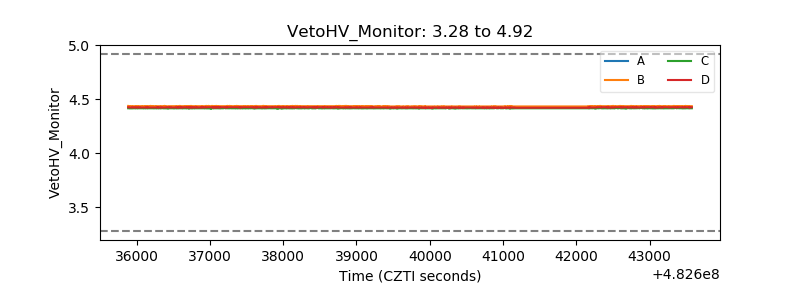 |
| Veto LLD | 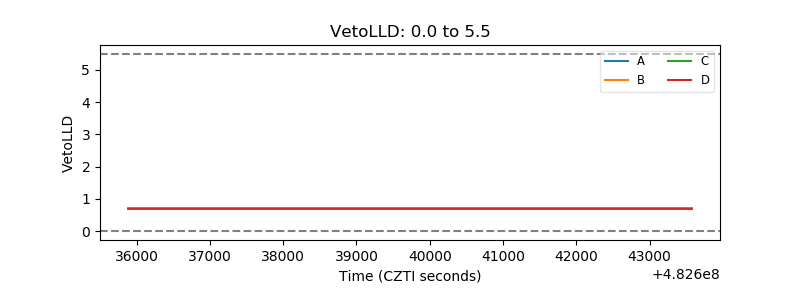 |
| Alpha Counter | 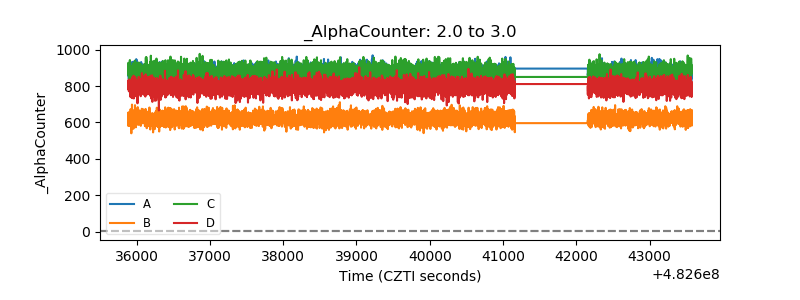 |
| _CPM_Rate | 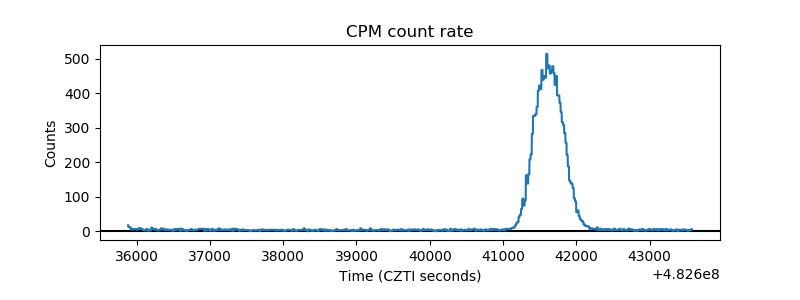 |
| CZT Counter | 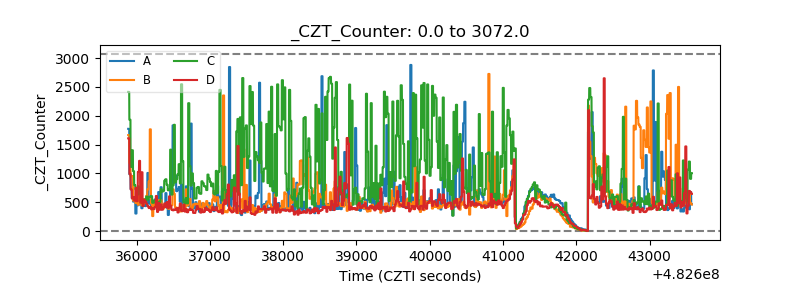 |
| +2.5 Volts monitor | 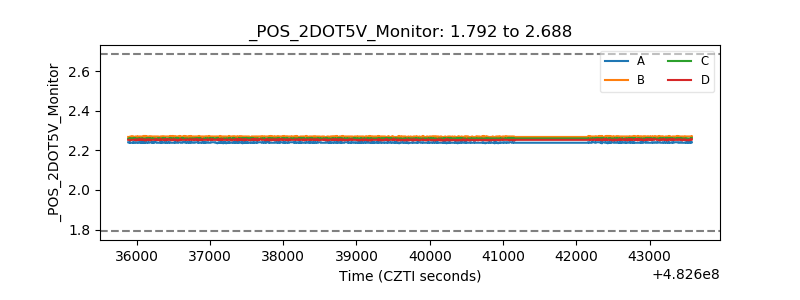 |
| +5 Volts monitor | 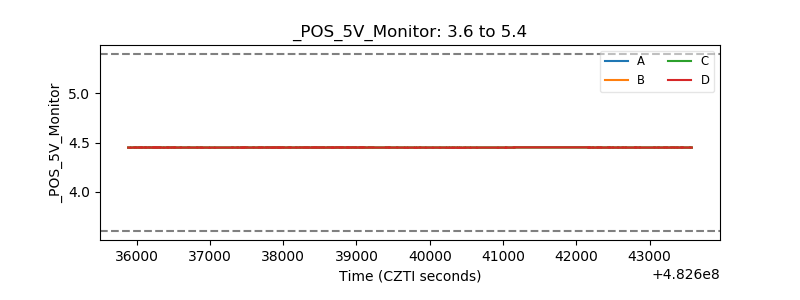 |
| _ROLL_ROT | 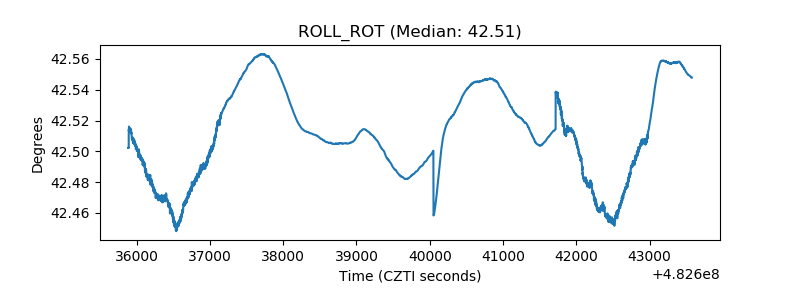 |
| _Roll_DEC | 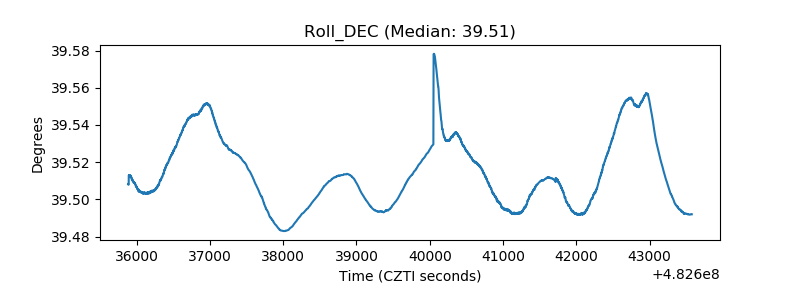 |
| _Roll_RA | 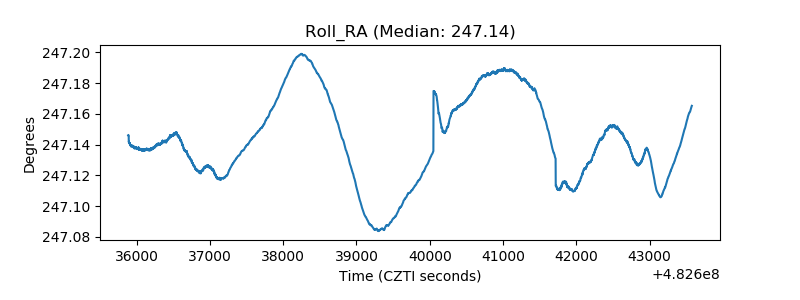 |
| Veto Counter | 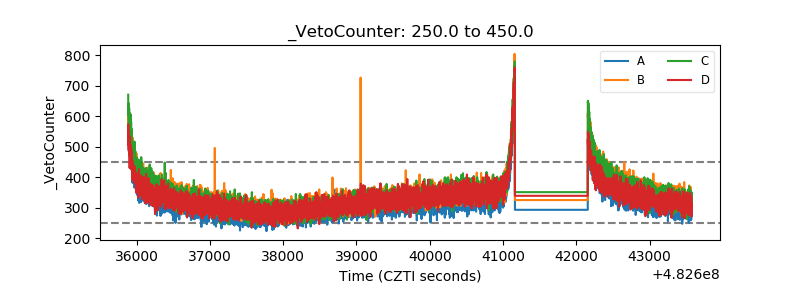 |