| Param | Original file | Final file |
|---|---|---|
| Filename | modeM0/AS1A13_031T01_9000006462_51682cztM0_level2.fits | modeM0/AS1A13_031T01_9000006462_51682cztM0_level2_quad_clean.evt |
| Size (bytes) | 521,516,160 | 87,909,120 |
| Size | 497.4 MB | 83.8 MB |
| Events in quadrant A | 4,637,129 | 566,567 |
| Events in quadrant B | 3,741,237 | 641,300 |
| Events in quadrant C | 6,855,366 | 484,388 |
| Events in quadrant D | 3,581,731 | 530,378 |
| Mode M9 | |||
|---|---|---|---|
| Quadrant | BADHDUFLAG | Total packets | Discarded packets |
| A | 0 | 11 | 0 |
| B | 0 | 11 | 0 |
| C | 0 | 11 | 0 |
| D | 0 | 11 | 0 |
| Mode M0 | |||
|---|---|---|---|
| Quadrant | BADHDUFLAG | Total packets | Discarded packets |
| A | 0 | 18084 | 1 |
| B | 0 | 15475 | 1 |
| C | 0 | 24718 | 1 |
| D | 0 | 15357 | 1 |
| Mode SS | |||
|---|---|---|---|
| Quadrant | BADHDUFLAG | Total packets | Discarded packets |
| A | 0 | 126 | 0 |
| B | 0 | 126 | 0 |
| C | 0 | 126 | 0 |
| D | 0 | 126 | 0 |
| Quadrant | Total seconds | Saturated seconds | Saturation percentage |
|---|---|---|---|
| A | 6297 | 472 | 7.495633% |
| B | 6298 | 192 | 3.048587% |
| C | 6298 | 1348 | 21.403620% |
| D | 6298 | 271 | 4.302953% |
Noise dominated data is calculated using 1-second bins in cleaned event files. If a bin has >2000 counts, and if more than 50% of those come from <1% of pixels, then it is considered to be noise-dominated and hence unusable.
| Quadrant | # 1 sec bins | Bins with >0 counts | Bins with >2000 counts | High rate bins dominated by noise | Noise dominated (total time) | Noise dominated (detector-on time) | Marked lightcurve |
|---|---|---|---|---|---|---|---|
| A | 7336 | 6297 | 385 | 385 | 5.25% | 6.11% | 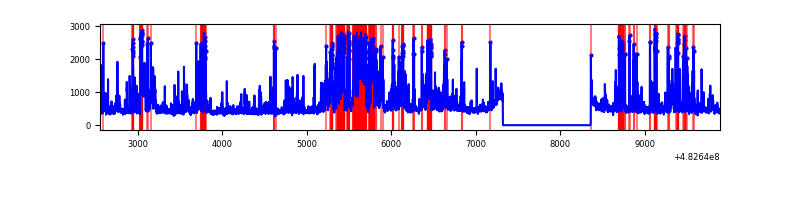 |
| B | 7337 | 6298 | 101 | 101 | 1.38% | 1.60% | 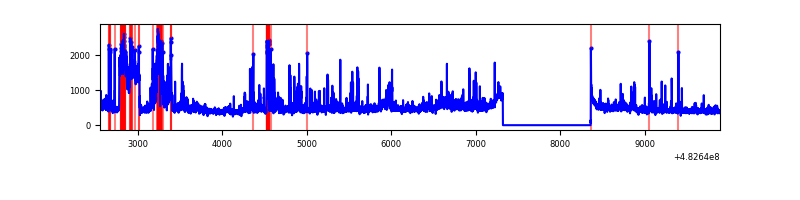 |
| C | 7337 | 6298 | 1235 | 1235 | 16.83% | 19.61% | 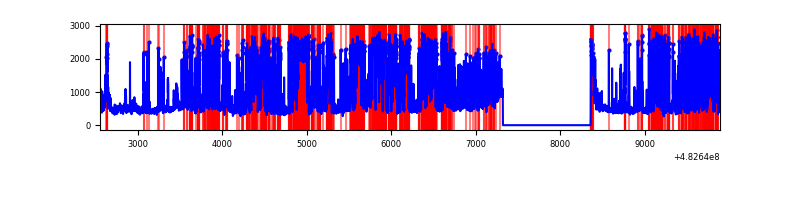 |
| D | 7337 | 6298 | 244 | 244 | 3.33% | 3.87% | 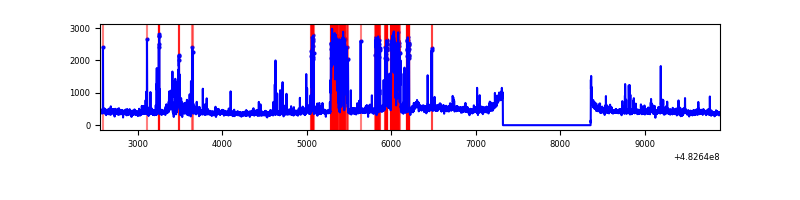 |
Top three noisy pixels from each quadrant. If the there are fewer than three noisy pixels in the level2.evt file, extra rows are filled as -1
| Pixel properties | Quadrant properties | ||||||
|---|---|---|---|---|---|---|---|
| Quadrant | DetID | PixID | Counts | Sigma | Mean | Median | Sigma |
| A | 7 | 64 | 1444652 | 9056.13 | 650 | 636 | 159.5 |
| A | 15 | 174 | 184587 | 1153.65 | 650 | 636 | 159.5 |
| A | 8 | 6 | 87982 | 547.79 | 650 | 636 | 159.5 |
| B | 5 | 172 | 616629 | 4368.38 | 658 | 635 | 141.0 |
| B | 0 | 171 | 99510 | 701.18 | 658 | 635 | 141.0 |
| B | 5 | 173 | 76432 | 537.52 | 658 | 635 | 141.0 |
| C | 15 | 189 | 3153729 | 19613.84 | 584 | 580 | 160.8 |
| C | 13 | 3 | 319588 | 1984.36 | 584 | 580 | 160.8 |
| C | 15 | 231 | 241011 | 1495.58 | 584 | 580 | 160.8 |
| D | 10 | 172 | 674843 | 3833.97 | 631 | 610 | 175.9 |
| D | 8 | 176 | 68385 | 385.4 | 631 | 610 | 175.9 |
| D | 2 | 249 | 61524 | 346.38 | 631 | 610 | 175.9 |
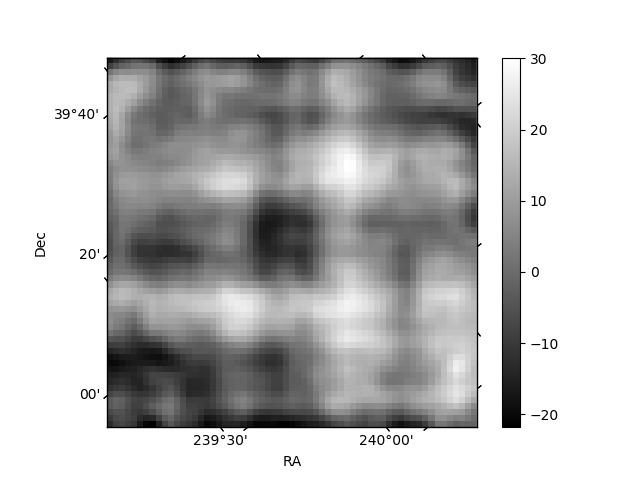
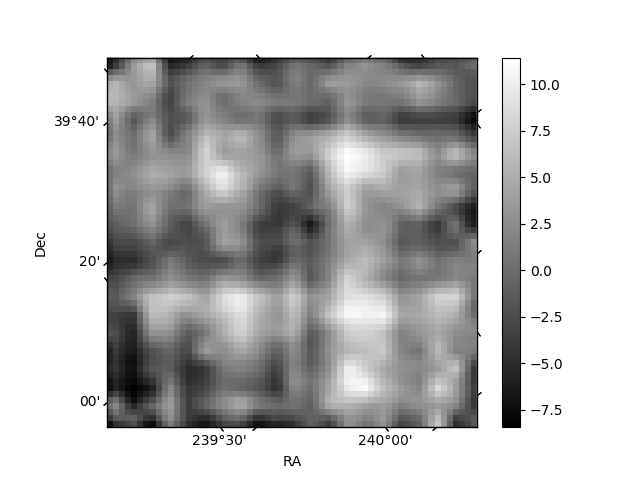
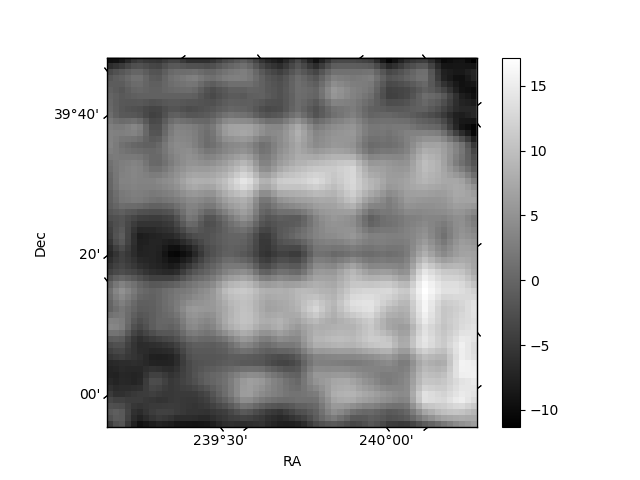
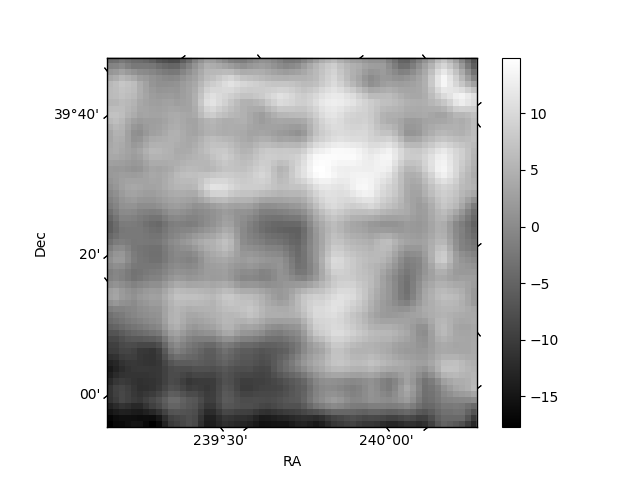
Histogram calculated using DETX and DETY for each event in the final _common_clean file
| Quadrant A | 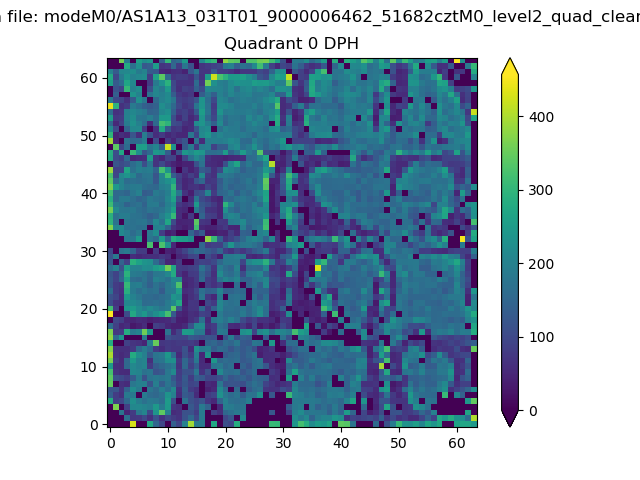 |
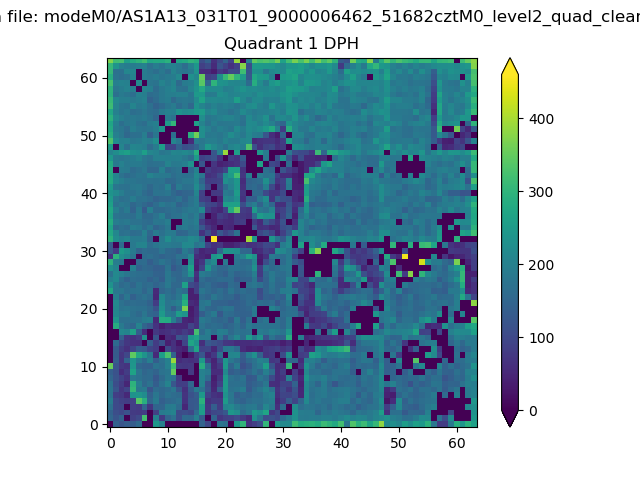 |
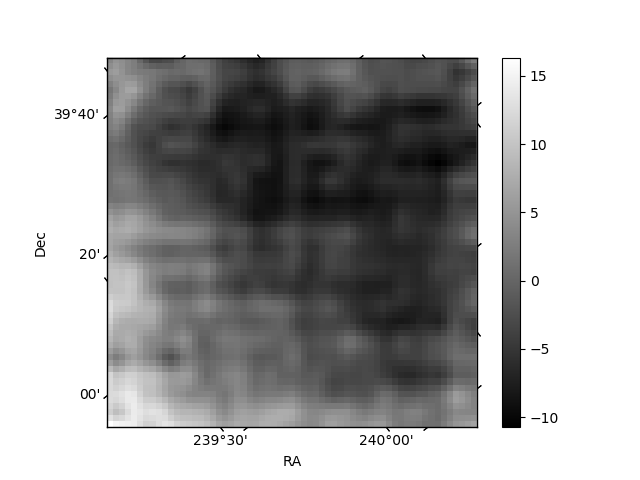
Quadrant B |
|---|---|---|---|
| Quadrant D | 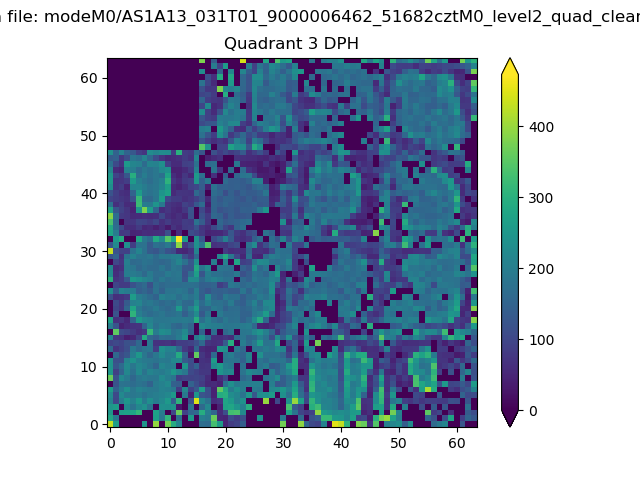 |
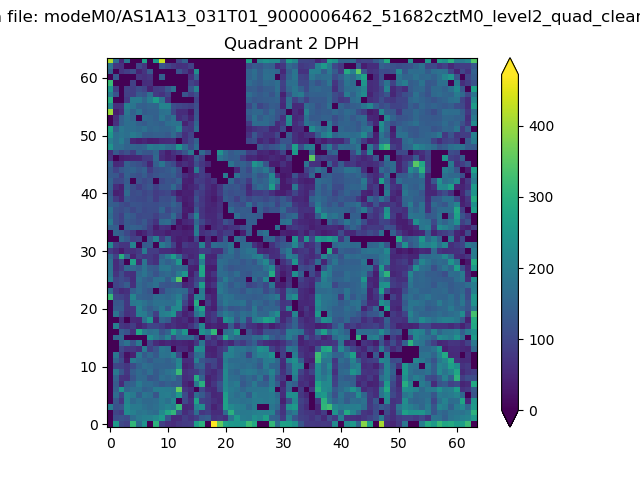 |
Quadrant C |
| Plot type | Count rate plots | Images |
|---|---|---|
| Comparison with Poisson distribution Blue bars denote a histogram of data divided into 1 sec bins. Red curve is a Poisson curve with rate = median count rate of data. |
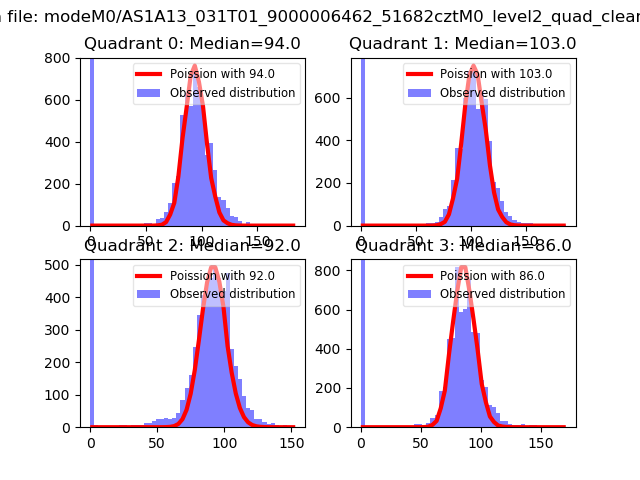 |
 |
| Quadrant-wise count rates Data is divided into 100 sec bins |
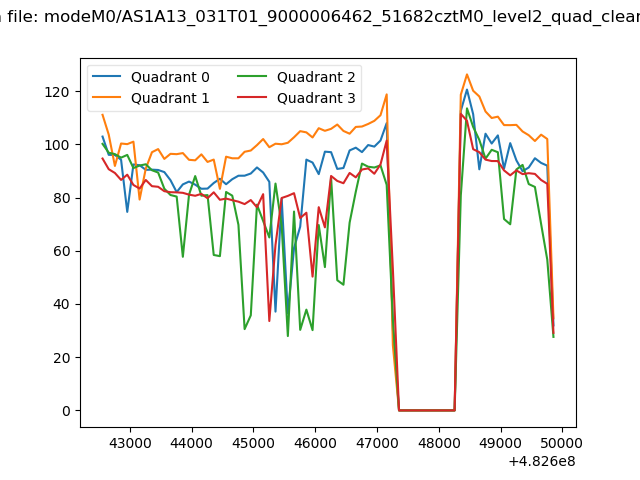 |
|
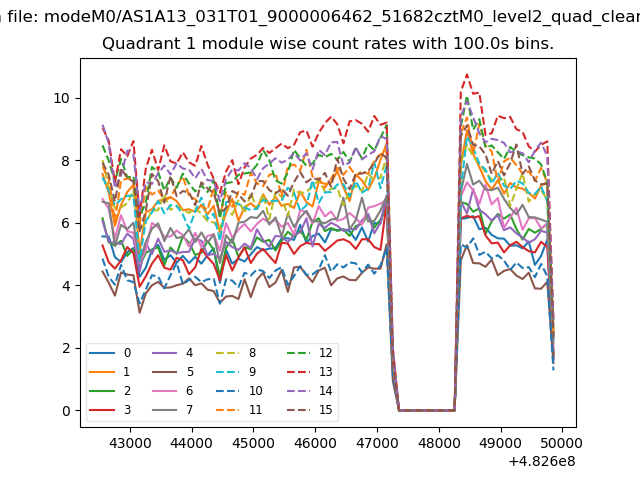
| Module-wise count rates for Quadrant A Data is divided into 100 sec bins |
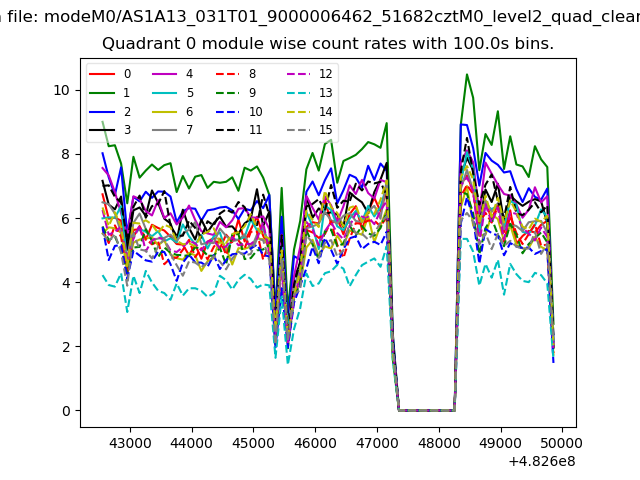 |
 |
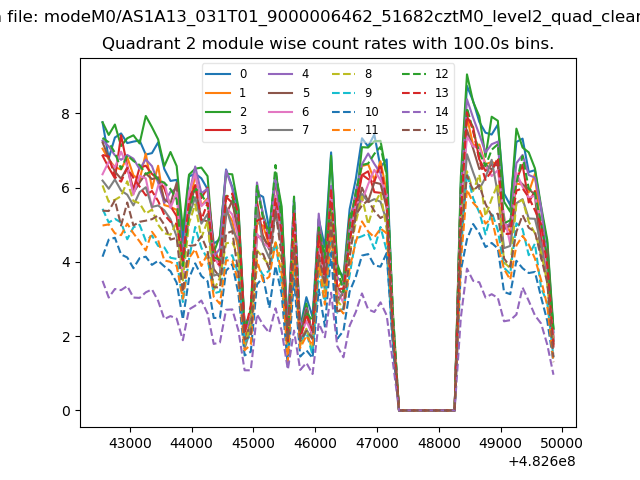
| Module-wise count rates for Quadrant B Data is divided into 100 sec bins |
 |
 |
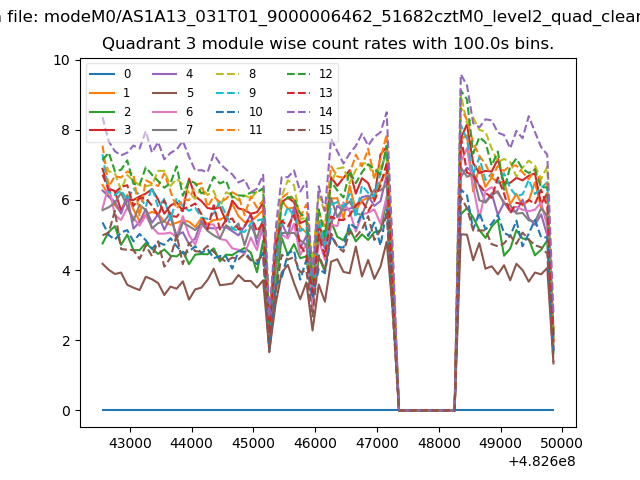
| Module-wise count rates for Quadrant C Data is divided into 100 sec bins |
 |
 |
| Module-wise count rates for Quadrant D Data is divided into 100 sec bins |
 |
 |
| Parameter | Plot |
|---|---|
| CZT HV Monitor | 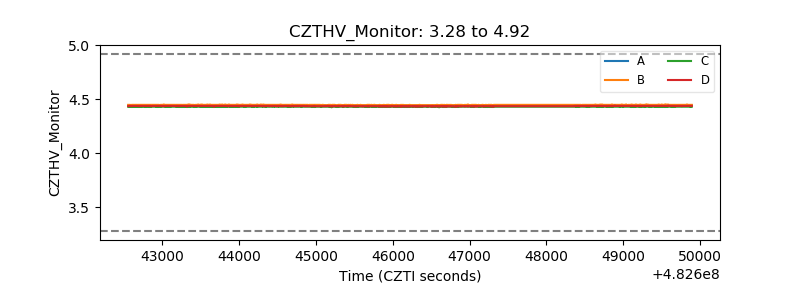 |
| D_VDD | 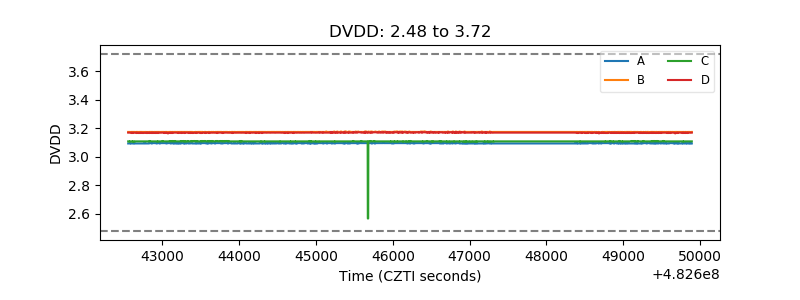 |
| Temperature 1 | 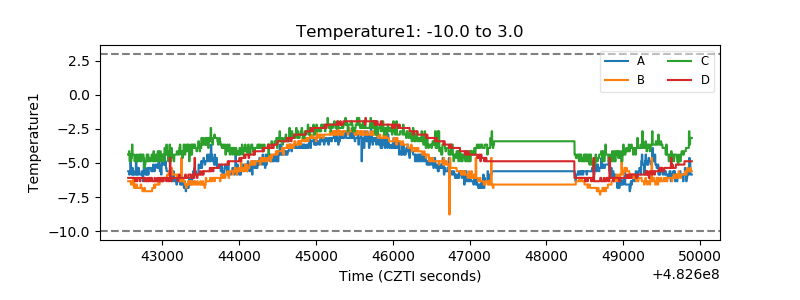 |
| Veto HV Monitor | 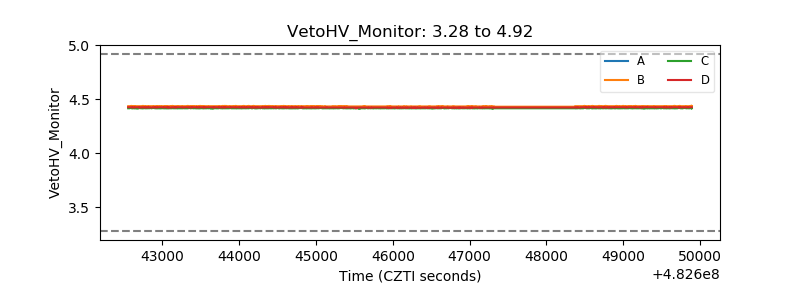 |
| Veto LLD | 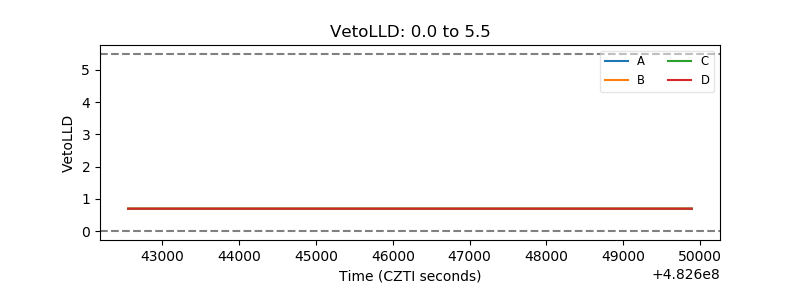 |
| Alpha Counter | 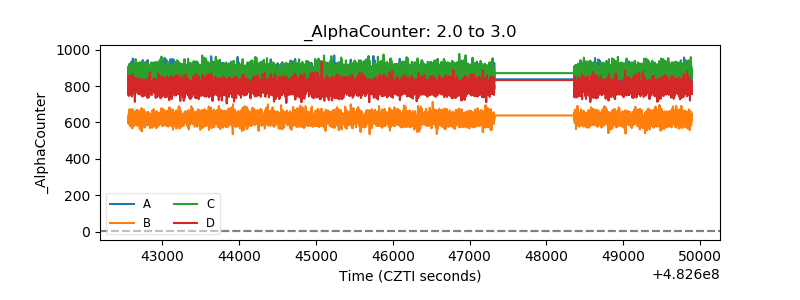 |
| _CPM_Rate | 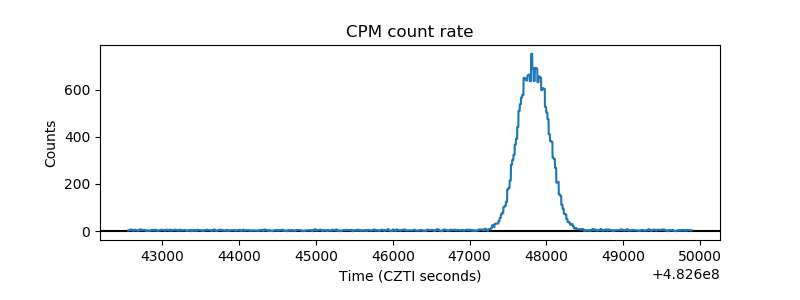 |
| CZT Counter | 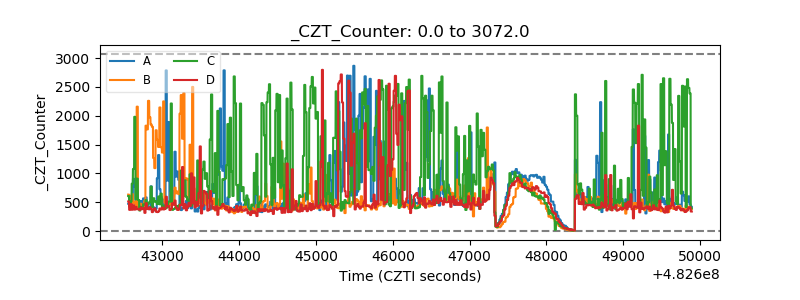 |
| +2.5 Volts monitor | 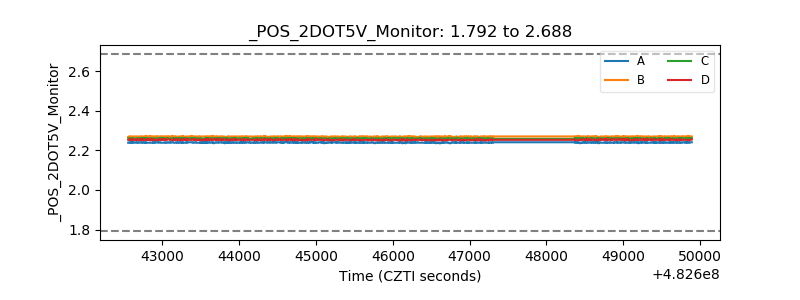 |
| +5 Volts monitor | 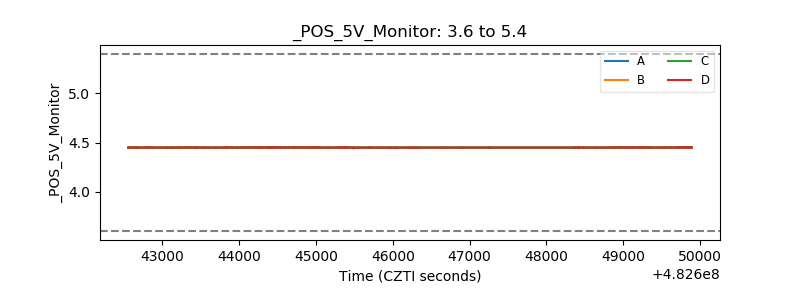 |
| _ROLL_ROT | 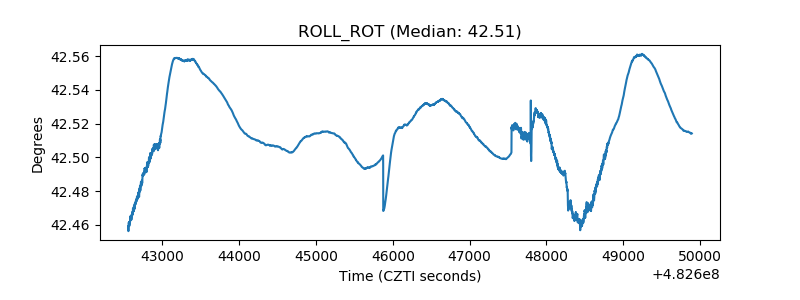 |
| _Roll_DEC | 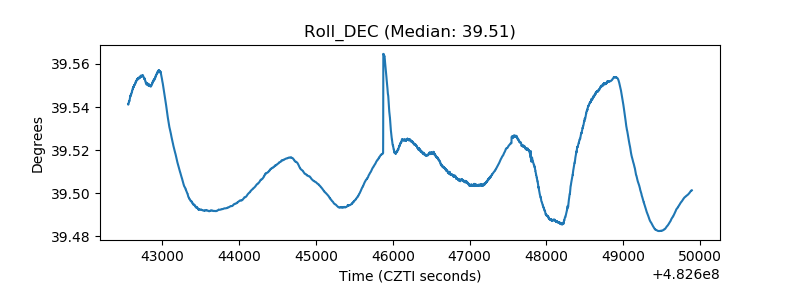 |
| _Roll_RA | 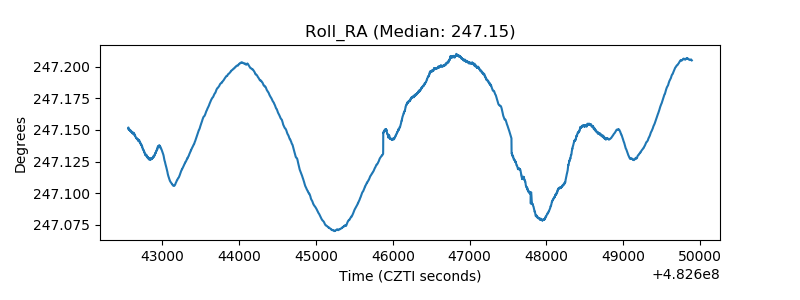 |
| Veto Counter | 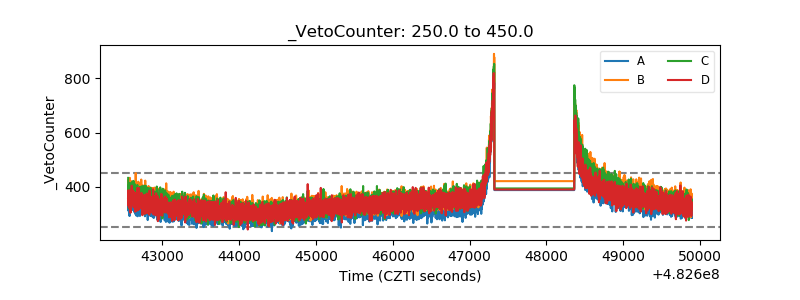 |