| Param | Original file | Final file |
|---|---|---|
| Filename | modeM0/AS1A13_031T01_9000006462_51684cztM0_level2.fits | modeM0/AS1A13_031T01_9000006462_51684cztM0_level2_quad_clean.evt |
| Size (bytes) | 469,088,640 | 92,275,200 |
| Size | 447.4 MB | 88.0 MB |
| Events in quadrant A | 3,716,635 | 610,311 |
| Events in quadrant B | 3,981,168 | 657,279 |
| Events in quadrant C | 5,731,085 | 535,764 |
| Events in quadrant D | 3,442,394 | 548,510 |
| Mode M9 | |||
|---|---|---|---|
| Quadrant | BADHDUFLAG | Total packets | Discarded packets |
| A | 0 | 11 | 0 |
| B | 0 | 11 | 0 |
| C | 0 | 11 | 0 |
| D | 0 | 11 | 0 |
| Mode M0 | |||
|---|---|---|---|
| Quadrant | BADHDUFLAG | Total packets | Discarded packets |
| A | 0 | 15187 | 1 |
| B | 0 | 16147 | 1 |
| C | 0 | 21509 | 1 |
| D | 0 | 14726 | 1 |
| Mode SS | |||
|---|---|---|---|
| Quadrant | BADHDUFLAG | Total packets | Discarded packets |
| A | 0 | 128 | 0 |
| B | 0 | 128 | 0 |
| C | 0 | 128 | 0 |
| D | 0 | 128 | 0 |
| Quadrant | Total seconds | Saturated seconds | Saturation percentage |
|---|---|---|---|
| A | 6338 | 172 | 2.713790% |
| B | 6339 | 293 | 4.622180% |
| C | 6339 | 860 | 13.566809% |
| D | 6339 | 178 | 2.808014% |
Noise dominated data is calculated using 1-second bins in cleaned event files. If a bin has >2000 counts, and if more than 50% of those come from <1% of pixels, then it is considered to be noise-dominated and hence unusable.
| Quadrant | # 1 sec bins | Bins with >0 counts | Bins with >2000 counts | High rate bins dominated by noise | Noise dominated (total time) | Noise dominated (detector-on time) | Marked lightcurve |
|---|---|---|---|---|---|---|---|
| A | 7443 | 6339 | 71 | 71 | 0.95% | 1.12% | 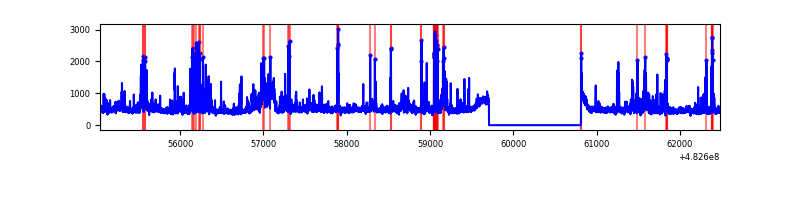 |
| B | 7444 | 6340 | 141 | 141 | 1.89% | 2.22% | 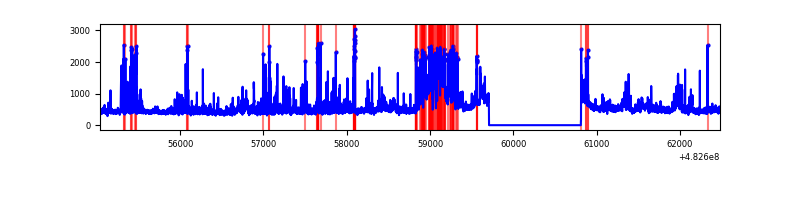 |
| C | 7444 | 6340 | 770 | 770 | 10.34% | 12.15% | 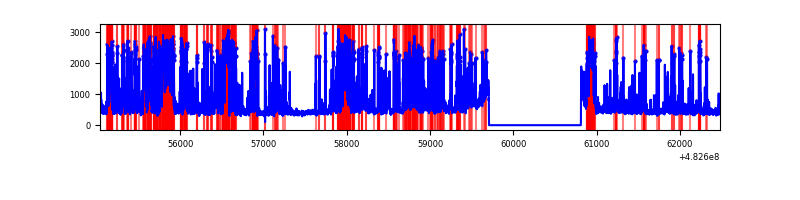 |
| D | 7444 | 6340 | 92 | 92 | 1.24% | 1.45% | 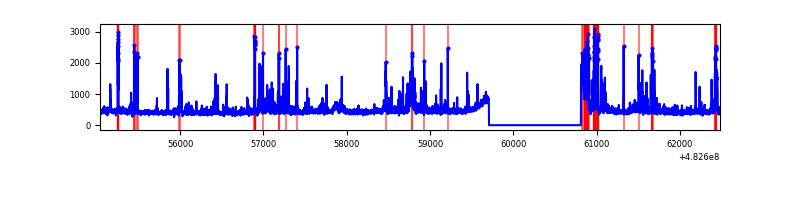 |
Top three noisy pixels from each quadrant. If the there are fewer than three noisy pixels in the level2.evt file, extra rows are filled as -1
| Pixel properties | Quadrant properties | ||||||
|---|---|---|---|---|---|---|---|
| Quadrant | DetID | PixID | Counts | Sigma | Mean | Median | Sigma |
| A | 12 | 3 | 135130 | 797.92 | 690 | 675 | 168.5 |
| A | 3 | 14 | 128234 | 757.0 | 690 | 675 | 168.5 |
| A | 7 | 206 | 120592 | 711.65 | 690 | 675 | 168.5 |
| B | 10 | 44 | 569481 | 3911.32 | 679 | 656 | 145.4 |
| B | 5 | 173 | 126191 | 863.2 | 679 | 656 | 145.4 |
| B | 10 | 41 | 108688 | 742.84 | 679 | 656 | 145.4 |
| C | 15 | 189 | 2010379 | 11622.63 | 632 | 628 | 172.9 |
| C | 0 | 192 | 377495 | 2179.46 | 632 | 628 | 172.9 |
| C | 13 | 3 | 225240 | 1298.95 | 632 | 628 | 172.9 |
| D | 6 | 42 | 220531 | 1188.54 | 663 | 636 | 185.0 |
| D | 15 | 94 | 130384 | 701.29 | 663 | 636 | 185.0 |
| D | 2 | 249 | 99488 | 534.3 | 663 | 636 | 185.0 |
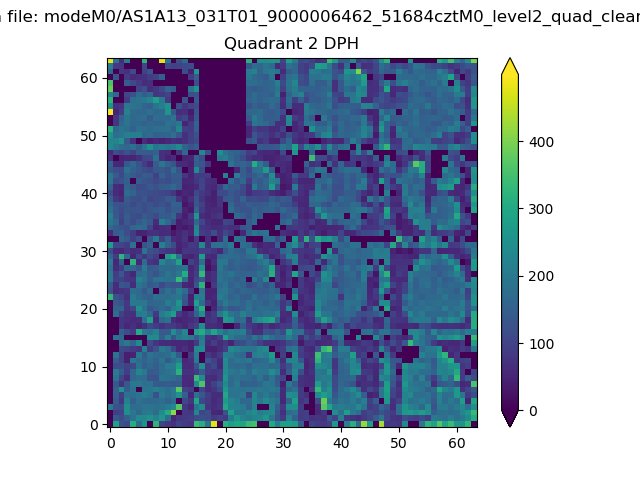
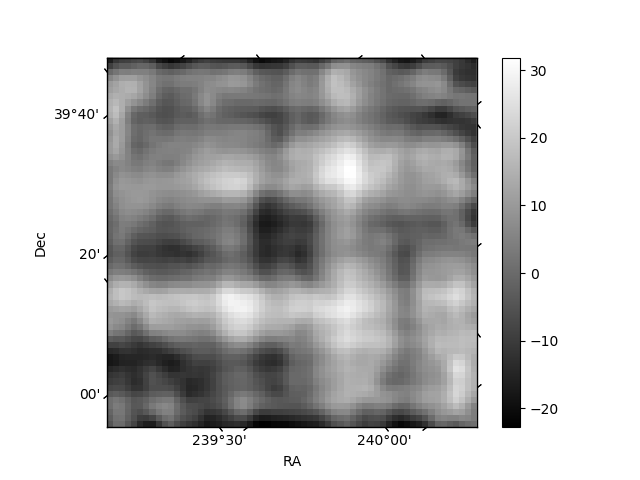
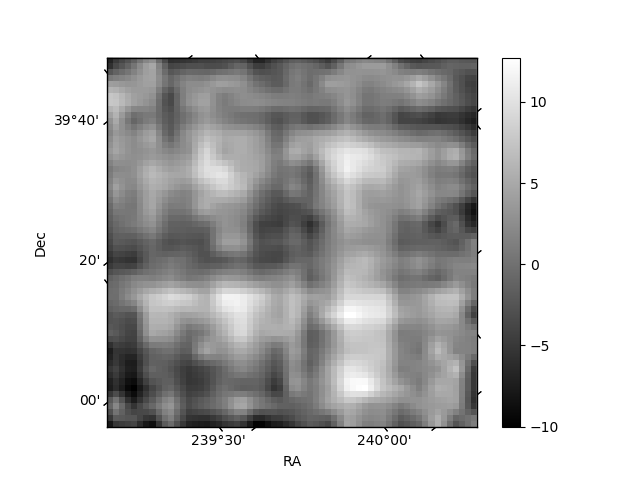
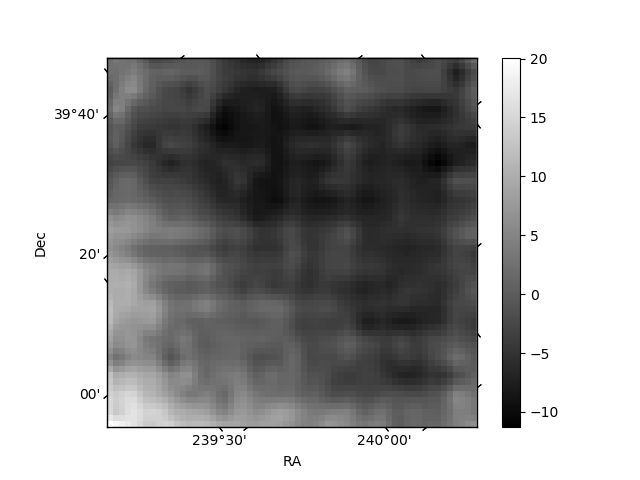
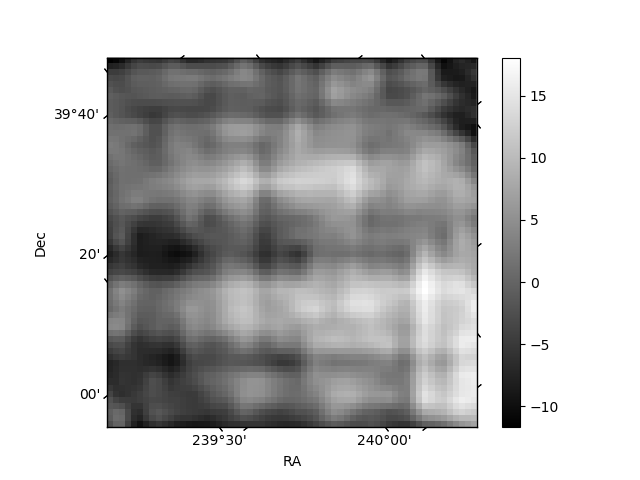
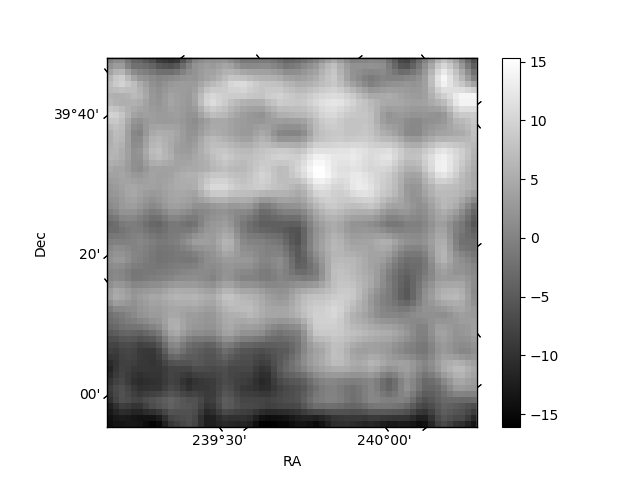
Histogram calculated using DETX and DETY for each event in the final _common_clean file
| Quadrant A | 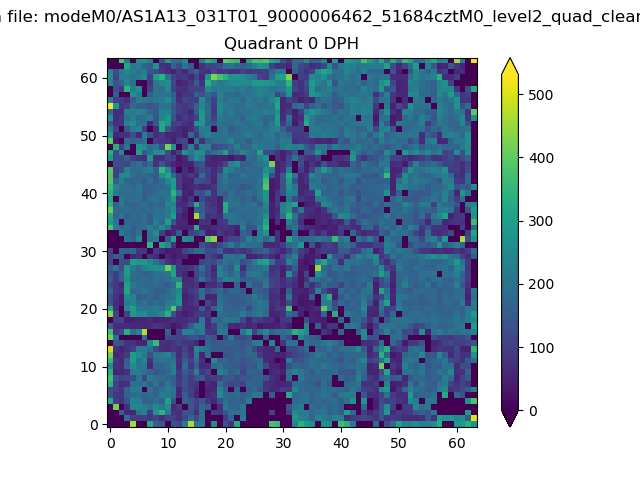 |
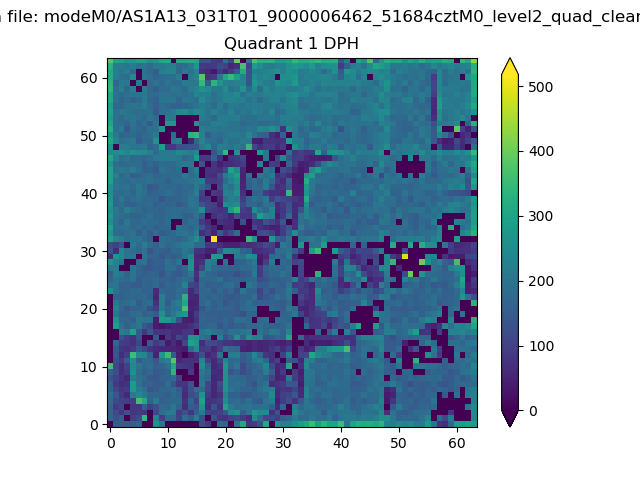 |
Quadrant B |
|---|---|---|---|
| Quadrant D | 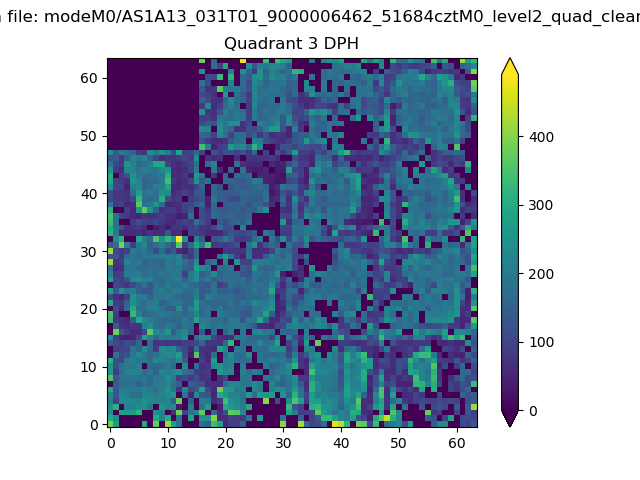 |
 |
Quadrant C |
| Plot type | Count rate plots | Images |
|---|---|---|
| Comparison with Poisson distribution Blue bars denote a histogram of data divided into 1 sec bins. Red curve is a Poisson curve with rate = median count rate of data. |
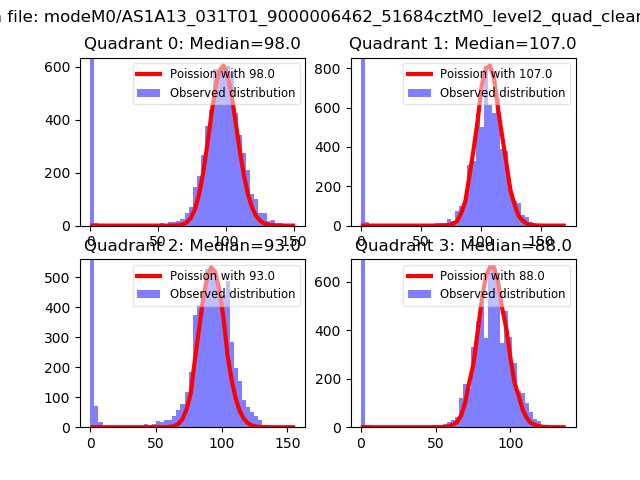 |
 |
| Quadrant-wise count rates Data is divided into 100 sec bins |
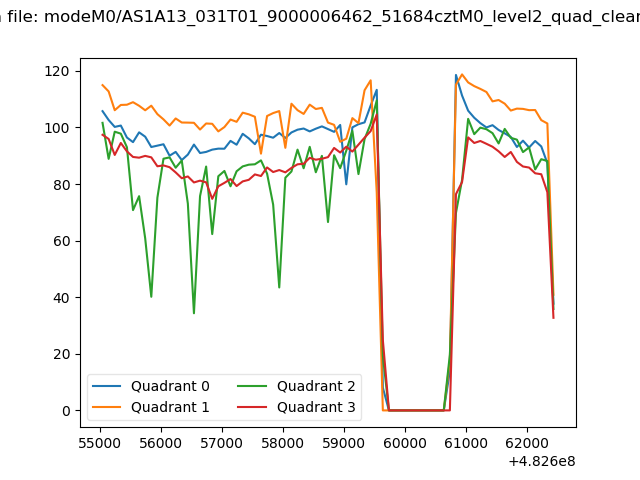 |
|
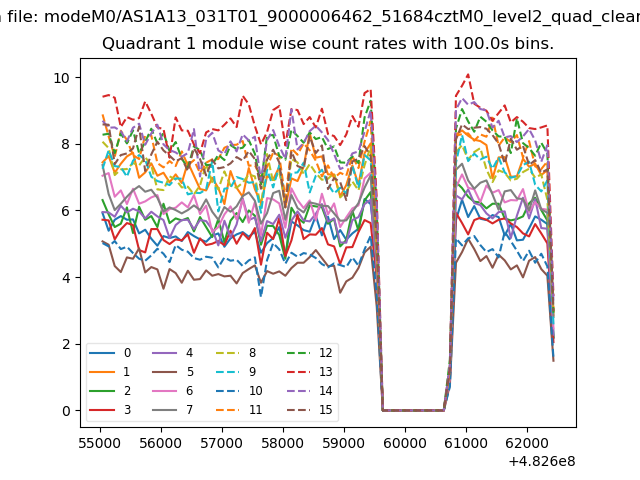
| Module-wise count rates for Quadrant A Data is divided into 100 sec bins |
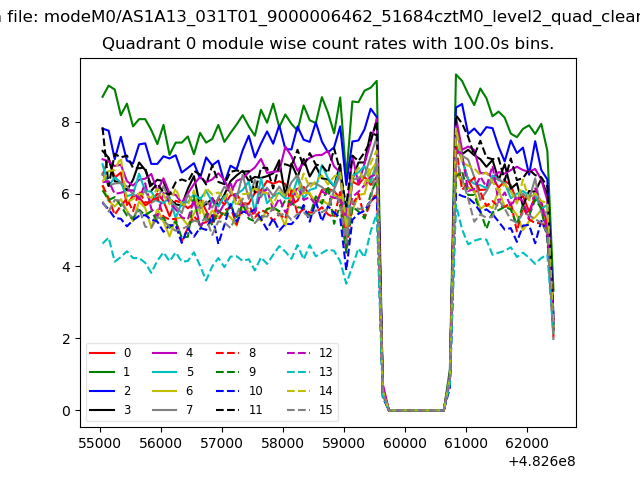 |
 |
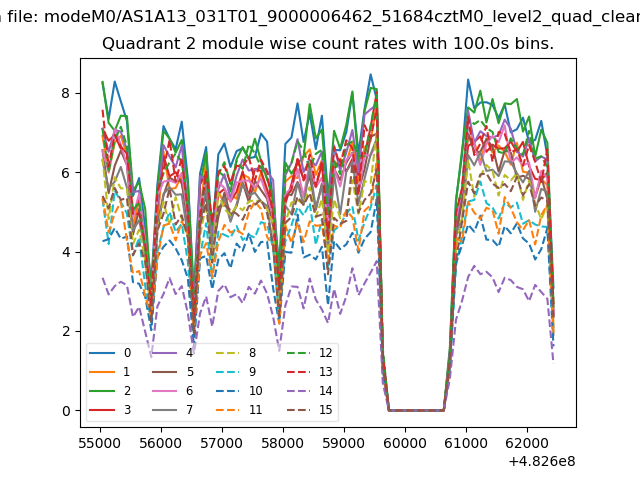
| Module-wise count rates for Quadrant B Data is divided into 100 sec bins |
 |
 |
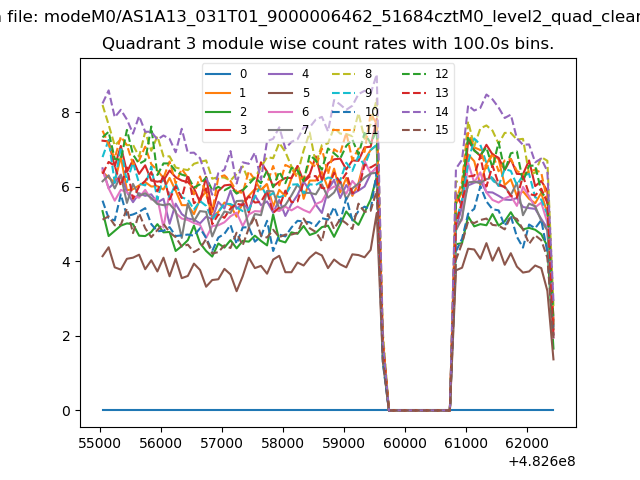
| Module-wise count rates for Quadrant C Data is divided into 100 sec bins |
 |
 |
| Module-wise count rates for Quadrant D Data is divided into 100 sec bins |
 |
 |
| Parameter | Plot |
|---|---|
| CZT HV Monitor | 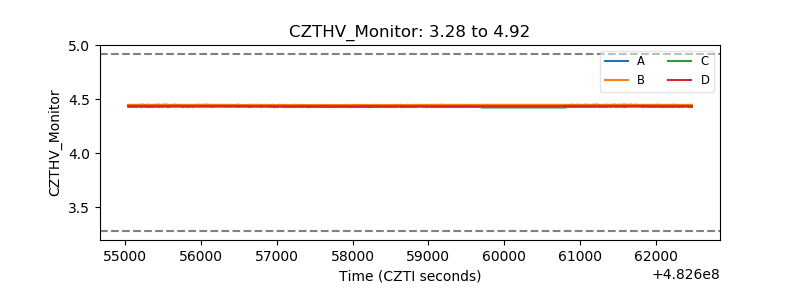 |
| D_VDD | 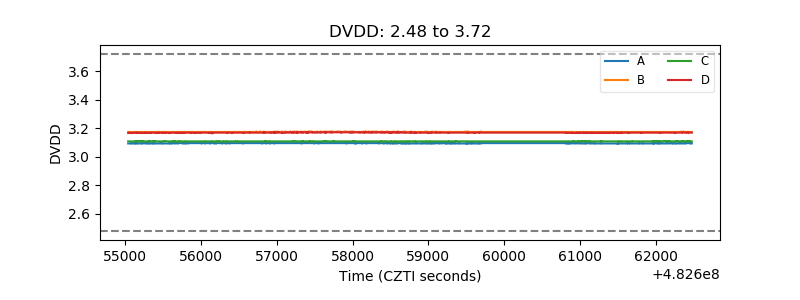 |
| Temperature 1 | 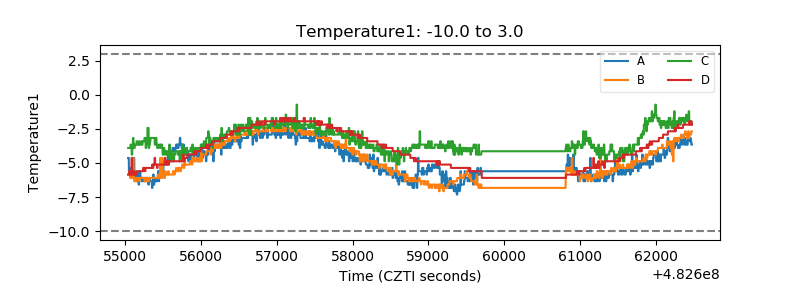 |
| Veto HV Monitor |  |
| Veto LLD | 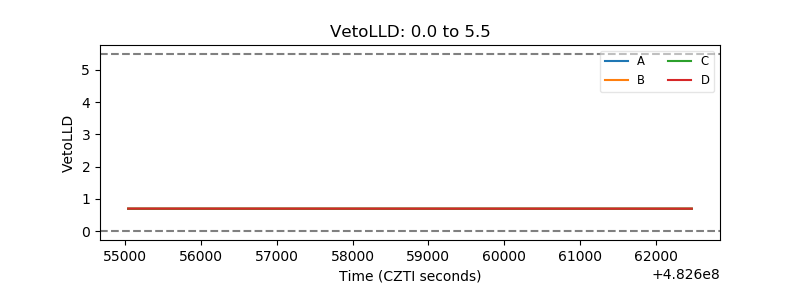 |
| Alpha Counter | 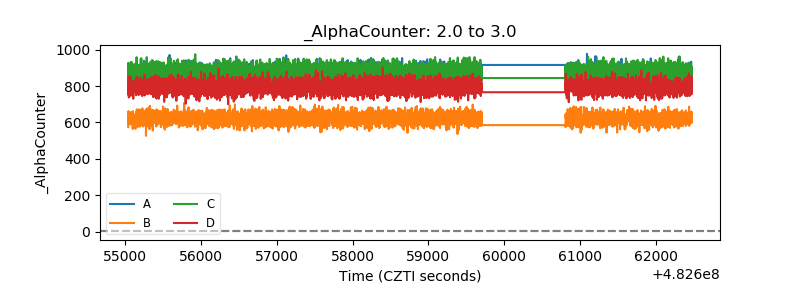 |
| _CPM_Rate | 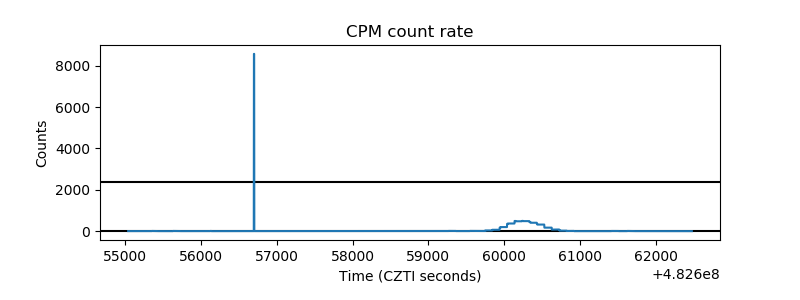 |
| CZT Counter | 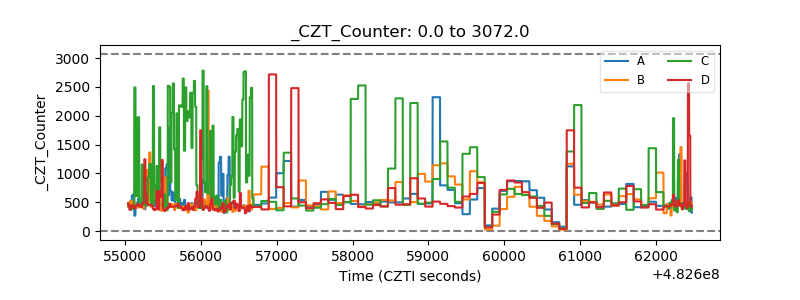 |
| +2.5 Volts monitor | 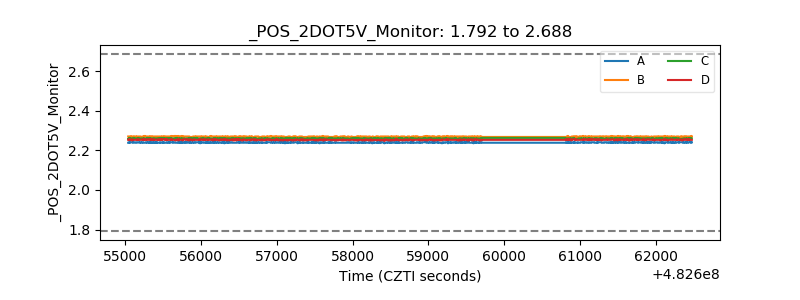 |
| +5 Volts monitor | 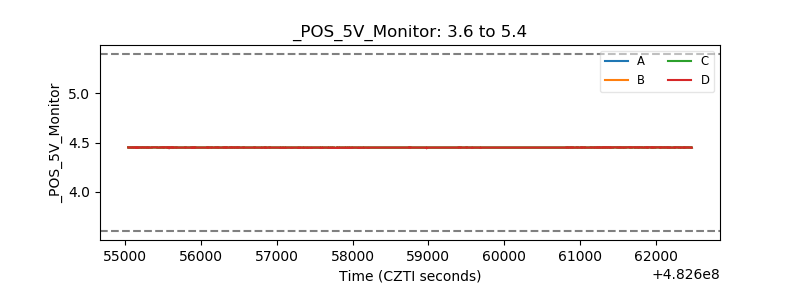 |
| _ROLL_ROT | 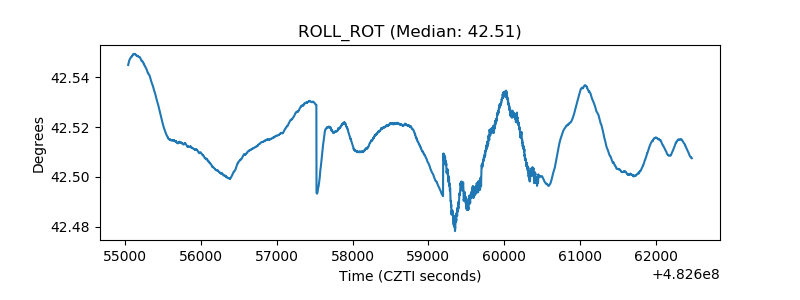 |
| _Roll_DEC | 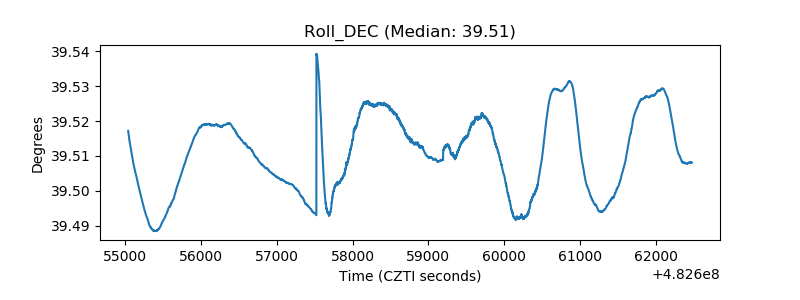 |
| _Roll_RA | 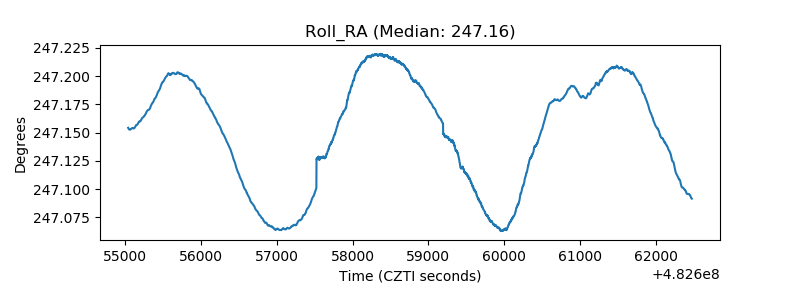 |
| Veto Counter | 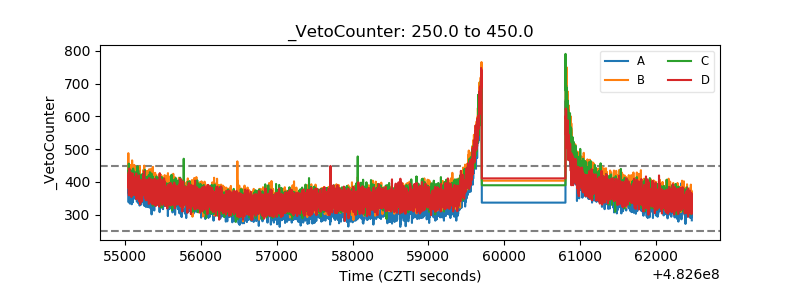 |